SAND Price PredictionI am very interested in the metaverse. In this post, I list the 1.618 fib extension level, which, should be the peak of the next bull run. Accumulation time is in.
SANDUSD.PM trade ideas

SANDUSD (4H) - Bearish reversalHi Traders
SANDUSD (4H Timeframe)
Waiting for the downward break of 0.433 support level which will complete a bearish trend reversal pattern to go SHORT. Only the upward break of 0.462 would cancel the bearish scenario.
Trade details
Entry: 0.433
Stop loss: 0.462
Take profit 1: 0.417
Take profit 2: 0.387
Score: 6
Strategy: Bearish reversal

✴️ The Sandbox Starts To Recover (82% - 148% Potential)The MACD gives it away.
The Sandbox starts to recover after hitting a new low. Notice that the low this month is lower than late Dec. '22.
Now, look at the MACD:
We have a higher low, June '23 vs Dec. '22.
The next signal is the bullish cross, when the MACD line (blue) crosses upward the signal line (orange).
The histogram has gone green as well which lends additional support to this signal.
One signal in isolation can be dangerous, chart signals should be taken in together with the broader context of the chart/market.
We have the MACD bullish cross, bullish divergence and green histogram.
SANDUSD is now trading daily above EMA10 and yesterday managed close to above EMA21.
Then we have the bigger market picture which is bullish based on Bitcoin hitting a multi-months high and many of the top Altcoins hitting the highest price in more than a year.
All this together can work to say that The Sandbox is getting ready to grow.
Even with that said, we prepare for all scenarios in case things change. What's bullish today can become bearish tomorrow and vice versa.
Take your time to study and plan.
Make sure to invest in yourself, in your growth, in your tools... Success, winning, comes with a stable mindset and the amount of work and dedication that you put in.
If there is no energy in what you are doing, it is hard to win... But if you focus and take care of the details as you go, in the end you will be rewarded with your desired results.
Namaste.

SAND Looks Ready to Breakout!Traders,
SAND is in prime position to move even higher than it already has these past few weeks. I haven't entered this trade yet but may soon pending these occurrences:
I want to see a move above the 200 day ma with confirmation
I want to see a break above the red descending TL
I want to see a move above the Ichimoku cloud
What we have:
A breakout of the triangle in Logarithmic View. Click the "Log" text in the bottom left corner of the chart to see this view.
What I don't like:
RSI nearing oversold
Let me know in the comments if/when you decide to enter this trade.
Stew

SANDUSD (1H) - Bullish breakoutHi Traders
SANDUSD (1H Timeframe)
The market is in an uptrend and we are waiting for an entry signal to go LONG above the 0.541 resistance level. Only the downward break of 0.517 would cancel the bullish scenario.
Trade details
Entry: 0.541
Stop loss: 0.517
Take profit 1: 0.555
Take profit 2: 0.579
Score: 8
Strategy: Bullish breakout

Buy crypto Favorite crypto ever as of now and 10 other ones including Solana and cardano
But cryptos dollar is worthless
SANDUSD Strong RSI The RSI structure here heavily favours the bulls as the rise up has already began in comparison to others where they are still in free fall phase
I expect a double bottom on chart and a complete reversal

SAND long setupGaming/meta play. Looking to scale into position on 15/30 min chart flat support levels. Target 1 127% fib extension, target 2 161% fib extension

SANDUSD long positionSANDUSD looks bullish.
Not the best entry now and kina difficult to setup the stop loss but the trend continuation is very likely now so if you wanna take a risk and long SAND, you can catch the uptrend continuation now.
Take profit levels / targets , stop loss are shown on the chart

SANDUSD 1h Timeframe,bearish divergenceWe can clearly see a bullish flag formation, but there is a divergence on the RSI and the trend has been reversed. so we can take a possible short trade with the following setup:

SANDUSDTIt is expected that the rise to the specified areas will be a corrective rise, not an impulse, including the drainage of another strong last downward process

SANDUSD (4H) - Bullish wave LTFHi Traders
SANDUSD (4H Timeframe)
A high probability, entry signal to go LONG will be given with the upward break of 0.708 after the market found support at 0.665. Only the downward break of 0.665 would cancel the bullish scenario.
Trade details
Entry: 0.708
Stop loss: 0.665
Take profit 1: 0.773
Take profit 2: 0.839
Score: 8
Strategy: Bullish wave LTF

Buy crypto Quarter point 0.40 to 1.0 !
Weekly high broken by bullish candle and now is back to it to confirm the supply now turn into demand zone which means buy ironically at the major quarter point 0.6

SANDUSD - BIG resistanceHow we could see after BIG pump, correction is here. Price could not pass resistance and price falled.
SAND needs good news and money for pump like every coin today.
GOOD scenario
- price will fall during march and then pump to all time high during next months
BAD scenario
- price will fall during march and then dump to 0,20usd during next months

💎 $SAND can be a good risk to reward #crypto trade Relatively safe entry at this level. The upside potential gain is 70%, if you plan to stay in the trade for 1 - 2 months can be extremely rewarding. Good luck.

Possible Bearish trend after distribution zone breakdownWe had a good advance zone and saw an appreciation of 23%. Currently it is in the distribution zone, on the breakdown we can see a possible bearish trend.

SANDUSDWatching the daily chart on SANDUSD I can see that it broke out of a bullish pennant and the 1.618 level of fib.
Currently the price is retracing from the big green break out candle. It's possible that price comes back below the 1.618 fib or lower to retest the previous resistance.
2.618 of fib or $1.035 is the next major resistance level to look at. If that breaks it can reach the flagpole target of $1.24.
If it crashes. We can see price go back to $0.63-$0.53 levels.
Waiting to see if this bullish pennant plays out.

#SAND $SAND #SANDUSDSand have to finish above the MA 200 with big volume to confirm we are in a bullish trend, only then i will enter the trade!

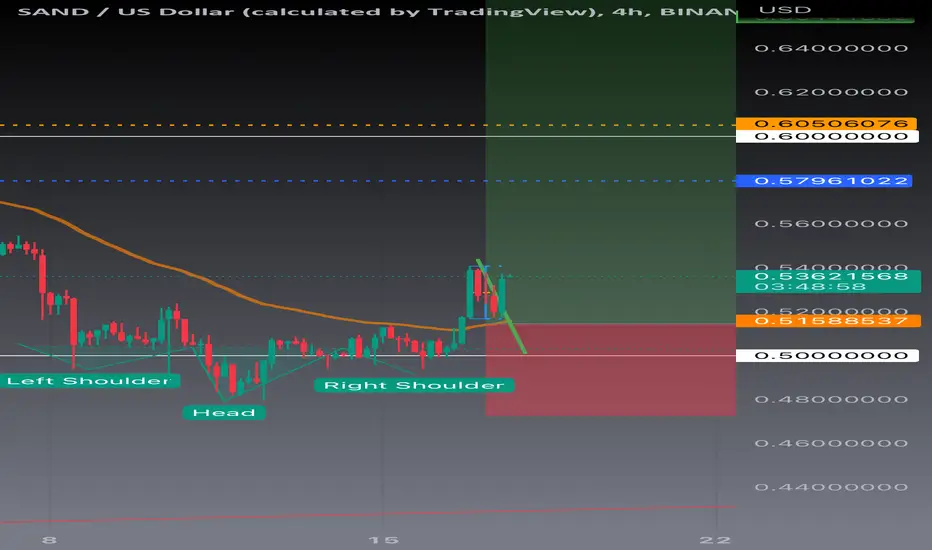
SANDUSD IdeaA reversal idea for SANDUSD
Showing an inverted H&S pattern with each arm of the H&S pattern being above the channel
I expect this pattern to act as a reversal pattern and push price up further towards the dashed green line
This dashed line is the first place of resistance

SANDUSD (4H) - Bullish wave LTFHi Traders
SANDUSD (4H Timeframe)
A high probability, entry signal to go LONG will be given with the upward break of 0.725 after the market found support at 0.667. Only the downward break of 0.667 would cancel the bullish scenario.
Trade details
Entry: 0.725
Stop loss: 0.667
Take profit 1: 0.818
Take profit 2: 0.911
Score: 9
Strategy: Bullish wave LTF

NeutralSand
It was behind a downward trend for months , But now it has managed to break .
The last time we exited this currency with the beautiful identification of the channel ceiling and the number 8.36 .
If we manage to break 0.71 , we can set the next target at 0.96

Best entries for SAND and why I think it's a bull trap right nowI will be waiting for 25 and 20 cents to buy SAND if it couldn.t cross the the 200 EMA. If it did I will be entering after some retracement from the leg that broke the EMA maybe (61 or deeper retracement). Let me know what you think.

SANDUSDTFrom the new data, it became clear that the decline, wave B, has already ended, and that we are in the making of wave C, with a strong final decline
