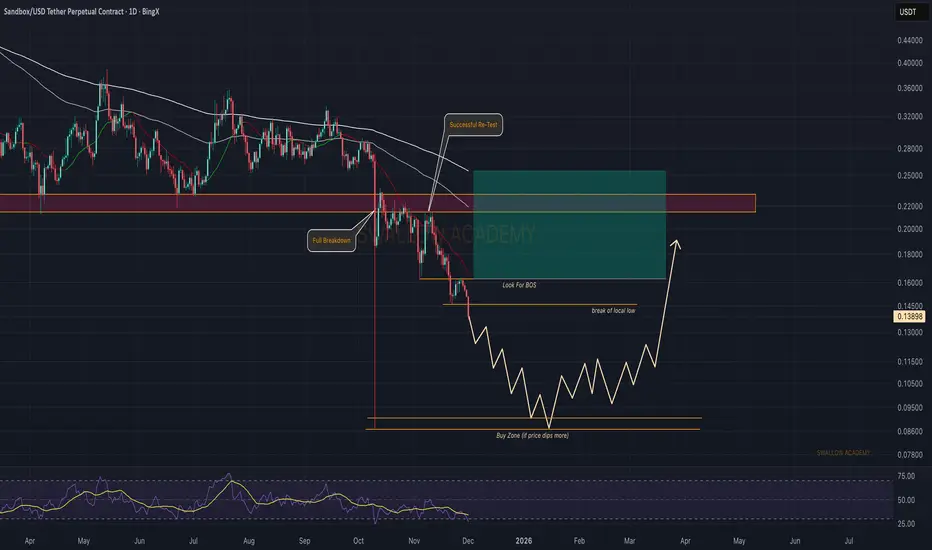
The Sandbox (SAND): Looking For Proper Break of Structure SAND broke down fully from its previous structure and is now sitting below all key levels. For now the chart still leans bearish, and as long as sellers keep control we might see one more push lower into the deeper buy zone. That’s where the better risk-to-reward setup would form.
If buyers manage to flip momentum earlier and give us a clean shift or reversal pattern above the current local low, we can look for a short-term bounce toward the upper resistance. Until then — patience. Let the chart show who’s in control.
Swallow Academy
Trade ideas
SANDUSDT 12H#SAND is moving inside a falling wedge pattern on the 12H timeframe. You can buy a small bag here and at the support level of $0.1466. If price breaks above the wedge resistance and the 12H SMA50, the potential targets are:
🎯 $0.1801
🎯 $0.2007
🎯 $0.2173
🎯 $0.2339
🎯 $0.2576
⚠️ Always remember to use a tight stop-loss and maintain proper risk management.


#SAND/USDT PUMP COMING ON SAND! #SAND
The price is moving within a descending channel on the 1-hour frame, adhering well to it, and is heading for a strong breakout and retest.
We have a bearish trend on the RSI indicator that is about to be broken and retested, which supports the upward breakout.
There is a major support area in green at 0.1980, representing a strong support point.
We are heading for consolidation above the 100 moving average.
Entry price: 0.2080
First target: 0.2121
Second target: 0.2170
Third target: 0.2217
Don't forget a simple matter: capital management.
When you reach the first target, save some money and then change your stop-loss order to an entry order.
For inquiries, please leave a comment.
Thank you.

#SANDUSDT Weekly Analysis — Final Base Test Before Potential Rec🏖️ #SANDUSDT Weekly Analysis — Final Base Test Before Potential Recovery?
🗓 Published: May 10, 2025
📊 Timeframe: 1W | Exchange: Binance
Author: @HamadaMark
🔍 Market Structure Overview
SAND has returned to its historical accumulation zone near $0.28–$0.33 after completing multiple falling wedge breakdowns throughout 2023–2025.
Price is now attempting a bounce from a major demand floor, forming what could become a mid-cycle double bottom.
📌 Macro Setup Observations:
✅ Retest of strong horizontal demand zone (2021 launch base)
✅ Clear panic wick below structure, followed by bounce
✅ Similar formation to 2022 → 2023 reversal setup
✅ Weekly candle reclaiming 200MA zone
🟦 Critical Support Zone (Demand Base):
Main Support: $0.28–$0.33
Panic Level / Invalid Zone: Close below $0.27–$0.25 = breakdown risk
🔻 If this zone fails, structure targets as low as $0.10–$0.07 become possible
🎯 Upside Resistance Targets (if Bounce Confirmed):
TP1: $0.4678 – Previous wedge support → now resistance
TP2: $0.8344 – Multi-month range top
TP3: $1.3493 – Mid-cycle top (2022 level reclaim)
⚖️ Risk/reward becomes attractive above $0.35 reclaim with macro upside of 100–300%
🧠 Strategy Insight
• DCA is favorable in the blue box zone with tight SL
• Stronger confirmation = reclaim of red box ($0.47)
• Breakout traders should wait for weekly close above $0.47 + retest
💡 Volume + structure confirm this area remains a “make or break” pivot zone
🗣 What’s Next?
If $0.28–$0.33 holds and we reclaim the $0.47–$0.50 resistance box, SAND could attempt a multi-leg recovery into Q3–Q4.
If we lose $0.27, exit and reassess at deeper levels.
📢 SAND is at its most critical level in years — this isn’t the time to fade structure. If it holds, the upside opens fast.
we ask Allah reconcile and repay

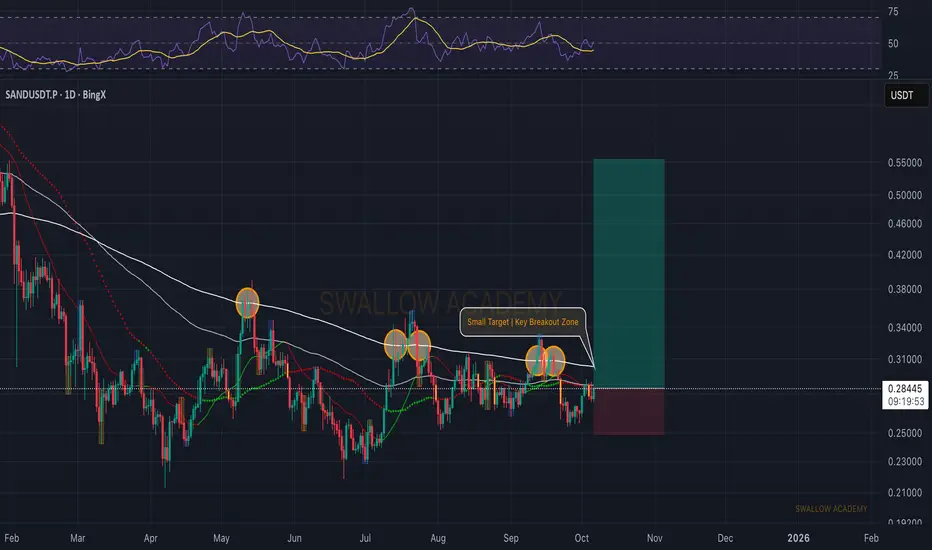
Sandbox (SAND): Expecting Breakout From 200EMASAND is again pushing into the breakout zone that has been rejecting price for months. This time, momentum looks better as buyers are holding higher lows and slowly pressing against EMAs. If we get a proper breakout here, that’s where the shift starts — continuation toward the $0.50 zone comes next.
Swallow Academy
Sandbox (SAND): Looking For Break of 200EMASandbox has been in a downtrend for quite some time, and currently we are looking for proper upward movement, which could give us a decent switch in trend and an opportunity for long positions.
So as of now we have to wait and once we get that last confirmation of breakout, then we will be looking for a long entry near that same 200EMA.
Swallow Academy

SAND is Ready for 130% + Up Move SAND is making a Triangle pattern at Support zone and It is Ready for Breakout from that pattern . and at the same time Altcoin Season Index is at 74 , when it is >75 it is sign of very bullish in altcoins and Breakouts will have very high potential to give a big move .
and at the same time Bitcoin dominance is decreasing and altcoins dominance is started increasing , so look on all the altcoins
and follow proper risk management , it has very good chances to move UP side but first we have to protect the down side , where risk management comes into game .
Follow for more Ideas and potential coins/ Stocks .

SANDUSDT.P stuck in $0.26–0.35 range — breakout soon?Introduction: SAND is coiling in a tight $0.30–0.33 box; reaction will set next swing.
Trend: Higher lows since $0.27, rising into supply.
Levels: Resist $0.33, ATH targets $0.35–0.38; support $0.30, then $0.292/$0.275.
Pattern: Range box; break/close outside decides.
Indicators: Price above EMAs; RSI mid-60s; volume steady.
Trade Plan:
Long: Break >$0.335, SL <$0.292, TP $0.35/$0.38.
Short: Reject $0.33 or lose $0.30, SL >$0.335, TP $0.292/$0.275.
Events: FOMC decision (Sep 16–17), late-Sep options expiry, Sandbox ecosystem updates.
Takeaway: Break-retest confirms strength; failure means deviation back to range.
Conclusion: Hold $0.30 → bias bullish; lose it → $0.275 next. Manage risk.
Disclaimer: Educational content, not financial advice.
Tags: #SAND #Altcoins #Breakout #Support #Resistance #TradingEducation #TechnicalAnalysis

Sand Short to 0.23$Sand Short to 0.2308
Enter 0.345
SL 0.3609
TP 0.23
Sand will retest Symmetrical Triangle's top.
SL would have manually in case of wick above the top
Low leverage can enter now

SANDUSDT UPDATE#SAND
Update
SAND Technical Setup
Pattern: Falling Wedge Pattern
Current Price: $0.280
Target Price: $0.38
Target % Gain: 40.33%
Technical Analysis: SAND is trading inside a long-term falling wedge on the daily chart, showing signs of accumulation at the lower trendline. A recent bounce highlighted a 40% rally, and a breakout above resistance could unlock further upside potential.
Time Frame: 1D
Risk Management Tip: Always use proper risk management and set stop-loss near key support.

BIG PUMP COMING ON SAND!SAND is looking like a classic market cycle, ready for a strong recovery and bull run. I expect a significant pump on this coin soon. This is a prime opportunity to buy at these levels.
A huge vertical move is coming—mark my words.
As always, stay profitable.
Dalin Anderson


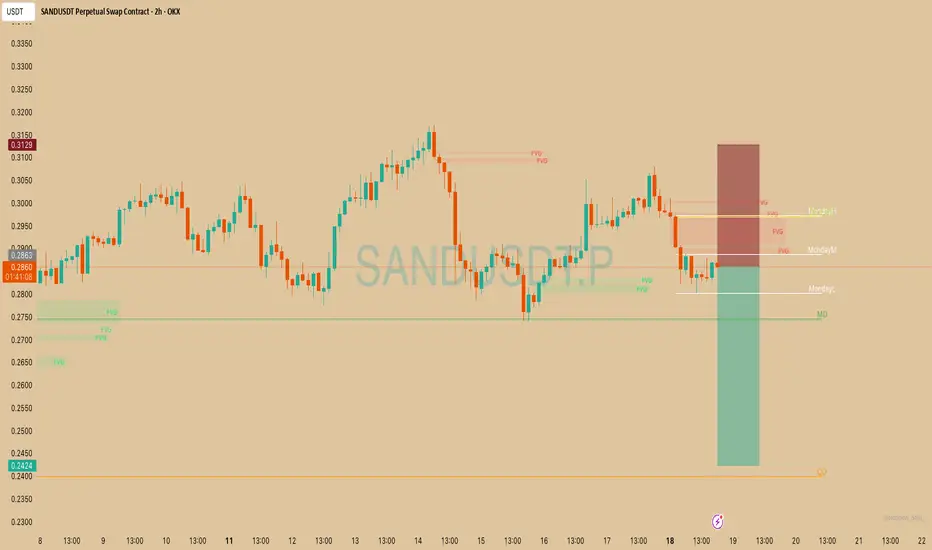
SAND SHORT SETUP1. Trade Direction: Short
The trader is betting on price going down.
The red box marks the stop-loss zone above, and the green box shows the take-profit zone below.
2. Key Levels on Chart
Monday High (MondayH), Monday Mid (MondayM), Monday Low (MondayL)
→ Weekly reference points used for intraday/weekly bias.
MO (Mid-Open?) and QQ (Quarterly Open)
→ Higher-timeframe levels for confluence.
FVG (Fair Value Gaps)
→ Highlighted imbalance zones where price may revisit before continuing trend.
3. Reasoning Behind the Short
Price is consolidating just under MondayM after rejecting higher FVG zones.
Entry is taken at the top of the consolidation (near an FVG supply zone).
Stop-loss is set just above the FVG / MondayM area (red box).
Target is a liquidity sweep below MondayL and towards the MO level (green box).
4. Risk-to-Reward (RR)
The trade setup shows a short entry around 0.286–0.288.
Stop-loss near 0.315 (above supply & FVG).
Take-profit near 0.242 (major liquidity pool + quarterly open).
This gives a ~1:4 to 1:5 RR (risking ~3 cents to gain ~14 cents).
5. Trade Idea Summary
Bias: Bearish (short).
Reason:
Rejection at FVG / supply zone.
Price trapped below MondayM.
Clear liquidity target below MondayL → MO → QQ.
Plan:
Enter short at ~0.286–0.288.
Stop above 0.315.
Target 0.242 (QQ).
SAND Breakout Alert!🚨 SAND Breakout Alert! 🚨
SAND is currently testing the red resistance zone 🔴
If price breaks out, the first target will be the green line level 🎯
A confirmed breakout here would signal bullish continuation and could push price higher ✅

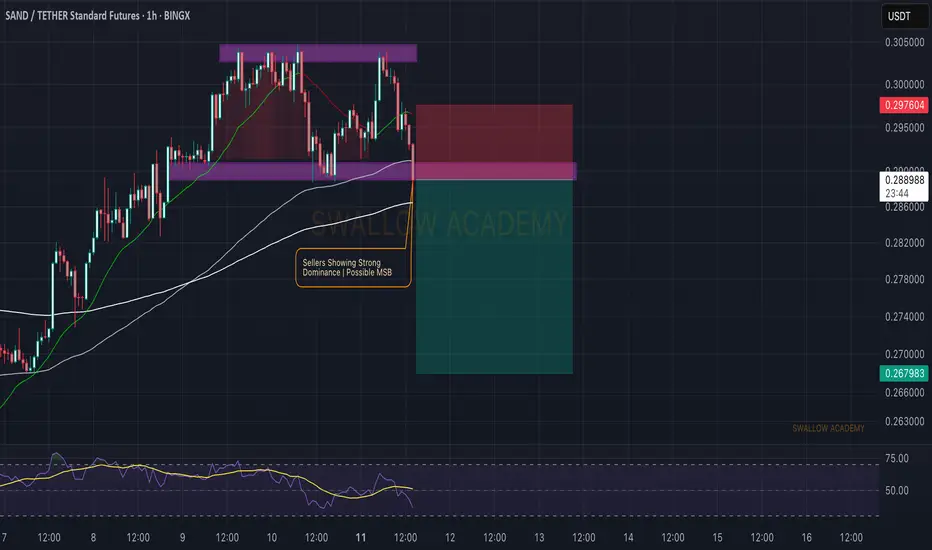
The Sandbox (SAND): Potential Breakdown + Downside Movement |SAND looks like it's about to break and form the MSB that might result in a good 7% downward movement for us.
Now the week has started pretty sharp on the markets, which seemed like a liquidity grab and more of a liquidity drag as well so what we are looking at is the MSB here, which might be a good short position to take here.
Swallow Academy
#SANDBOX #SAND #SANDUSD #SANDUSDT #Analysis #Eddy#SANDBOX #SAND #SANDUSD #SANDUSDT #Analysis #Eddy
A reversal structure has formed on the weekly and daily time frames, and the necessary confirmations have been given on the weekly time frame. Considering the structure formed on the above time frame, as well as the behavior of this currency in the past chart, it is expected that this currency will perform a good pump.
I have identified the important supply and demand zones of the higher timeframe for you.
This analysis is based on a combination of different styles, including the volume style with the ict style.
Based on your strategy and style, get the necessary confirmations for this analysis to enter the trade.
Don't forget about risk and capital management.
The responsibility for the transaction is yours and I have no responsibility for your failure to comply with your risk and capital management.
💬 Note: The red order block cannot stop the growth of the price of this currency and by 1.20 dollar this currency will be pumped more than 300%.
Be successful and profitable.

SAND/USDT Analysis – Major Accumulation or Imminent Breakdown?🔍 Overview:
SAND is currently trading at a crucial historical support zone, which has held firm multiple times since mid-2022. The chart shows a prolonged accumulation phase, offering significant potential for a major breakout or a decisive breakdown depending on market reaction.
---
🧠 Price Structure & Price Action:
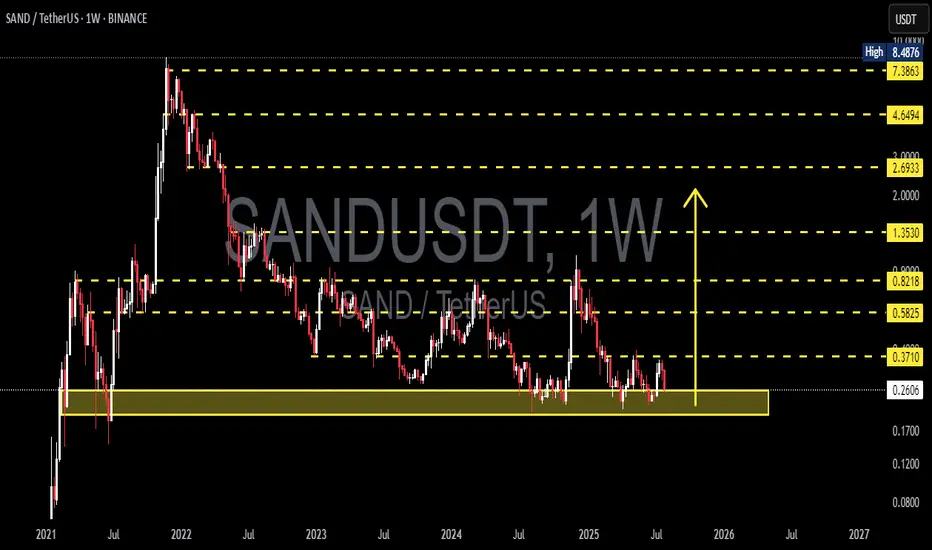
After reaching an all-time high at $8.4876 in late 2021, SAND has been in a long-term downtrend.
However, over the past year, it has formed a wide base around the $0.26–$0.37 range — a clear sign of potential accumulation.
Price is currently moving sideways in a compression structure, signaling the build-up of energy for the next explosive move.
---
🧱 Key Levels:
Level Function Status
$0.2613 Primary Historical Support Currently being tested
$0.3710 Local Resistance Needs to be reclaimed
$0.5825 Major Resistance Bullish confirmation level
$0.8218 Weekly S/R Flip Mid-range target
$1.3530 Psychological Resistance Potential medium-term target
$2.6933 / $4.6494 Expansion Phase Targets Long-term upside potential
$7.3863 Pre-ATH Resistance Late-cycle target
---
🟢 Bullish Scenario:
1. If price holds and bounces off the $0.26–$0.37 demand zone, a bullish reversal may unfold.
2. A weekly close above $0.3710 would be the first sign of strength.
3. Breaking $0.5825 with solid volume would confirm trend reversal and open the path toward $0.82 – $1.35.
📌 Additional Bullish Confirmation:
Bullish divergence on RSI (if present)
Increasing volume during upward moves
---
🔴 Bearish Scenario:
1. A clear breakdown below $0.2613 on the weekly timeframe would signal a loss of major support.
2. This opens downside risk toward:
$0.17
$0.12
Possibly even $0.08 if the market seeks a deeper revaluation.
3. Such a move would likely represent a full structure reset.
📌 Additional Bearish Confirmation:
Strong bearish candles with high volume
Weak or no bullish reaction within the demand zone
---
🔁 Formations in Play:
Accumulation Rectangle: A sideways range often found at market bottoms before new bull cycles.
Multi-year Base Formation: Can serve as a launchpad for major parabolic moves if resistance is broken.
---
📚 Conclusion:
SAND is at a make-or-break zone. The market is coiled like a spring — preparing either for a new bullish expansion or for further downside pain. Smart traders and investors will:
Wait for breakout confirmation
Or exit positions on breakdown signals
This is a golden zone for preparation, not reaction.
---
📌 Suggested Trading Plan:
✅ Bullish Bias: Scale in within support zone; tight stop below $0.26
❌ Bearish Bias: Short only after weekly close below $0.26
🧠 Neutral/Waiting: Let the market prove itself
#SANDUSDT #CryptoBreakout #AltcoinAnalysis #TechnicalAnalysis #MetaverseToken #SupportZone #BullishScenario #BearishOutlook #SmartMoneyAccumulation #CryptoTA #AccumulationPhase
SAND SCALP TRADE IDEA.1. Market Structure:
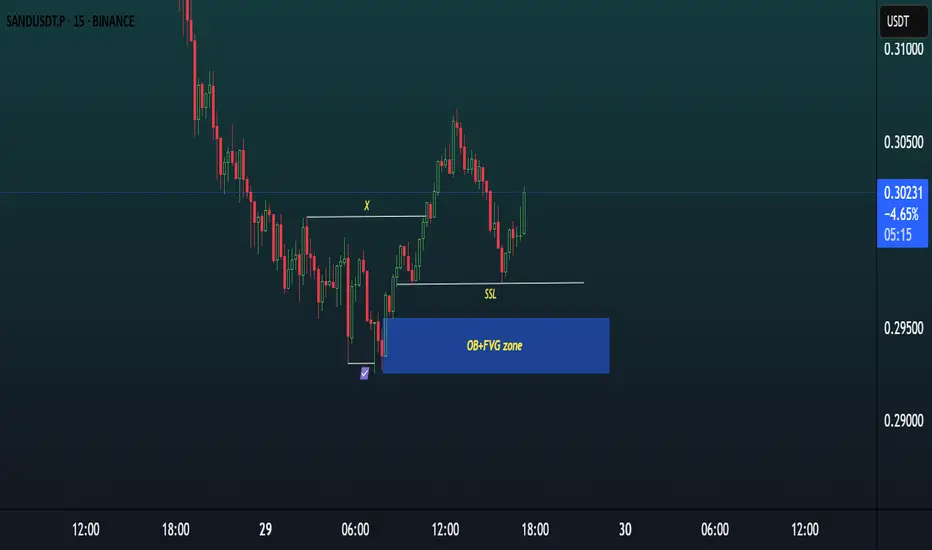
The chart shows a bullish market structure with a clear Break of Structure (BoS) to the upside (marked by “X”).
After this impulsive move, the price has entered a retracement phase, forming lower highs and lower lows within this short-term correction.
2. Liquidity Engineering:
Sell-Side Liquidity (SSL) is visible just below the 0.2980 level, formed by equal lows and previous swing lows.
This liquidity has not yet been swept, meaning the market may still target this area to grab liquidity before any strong bullish move.
3. Key Demand Zone – OB + FVG:
Below the SSL lies a strong demand zone, marked by a Bullish Order Block (OB) overlapping with a Fair Value Gap (FVG) in the 0.2940–0.2960 range.
This confluence increases the probability of a strong bullish reaction when price enters this zone.
4. Current Price Action:
Price is currently reacting around 0.3000, showing a minor bounce, but no key zone has been tapped yet.
As SSL is still intact and unmitigated, there is a high likelihood that price will first move lower to sweep the liquidity and tap into the OB + FVG zone.
5. Trade Expectation:
Ideal setup: Wait for price to sweep SSL, enter the OB + FVG zone, and then look for bullish confirmation (such as a bullish engulfing, change of character, or lower timeframe BOS) to consider a long position.
Stop Loss: Below the OB zone (~0.2930).
Take Profit: 1.5x to 2x RR, or targeting the recent high around 0.3060–0.3080.
6. Summary:
SAND/USDT is showing bullish intent, but is likely to first sweep sell-side liquidity and tap into the OB + FVG demand zone before resuming the uptrend. Patience is key — await a clean reaction and confirmation before entering long.
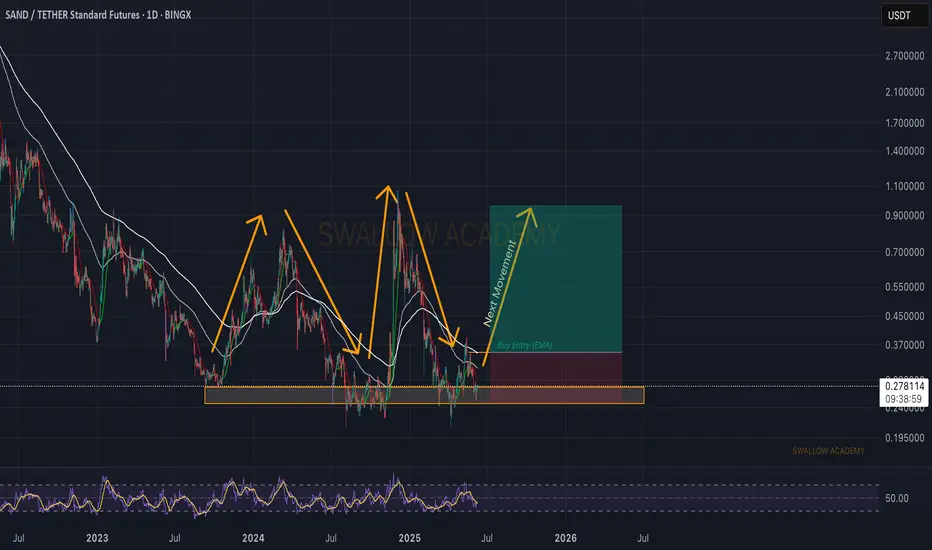
The Sandbox (SAND): Golden Buy Zone | Now or Never...Sand is one of the good long-term coins that caught our attention, where the price is at a local bottom...waiting for a proper breakout from EMAs, which would give us an easy 2.5x on the price.
There is not much to say but rather just wait patiently and enter at the right moment!. Very good R:R trade that we will not miss for sure!
Swallow Academy
SANDUSDT Breaks Major Downtrend – Golden Pocket Retest!
Technical Analysis:
SAND/USDT has successfully broken out of a descending trendline that had been capping the price since late 2024. The breakout occurred with increased volume, signaling strong buyer interest.
Following the breakout, price rallied and is now retesting a key support zone, which includes:
A demand zone (yellow box) between 0.2748 - 0.2885, aligning with the Fibonacci Golden Pocket (0.618 - 0.5)
A solid horizontal support around 0.2913
Fibonacci retracement levels are clearly defined:
0.3126
0.3467
0.4010
0.5417
Up to major resistance near 0.9384
---
Bullish Scenario 🟢:
If the price holds above the Golden Pocket zone and prints bullish confirmation (such as a bullish engulfing or hammer candlestick), then further upside potential is likely:
1. Initial targets: 0.3126 and 0.3467
2. Mid-range targets: 0.4010 and 0.5417
3. Long-term potential: 0.6981 and possibly the major resistance at 0.9384
Stronger confirmation would come from a daily candle closing above 0.3126.
---
Bearish Scenario 🔴:
If price breaks below the 0.2748 zone, it could indicate a failed breakout, potentially leading to:
1. Initial support: 0.2700
2. Deeper pullback zone: 0.2131 (previous low)
3. Potential fakeout of the trendline breakout
A daily close below 0.2748 would strongly validate the bearish setup.
---
Chart Pattern Overview:
Descending Triangle Breakout already confirmed
Price is now in the retest phase of the breakout
The Golden Pocket Fibonacci zone is the crucial point of trend continuation or reversal
---
Conclusion:
The breakout from the long-standing downtrend marks a strong shift in structure. However, a successful retest at the Golden Pocket will be key to confirming further bullish continuation. If buyers defend this zone, SAND is likely to print a higher low and resume its upward move.
#SANDUSDT #CryptoBreakout #AltcoinAnalysis #TechnicalAnalysis #FibonacciLevels #TrendlineBreakout #GoldenPocket #BullishSetup #BearishSetup

SANDUSDTSAND/USDT (The Sandbox):
○ Trend: Strong uptrend.
○ Current Condition: Price is consolidating around $0.32-$0.33, after reaching a high of around $0.34-$0.35, and is below significant resistance at $0.39-$0.40. Volume is decreasing during the consolidation phase.
○ Entry Recommendation: Not optimal for entry at this time. It is better to wait for the price to correct to the nearest support area ($0.29-$0.30) and look for a bullish signal from there, or wait for a clear and confirmed breakout above the resistance at $0.39-$0.40 with supportive volume.

Sandbox (SAND): Really Good Buying OpportunitySAND is at a golden spot for potential good upward movement to happen once we see a proper breakout from that 200 EMA line.
We are seeing a great R:R trading setup here so might as well try it out, but wait for a proper break from that EMA.
Swallow Academy
