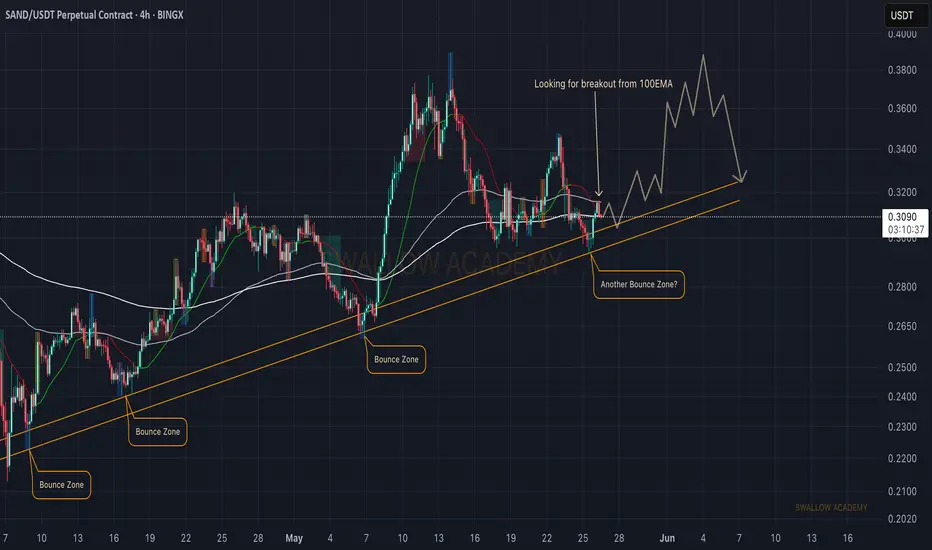
The Sandbox (SAND): Reached Strong Bullish Trend | Bounce AreaSandbox coin has recently touched again the local bullish trend from which we have been seeing some great upward movement (previously). With current bullish sentiment in the markets, we might be seeing a strong upward movement from here, and the 100EMA is our last confirmation for now.
Upon seeing it to be broken, we will be looking for a long position from there.
Swallow Academy
SANDUSDT trade ideas
Sandbox (SAND): Patience Is Key | Waiting For Long EntrySandbox is at its local support area, where we are seeing the pressure from sellers, which might turn into a proper foundation for upcoming buyside movement.
We are looking for the area near the 100EMA to be secured by buyers, after which we will be looking for long!
Swallow Academy

Sandbox (SAND): Seeing Break of Structure Forming | Buy Area?Sandbox is another coin that has formed a break of structure, which can send the price higher. As long as we keep the current momentum of volume from side, we are aiming to see that upper area reached within days!
Swallow Academy

SAND analysis: Price is currently testing the support area; a break below this level would indicate a bearish trend. A candle closing below this point will likely lead to more downward movement. You may consider opening a long position, but with a tight stop-loss.

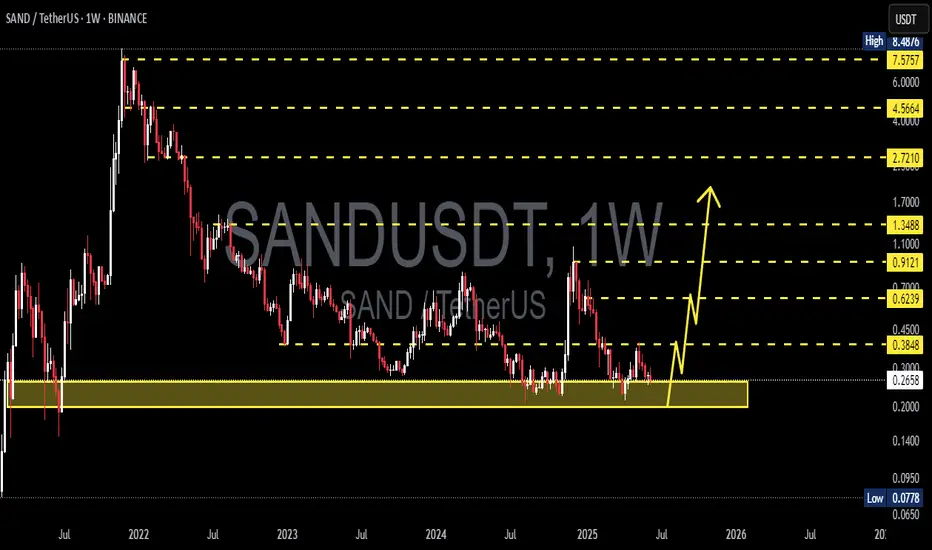
SANDUSDT 1W AnalysisSAND ~ 1W Analysis
#SAND Buy back gradually from here if you still have confidence in this coin with a short term target of at least 20%+ from this support.
sand buy spot "🌟 Welcome to Golden Candle! 🌟
We're a team of 📈 passionate traders 📉 who love sharing our 🔍 technical analysis insights 🔎 with the TradingView community. 🌎
Our goal is to provide 💡 valuable perspectives 💡 on market trends and patterns, but 🚫 please note that our analyses are not intended as buy or sell recommendations. 🚫
Instead, they reflect our own 💭 personal attitudes and thoughts. 💭
Follow along and 📚 learn 📚 from our analyses! 📊💡"

$SAND – Ascending Channel Meets Round Bottom🔥 NYSE:SAND – Structure Building Up
📆 On the daily timeframe, NYSE:SAND is forming a round bottom while also trending inside an ascending channel — signaling strong structural momentum 📈
⚠️ It’s now testing a key trendline resistance around $0.35 — a breakout here could trigger the next move up.
📊 On the weekly timeframe, price is holding above the $0.30 level, keeping the bullish structure intact 🛡️
👀 This is a pivotal zone — if bulls hold strong, the next leg could be big.
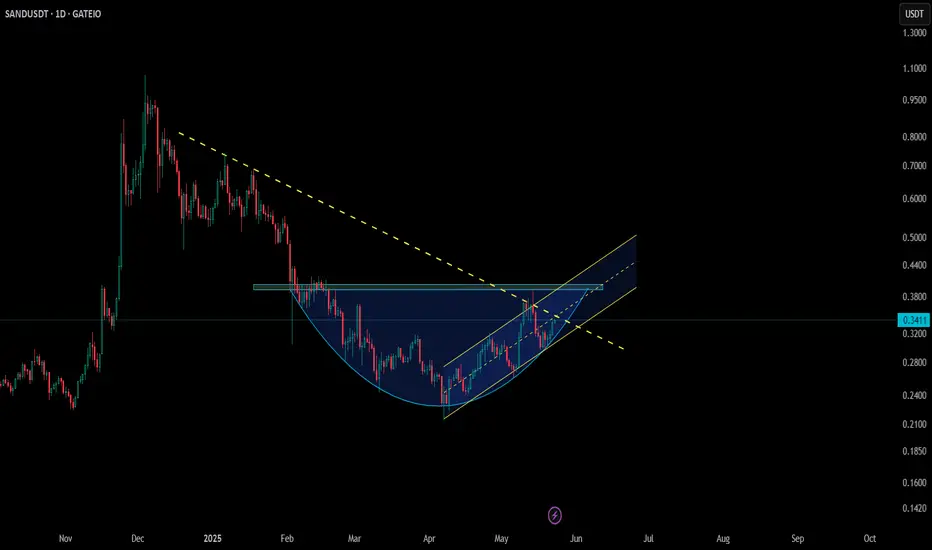
SANDUSDT 1D Analysis SAND ~ 1D Analysis
#SAND Buy gradually from here if you still have confidence in this coin with a short term target of at least 15%+ from here.

SANDUSDT BUY/LONGBy utilizing Fibonacci retracement levels, historical patterns, , we can formulate a hypothesis that the market might follow a similar trajectory if bullish sentiment prevails.

SANDUSDT breaking 3-years descending wedge. 2200% max profitHi!
posting again after a long time. wanted to share this SAND/USD weekly chart, all time.
Big opportunity here:
3 years long descending wedge
breakout with huge volume
retest of the wedge and bounce (current week)
RSI printing a higher low while price printing a double bottom
MACD cross
SAND is currently struggling with main weekly MAs.
At a price of 0.3590$ at the time of writing, we have some outstanding targets:
1.00$ first big resistance (around 200% profit)
2.50$ second main resistance (600%+ profit)
8.00$ crazy target of the multi-year wedge (needs some months, in case we are looking at the previous ATH - 2200% profit).
Seems a solid investment for medium term. Also trading it is great, consider main MAs and listed targets as a reference.
Cheers,
And100

#SAND/USDT#SAND
The price is moving within a descending channel on the 1-hour frame and is expected to break and continue upward.
We have a trend to stabilize above the 100 moving average once again.
We have a downtrend on the RSI indicator that supports the upward move with a breakout.
We have a support area at the lower boundary of the channel at 0.2790, which acts as strong support from which the price can rebound.
Entry price: 0.2828
First target: 0.2890
Second target: 0.2971
Third target: 0.3048

#SANDUSDT Weekly Analysis — Final Base Test Before Potential Rec🏖️ #SANDUSDT Weekly Analysis — Final Base Test Before Potential Recovery?
🗓 Published: May 10, 2025
📊 Timeframe: 1W | Exchange: Binance
Author: @HamadaMark
🔍 Market Structure Overview
SAND has returned to its historical accumulation zone near $0.28–$0.33 after completing multiple falling wedge breakdowns throughout 2023–2025.
Price is now attempting a bounce from a major demand floor, forming what could become a mid-cycle double bottom.
📌 Macro Setup Observations:
✅ Retest of strong horizontal demand zone (2021 launch base)
✅ Clear panic wick below structure, followed by bounce
✅ Similar formation to 2022 → 2023 reversal setup
✅ Weekly candle reclaiming 200MA zone
🟦 Critical Support Zone (Demand Base):
Main Support: $0.28–$0.33
Panic Level / Invalid Zone: Close below $0.27–$0.25 = breakdown risk
🔻 If this zone fails, structure targets as low as $0.10–$0.07 become possible
🎯 Upside Resistance Targets (if Bounce Confirmed):
TP1: $0.4678 – Previous wedge support → now resistance
TP2: $0.8344 – Multi-month range top
TP3: $1.3493 – Mid-cycle top (2022 level reclaim)
⚖️ Risk/reward becomes attractive above $0.35 reclaim with macro upside of 100–300%
🧠 Strategy Insight
• DCA is favorable in the blue box zone with tight SL
• Stronger confirmation = reclaim of red box ($0.47)
• Breakout traders should wait for weekly close above $0.47 + retest
💡 Volume + structure confirm this area remains a “make or break” pivot zone
🗣 What’s Next?
If $0.28–$0.33 holds and we reclaim the $0.47–$0.50 resistance box, SAND could attempt a multi-leg recovery into Q3–Q4.
If we lose $0.27, exit and reassess at deeper levels.
📢 SAND is at its most critical level in years — this isn’t the time to fade structure. If it holds, the upside opens fast.
we ask Allah reconcile and repay

TradeCityPro | SAND: Critical Support Test After Pullback👋 Welcome to TradeCity Pro!
In this analysis, I want to review the SAND coin for you. It’s one of the most popular Metaverse projects, widely recognized and among the top in its category.
✔️ This project’s coin currently holds a market cap of $693 million and ranks 91st on CoinMarketCap.
⏳ 4-Hour Timeframe
As you can see on the 4H chart, after a bullish leg that pushed the price up to 0.3140, a correction phase began. Following the break of 0.2903, the price has now corrected down to 0.2714.
🔍 If this 0.2714 level breaks, the price could continue down to the support at 0.2437 — so a break below 0.2714 would be a valid short entry.
👀 Personally, I prefer waiting for the price to first bounce off 0.2714, move upward, and print a lower high relative to 0.2903, then break 0.2714 on a second attempt. In that case, the short setup becomes much more reliable.
🔽 That said, even if the level breaks now without a bounce — since RSI is already near the oversold zone — I’ll still open a short. If RSI enters oversold, it could lead to a sharp drop.
⚡️ One negative factor for short positions is that volume has been decreasing since the price started correcting from 0.3140, which isn't a good signal for further downside — there’s a divergence between price and volume.
📈 However, that’s a positive signal for potential long positions. When volume drops during a correction in an uptrend, it shows buyers still have control. As long as this divergence persists, the uptrend is more likely to continue than to reverse.
📊 For long positions, if buying volume enters the market and the price holds above 0.2714, you can enter based on lower-timeframe structure breaks. The main long entry will be confirmed once the price breaks above the 0.3140 high.
📝 Final Thoughts
This analysis reflects our opinions and is not financial advice.
Share your thoughts in the comments, and don’t forget to share this analysis with your friends! ❤️

SANDUSDT 1D AnalysisSAND ~ 1D Analysis
#SAND Buy gradually after successfully penetrating this resistant line with a short -term target of at least 15%+.

sand long longterm spot "🌟 Welcome to Golden Candle! 🌟
We're a team of 📈 passionate traders 📉 who love sharing our 🔍 technical analysis insights 🔎 with the TradingView community. 🌎
Our goal is to provide 💡 valuable perspectives 💡 on market trends and patterns, but 🚫 please note that our analyses are not intended as buy or sell recommendations. 🚫
Instead, they reflect our own 💭 personal attitudes and thoughts. 💭
Follow along and 📚 learn 📚 from our analyses! 📊💡"

SANDUSDTshort selling set up 📉
DISCLAIMER:
what I share here is just personal research, all based on my hobby and love of speculation intelligence.
The data I share does not come from financial advice.
Use controlled risk, not an invitation to buy and sell certain assets, because it all comes back to each individual.

The Sandbox: Your Altcoin ChoiceLet's continue with Your Altcoin Choice. Some analysis can take a while, but all will be done.
The Sandbox is in a very good situation as shown on the chart. The price range marked with light blue is a long-term support and also a confirmed buy zone. The last wave, amounting to more than 375%, came out of this zone. After a correction and long-term higher low, SANDUSDT is ready to go at it again.
This chart shows potential for a "small wave" relatively speaking. Small in relation to the potential The Sandbox has for the full bull market. See this chart below:
Notice the big difference. This one has a total potential of more than 5,000%. This would include the bull market bull run phase which is not included in the first chart.
The previous bullish cycle, from November 2020 through November 2021 produced total growth of 29,371%. There was a stop, a correction between March and June 2021 lasting 87 days. After this the last bullish jump.
This is what needs to be kept in mind for this cycle. 87 days but much more growth happened afterward. With all the sideways action in these transition years, we get used to seeing a stop after just one wave. When the market is full blown bullish, this stop is only temporary and after it ends we get the resumption of the bullish wave.
We have been seeing sideways, the bull market is an uptrend. This is a big difference and something to keep in mind. Crypto will grow.
Bitcoin, The Sandbox, Gala Games, Cardano and much more.
Thanks a lot for your continued support.
Namaste.

SAND at a Key Turning Point – Breakout or Breakdown?🔥 SAND Daily & Weekly Update!
📉 Daily TF: Price remains inside a falling wedge—this pattern often signals a reversal. Keep an eye on breakout signals!
⏳ Weekly TF: After breaking out of a descending triangle, price is now retesting trendline support—this is a critical level for confirmation.
⚡ Retest Watch: If support holds, a strong move could follow. Bulls need to step in!
👀 Will buyers defend this zone, or is a deeper retracement coming? Stay ready! 🚀

SAND - Nice Snipinig levels played out. i wrote : "Currently this green move through small blue box is like a Short Squeeze."
Boom ! it was a short squeeze 🧐 👌 🎯
Look how impulsive those red ad green candles pierced the blue box.
Look how that hVn level was accurate. To the point !
I was expecting less profit but numbers like 5 % and almost 10 % are really good. 💰💵💲
Original TA/Signal:https://www.tradingview.com/chart/SANDUSDT.P/XZIoklWZ-SAND-new-Levels/
Follow for more ideas/Signals. 💲
Look at my other ideas 😉
Just donate some of your profit to Animal rights and rescue or other charity :)✌️

SANDUSDT 1WSAND ~ 1W Analysis
#SAND Buy from here if you still have a Conviction on this coin with a short -term target of at least 20%+.

#SAND #SANDUSDT #SANDBOX #LONG #SWING #AMD #Eddy#SAND #SANDUSDT #SANDBOX #LONG #SWING #AMD #Eddy
SANDUSDT.P SWING Long AMD Setup
Important areas of the upper time frame for scalping are identified and named.
This setup is based on a combination of different styles, including the volume style with the ict style. (( AMD SETUP ))
Based on your strategy and style, get the necessary confirmations for this Swing Setup to enter the trade.
Don't forget risk and capital management.
The entry point, take profit point, and stop loss point are indicated on the chart along with their amounts.
The responsibility for the transaction is yours and I have no responsibility for not observing your risk and capital management.
By scratching the price and time bar, you can see the big picture and targets.
Note: The price can go much higher than the second target, and there is a possibility of a 50%-100% pump on this currency. By observing risk and capital management, obtaining the necessary approvals, and saving profits in the targets, you can keep it for the pump.
Be successful and profitable.

SAND - new LevelsCurrently this green move through small blue box is like a Short Squeeze.
For me that upper bigger blue box is more interesting for a Short.
A short right now would be 60/40 chance for a win.
I wait, but the POC could be nice 2% Short possibility too :)
Follow for more ideas/Signals. 💲
Look at my other ideas 😉
Just donate some of your profit to Animal rights and rescue or other charity :)✌️

SAND/USDT 1W🩸 NYSE:SAND ⁀➷
#TheSandbox. Macro chart Another
💯 Intermediate Target - $1.36
🚩 Macro Target 1 - $2.03
🚩 Macro Target 2 - $3.44
🚩 Macro Target 3 - $5.50
- Not financial advice, trade with caution.
#Crypto #TheSandbox #SAND #Investment
✅ Stay updated on market news and developments that may influence the price of The Sandbox. Positive or negative news can significantly impact the cryptocurrency's value.
✅ Exercise patience and discipline when executing your trading plan. Avoid making impulsive decisions driven by emotions, and adhere to your strategy even during periods of market volatility.
✅ Remember that trading always involves risk, and there are no guarantees of profit. Conduct thorough research, analyze market conditions, and be prepared for various scenarios. Trade only with funds you can afford to lose and avoid excessive risk-taking.
