SCR/USDTAfter spending over 150 days in consolidation, price has finally broken out of its downtrend and completed a clean retest of the breakout level. Momentum now favors the bulls, with the next target set at the previous major resistance, which also acts as a key flip zone. A sustained move above this l
Scroll Volume Breakout But... 280% Profits Potential (Easy)"Volume breakout but..." When there is a but, there is always a problem.
Scroll (SCRUSDT) is full green today with rising volume but, resistance is being faced in the form of MA200—not all is lost.
While resistance is being faced the bullish bias is already confirmed. The main low happened in Apri
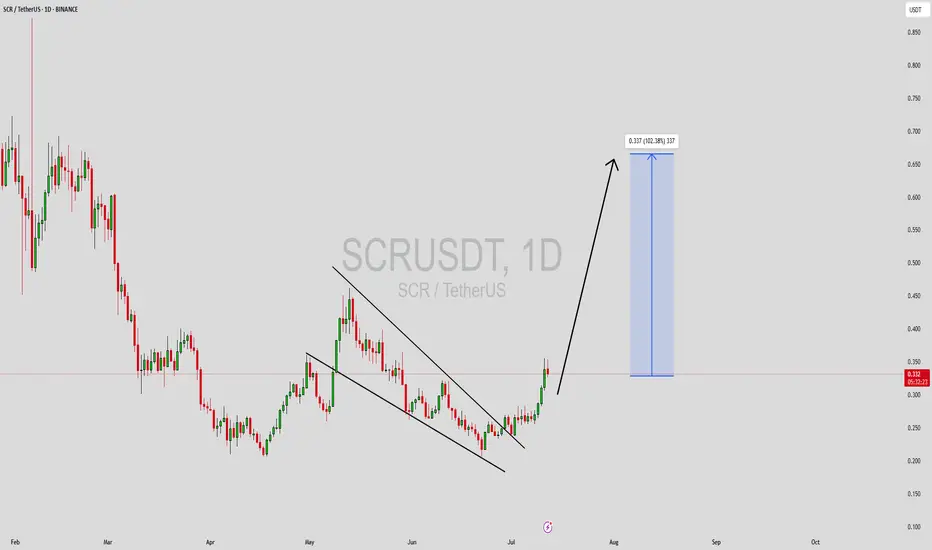
SCRUSDT Forming Descending TriangleSCRUSDT is catching the attention of smart traders as it shows signs of a strong bullish setup supported by increasing trading volume. This pair has recently seen consistent accumulation phases, which often precede significant price moves. With expectations for a potential 90% to 100%+ gain, SCRUSDT
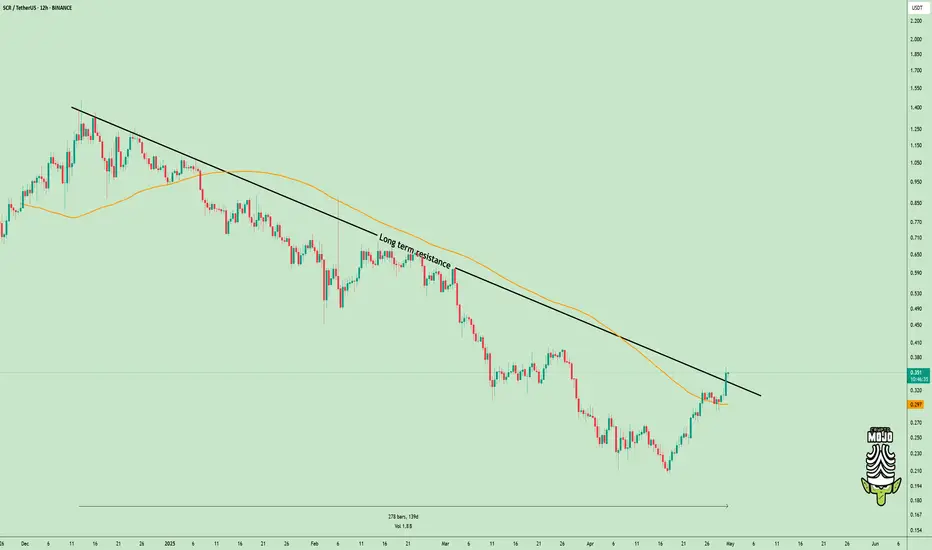
SCRUSDT UPDATE
Pattern: Falling Wedge Breakout
Current Price: \$0.268
Target Price: \$0.398
Target % Gain: 50.1%
Technical Analysis: SCR has broken out of a falling wedge pattern on the 12H chart with a clean close above resistance. The breakout is backed by bullish candles and increasing volume, suggesting a po

Downtrend Over? $SCR Just Flipped the Script!TSX:SCR just broke out after moving down for 139 days.
This isn’t just another pump, it’s a change in direction.
- Price broke the long-term downtrend
- Jumped above the 200 EMA
- Now testing the breakout zone again
If this area holds, bulls could take control and push higher.
It’s a clean setup
SCRUSDT 1D AnalysisSCR ~ 1D Analysis
#SCR Buy after successfully penetrating this resistant line with a short -term target of at least 10%++ from here.

scr looking good for midterm Formed Classical Descending Broadening Wedge, And Currently Approaching Towards Descending Trendline, Trendline Is Weak Now Because It's Already Been Tested Many Times I'm Expecting Breakout This Time, After Breakout Expecting 2x From Scr

SCRUSDT BullishSCRUSDT buy signal on daily Timeframe. 0.3 is the lowest price on this crypto, now bulls are ready to move higher. Potential TP is 28%

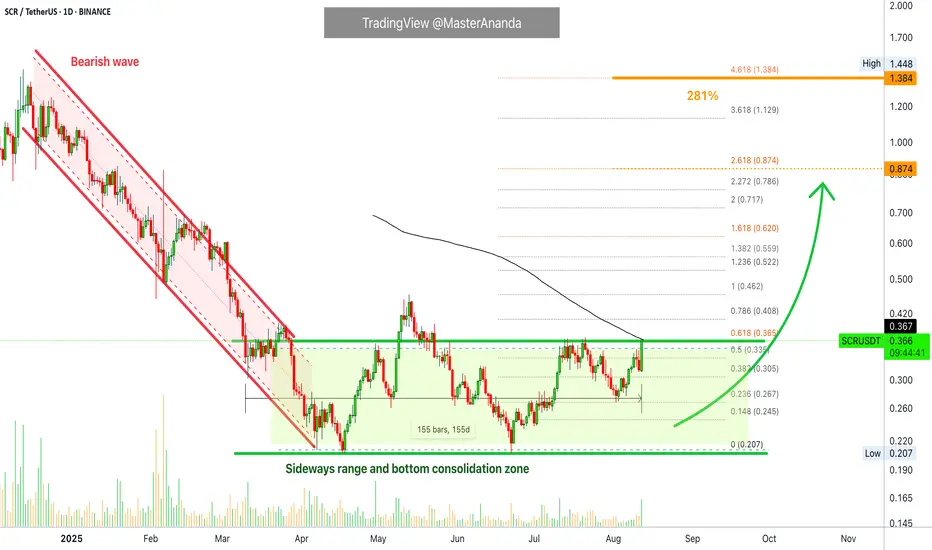
SCR/USDT Analysis – Weekly Chart at March 10, 2025.SCR has completed a significant correction, reaching a key Fibonacci support zone around 0.342. The chart shows a deep retracement, hinting at a potential reversal from this level.
🔹 Fibonacci Levels – The current support aligns closely with the 0.618 Fibonacci retracement level at 0.927, which is

SCR ANALYSIS (4H)From the point where we marked "START" on the chart, it seems that SCR's correction has begun.
This correction appears to be either a diametric or a symmetrical pattern. Currently, the price seems to be completing wave F of this diametric structure.
It may get rejected downward again from the red

See all ideas
Summarizing what the indicators are suggesting.
Oscillators
Neutral
SellBuy
Strong sellStrong buy
Strong sellSellNeutralBuyStrong buy
Oscillators
Neutral
SellBuy
Strong sellStrong buy
Strong sellSellNeutralBuyStrong buy
Summary
Neutral
SellBuy
Strong sellStrong buy
Strong sellSellNeutralBuyStrong buy
Summary
Neutral
SellBuy
Strong sellStrong buy
Strong sellSellNeutralBuyStrong buy
Summary
Neutral
SellBuy
Strong sellStrong buy
Strong sellSellNeutralBuyStrong buy
Moving Averages
Neutral
SellBuy
Strong sellStrong buy
Strong sellSellNeutralBuyStrong buy
Moving Averages
Neutral
SellBuy
Strong sellStrong buy
Strong sellSellNeutralBuyStrong buy
Displays a symbol's price movements over previous years to identify recurring trends.