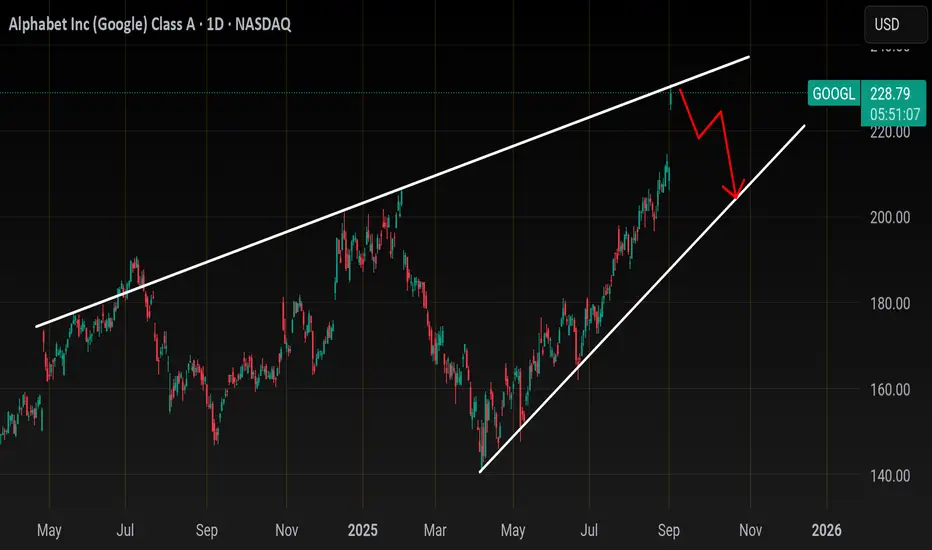
Google Likely On SupportGOOGL is likely finding support on $174. It's following the panic trend right now as almost everything Computer/Tech has been sold deep into support bids. GOOGL finding support here along with AMZN at $214 leads to my theory IXIC is ready to break resistance.
If it fails to hold $174, then the major support at $148 should lift it back up towards it's final target (or next major support) of $252.
Good luck!
Trade ideas

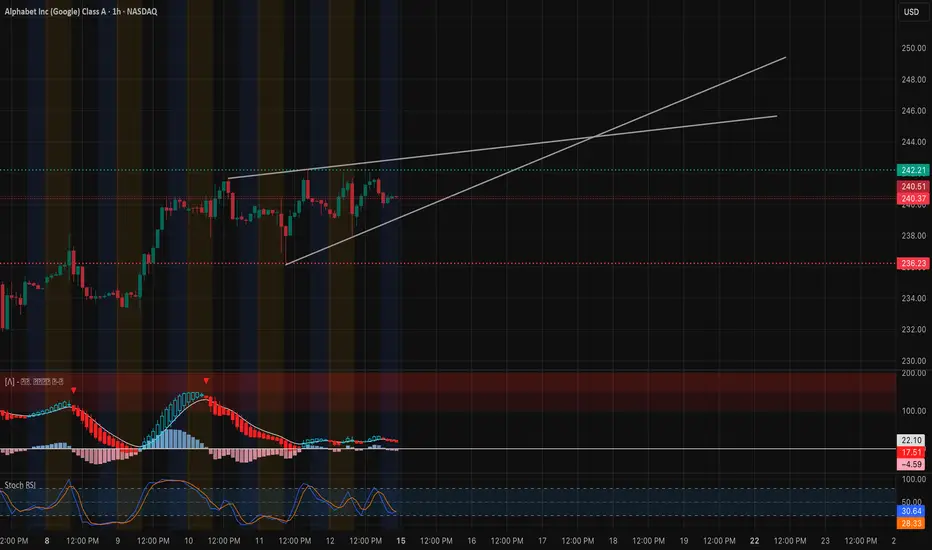
GOOGL Near Key Wedge Break — Levels to Watch for September 15
* Macro backdrop: U.S. futures are flat after a strong tech week. Traders are waiting on mid-week economic data, keeping intraday moves contained early Monday.
* Sector tone: Mega-cap tech remains resilient; Alphabet continues to draw steady option interest.
Technical Analysis – GOOGL
Trend & Structure (1-Hour Chart)
* Price is consolidating in a rising wedge between $236 and $242.
* Price action shows higher lows but frequent upper-wick rejections, hinting at indecision.
Key Levels
* Resistance: $242.2 (highest positive NETGEX / Gamma Wall), $245–247.5 (next Call/GEX zones).
* Support: $236.2 (trendline + strong put support), $233.5, $227.5 (2nd Put Wall).
Momentum & Indicators
* MACD is neutral, flattening after a brief bullish push.
* Stoch RSI is low, suggesting room to rebound if buyers return.
* Volume remains moderate, confirming a coil.
Options/GEX Insight
* Options market shows Call walls around $242–245, matching chart resistance.
* IVR 16.8 and IVx avg 30.8 indicate stable volatility and potential for a sharp move if wedge breaks.
Trade Scenarios for Sept 15
* Bullish Plan:
* Entry: Break and hold above $242.2.
* Targets: $245 → $247.5.
* Stop: Below $236.2.
* Bearish/defensive (if wedge breaks down):
* Entry: Break below $236.2.
* Targets: $233.5 → $227.5.
* Stop: Above $242.2.
Summary
Alphabet starts Monday inside a rising wedge. A decisive move above $242.2 can invite a quick run to $245–247.5, while a loss of $236.2 opens a slide toward the low $230s.
Disclaimer: This analysis is for educational purposes only and does not constitute financial advice. Always do your own research and manage risk before trading.
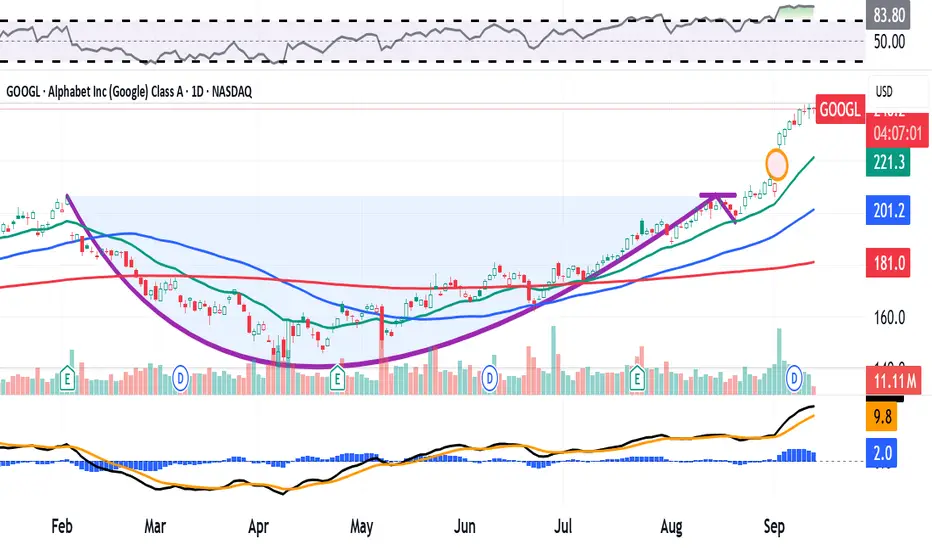
Alphabet Is Up Some 15% This Month. What Does Its Chart Show?Readers have likely noticed the early September breakout clocked by Google parent Alphabet NASDAQ:GOOGL , which hit an all-time intraday high this week. Can the stock's nearly 15% run so far this month continue? Let's see what technical and fundamental analysis says.
Alphabet's Fundamental Analysis
GOOGL has risen 13.9% over September's first eight sessions to hit a $242.25 intraday record high on Thursday.
Most of Alphabet's September gains came on Sept. 3, when the stock popped 9.1% after a federal judge overseeing the U.S. government's antitrust case against Alphabet NASDAQ:GOOG ruled that the firm doesn't have to sell off the Google search engine.
The court also said Google and Apple can retain a contract under which AAPL pre-loads Google's search engine onto iPhones in exchange for big payments from Alphabet.
GOOGL has risen another roughly 5% since then even though the company is still some six weeks out from its next earnings release.
Of the 45 sell-side analysts that I know of that cover the stock, 36 have revised their earnings estimates higher since the quarter began, while three have lowered their numbers. (The other six have so far left their earnings estimates unchanged.)
Alphabet's Technical Analysis
Now let's get down to business and take a look at GOOGL's technical breakout, as shown here in the stock's year-to-date chart through midday Tuesday:
Readers will see that from late January into August, GOOGL developed a bullish "cup-with-handle" pattern that looks like it came out of a textbook.
Marked with a purple curving line in the chart above, this pattern has a $206 pivot.
For those new to technical analysis, a cup pattern's pivot is the apex of the cup's left side. Once a handle is added, that pivot moves across to the right-side peak.
While I think that GOOGL could in theory move higher from here, I do have some concerns that are starting to nag at me.
For starters, the stock created a still-unfilled gap on the morning of Sept. 3, as denoted by the orange circle at the chart's right above. Such unfilled gaps don't have to be filled, but they often are.
That said, Alphabet's bullish technical set-up remains in place in the chart above. However, it does look like the stock's recent price surge was starting to top off in the high $230s and low $240s as I wrote this Thursday afternoon.
Meanwhile, GOOGL's Relative Strength Index (the gray line at the chart's top) is beyond merely extended. While that's a good problem for Alphabet bulls to have, it's the result of the stock's recent parabolic move and reflects a technically overbought condition.
Similarly, readers will see that Alphabet's daily Moving Average Convergence Divergence indicator (or "MACD," marked with black and gold lines and blue bars at the chart's bottom) is postured in a seemingly bullish way.
The histogram of the stock's 9-day EMA (the blue bars) is now significantly positive and has been for a number of days.
Alphabet's 12-day EMA (black line) is also well into positive territory and has crossed well above the 26-day EMA (gold line). That's also typically a bullish technical signal.
All in, GOOGL was trading at a roughly 20% premium to its 50-day Simple Moving Average (or "SMA," marked with a blue line above) and a whopping 31% premium to its 200-day SMA (the red line) as of Thursday afternoon. That's all somewhat concerning technically.
An Options Option
How might someone try to protect themselves if they're long the stock?
Consider purchasing a "protected collar."
First, buy puts that expire later than Alphabet's next expected earnings date -- say, a contract with an Oct. 24 expiration date.
The person would pay for those puts (or at least subsidize their purchase) by selling an equal-sized covered call against their long position.
Such a set-up would create a possible escape for an investor for a reduced cost through the sale of some potential excess gains.
(Moomoo Technologies Inc. Markets Commentator Stephen “Sarge” Guilfoyle was long GOOGL at the time of writing this column.)
This article discusses technical analysis, other approaches, including fundamental analysis, may offer very different views. The examples provided are for illustrative purposes only and are not intended to be reflective of the results you can expect to achieve. Specific security charts used are for illustrative purposes only and are not a recommendation, offer to sell, or a solicitation of an offer to buy any security. Past investment performance does not indicate or guarantee future success. Returns will vary, and all investments carry risks, including loss of principal. This content is also not a research report and is not intended to serve as the basis for any investment decision. The information contained in this article does not purport to be a complete description of the securities, markets, or developments referred to in this material. Moomoo and its affiliates make no representation or warranty as to the article's adequacy, completeness, accuracy or timeliness for any particular purpose of the above content. Furthermore, there is no guarantee that any statements, estimates, price targets, opinions or forecasts provided herein will prove to be correct.
Options trading is risky and not appropriate for everyone. Read the Options Disclosure Document ( j.moomoo.com ) before trading. Options are complex and you may quickly lose the entire investment. Supporting docs for any claims will be furnished upon request.
Moomoo is a financial information and trading app offered by Moomoo Technologies Inc. In the U.S., investment products and services on Moomoo are offered by Moomoo Financial Inc., Member FINRA/SIPC.
TradingView is an independent third party not affiliated with Moomoo Financial Inc., Moomoo Technologies Inc., or its affiliates. Moomoo Financial Inc. and its affiliates do not endorse, represent or warrant the completeness and accuracy of the data and information available on the TradingView platform and are not responsible for any services provided by the third-party platform.
I am bullish on GOOGLE stockI am bullish on GOOGLE stock
Following last week's pullback, I see a positive ride back to the all-time high (ATH) around $209 or beyond.
Trade with care.
I look forward to connecting with you.
Please share your thoughts in the comment section, share, like and follow


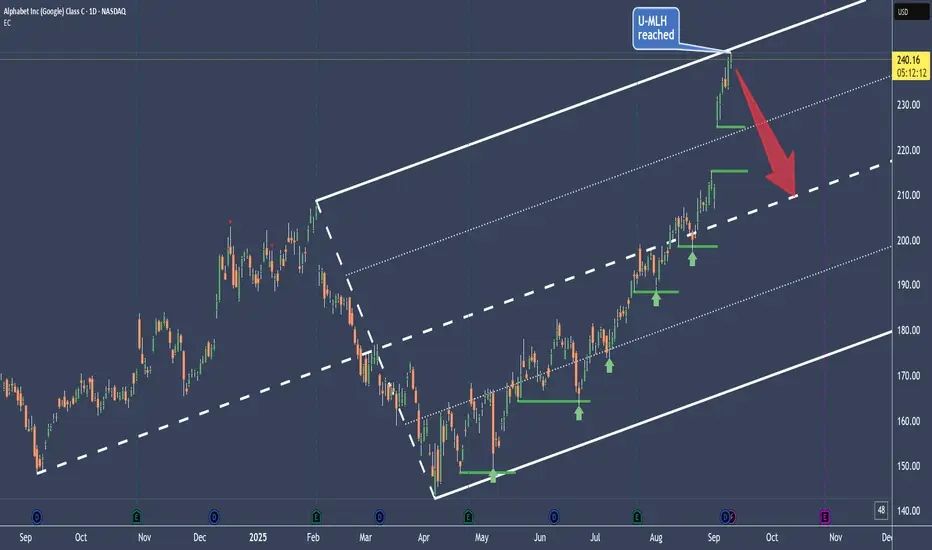
Google has reached it's stretch level👉 The rubber band is stretched 📉💥🐍
👉 Euphoria is at it's top 🚀💸🌕
👉 Greed eats brain 💰🤑👐
So, why not taking a casual short?
Let's say, with some ITM Put Options, just to define the risk?
Because if I short the UL, there's still a chance that greed and euphoria goes nuts and gaps way above the U-MLH.
So, let's give it time to mature, like a good old Whiskey §8-)
Cheers 🥃
GOOGL 3Hour Time frameGOOGL 3-Hour Snapshot
Current Price: $239.63
Change: +2.38% from the previous close
Market Cap: $2.13 trillion
P/E Ratio: 18.44
EPS (TTM): $9.56
Beta: 0.96
🔎 Key Levels
Resistance:
R1: $240.26 (recent high)
R2: $242.00 (next resistance zone)
Support:
S1: $236.40 (immediate support)
S2: $234.15 (next support level)
📈 Technical Indicators
RSI (14): 82.95 — Overbought, potential pullback
MACD: 9.99 — Positive momentum, but watch for divergence
Moving Averages:
5-period SMA: $228.51 — Buy signal
10-period SMA: $218.92 — Buy signal
20-period SMA: $210.54 — Buy signal
50-period SMA: $196.04 — Buy signal
📌 Market Sentiment
Recent Catalyst: U.S. judge's decision not to break up Alphabet, leading to a surge of over 6% in its shares, potentially adding more than $160 billion to its market value.
Reuters
Sector Performance: Positive momentum following recent gains and analyst upgrades.
Options Activity: Significant trading in call options at $240 strike price, indicating bullish sentiment.
📅 Outlook
Bullish Scenario: A breakout above $240.26 could lead to a push toward $242.00 and higher.
Bearish Scenario: A drop below $236.40 may test support around $234.15.
Overall Bias: Moderately bullish, with positive momentum but facing near-term resistance.

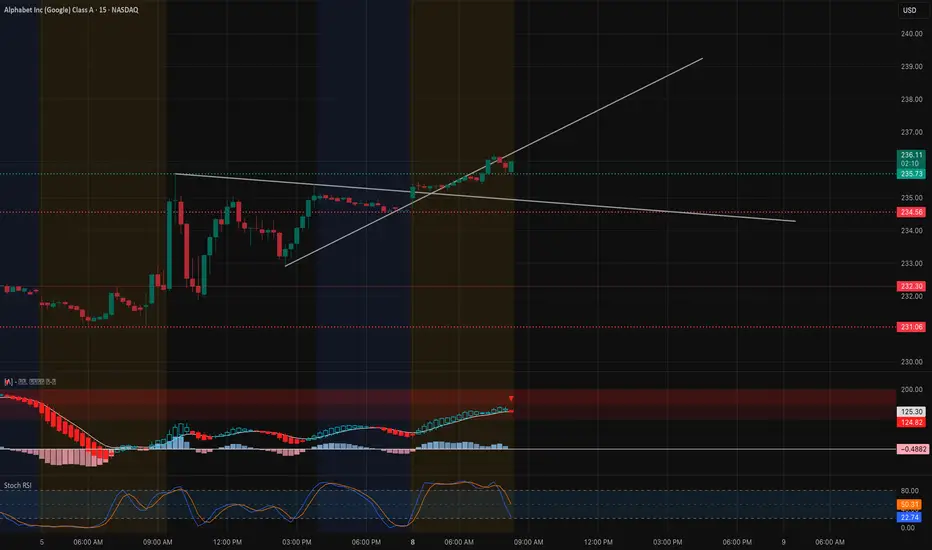
GOOGL Market Preview for Monday, September 8
Price Action & Market Structure
* GOOGL is trading around 235–236, up +1.1% overnight, holding strength despite some broader market weakness.
* Price is following an ascending trendline from last week’s lows, with a clean breakout above 234.5 resistance.
* Current price action is consolidating just above the breakout, signaling potential continuation if bulls hold control.
Key Levels
* Resistance Zones (Upside):
* 237.5–238.5 → Immediate test zone, near Friday’s rejection.
* 242.5 → Strong Call Wall + Gamma resistance.
* 247–250 → Higher GEX clusters, potential squeeze zone.
* Support Zones (Downside):
* 234.5 → Breakout retest level.
* 232.5–233.0 → Minor support zone.
* 227.5 → HVL anchor, strong downside support.
* 222.5 → Deeper Put Wall support.
Options Sentiment (GEX & IV)
* GEX: Mixed bias but heavier Call concentration, showing bullish sentiment above 237.5.
* IVR: 14.1, slightly elevated vs recent average → options market pricing in moderate move potential.
* Gamma Walls:
* 242.5 = Major resistance.
* 227.5 = Strong support.
Indicators
* MACD (15m): Still bullish, histogram fading but momentum not fully broken.
* Stoch RSI: Cooling from overbought, suggesting possible pullback before continuation.
Scenarios for Today
Bullish Case (favored if 234.5 holds):
* Hold above 234.5 breakout support, push through 237.5–238.5.
* Targets: 242.5 Gamma Wall → if strong momentum, extension toward 247–250.
Bearish Case (if 234.5 fails):
* Breakdown below 234.5 could bring a flush to 232.5 → 227.5 HVL.
* Weakness under 227.5 opens deeper pullback toward 222.5 Put Wall.
Trading Thoughts
* Scalp Longs: Favor entries above 234.5, targeting 238.5 → 242.5.
* Shorts: Fade rejections at 238.5 or 242.5 with stops just above.
* Stops:
* Longs → below 234.0.
* Shorts → above 243.0.
Summary
GOOGL is in a bullish continuation setup as long as 234.5 holds. A breakout through 237.5–238.5 could ignite momentum toward 242.5–250 Gamma resistance. Failure to hold 234.5 flips bias to bearish with risk toward 232.5–227.5. Options sentiment leans bullish but watch for rejection at Gamma walls.
⚠️ This analysis is for educational purposes only, not financial advice. Always manage risk.
300 next year?The Google stock had a nice ride! is now very close to the golden fib level from last dip, I spect some correction and continuation to close to 300$, I'm very bullishing long term: AI, quantum computing, cloud.

GOOGL Breaks Out to ATH on Chrome Win — $250 Target in SightAlphabet Inc. NASDAQ:GOOGL has broken into new all-time highs after bullish news that it won’t be forced to sell Chrome. This development removes regulatory overhang and boosts investor confidence.
The stock has surged 55% since our previous analysis. With strong fundamentals, ongoing AI integration, and now a clean regulatory slate, GOOGL shows continued strength.
📊 Technical Setup:
Price has reclaimed the previous ATH and turned it into support. This creates a strong base for a continuation move higher.
💼 Macro & Fundamental Tailwinds:
AI expansion, strong cloud performance, and consistent ad revenue growth make Alphabet a long-term leader in the tech space.
🔹 Bullish Above: $196.00–$211.00
🔹 Upside Target: $240.00–$250.00
⏳ Invalid Below: $196 breakdown with volume
#GOOGL #Alphabet #TechStocks #StockMarket #NASDAQ #Equities #AIGrowth #ChromeNews #EarningsGrowth #BigTech #MarketNews #Investing #Finance #Bullish #StockWatch #TradeSetup #FAANG #TradingIdeas
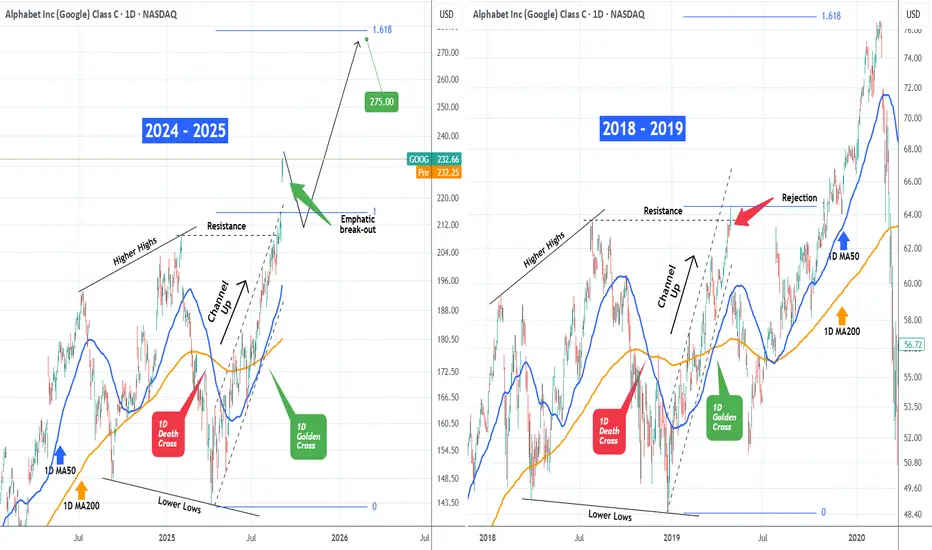
GOOGLE Massive weekly break-out! Is $275 next?Last time we took a look at Google (GOOG) was 3 months ago (May 29, see chart below), giving a strong buy signal within its then Channel Up, that hit our $197.00 Target in less than 2 months:
This week the stock has broken above its April - August 2025 Channel Up, soaring on the very positive news, breaching the $230.00 barrier. In fact, the whole 2024 - 2025 price action resembles the pattern of 2018 - 2019 up until the current break-out.
In April 29 2019 the price opened downwards massively, the opposite of what occurred now. After it found Support and rebounded a month later, Google eventually started a new long-term rally that almost reached the 1.618 Fibonacci extension.
We will apply a similar structure as we move forward, expecting the current fundamental euphoria to recede on the short-term, with our optimal technical buy being near the 1D MA50 (blue trend-line). After that, our long-term Target will be $275.00 (just below the 1.618 Fibonacci extension).
-------------------------------------------------------------------------------
** Please LIKE 👍, FOLLOW ✅, SHARE 🙌 and COMMENT ✍ if you enjoy this idea! Also share your ideas and charts in the comments section below! This is best way to keep it relevant, support us, keep the content here free and allow the idea to reach as many people as possible. **
-------------------------------------------------------------------------------
💸💸💸💸💸💸
👇 👇 👇 👇 👇 👇
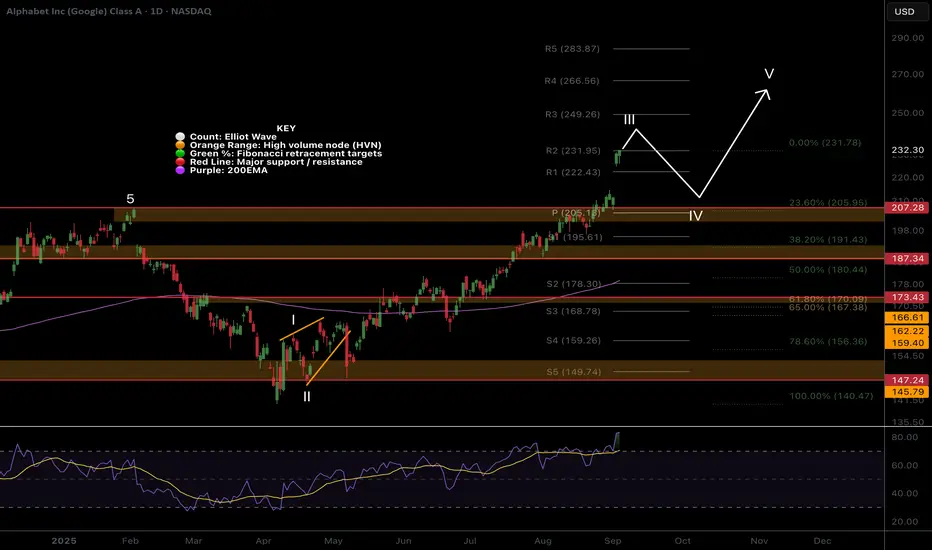
Google clear for take off? Elliot Wave adjusted!NASDAQ:GOOG Google shot up on the open into price discovery invalidating the pullback scenario and suggesting we are in a strong wave 3. Don't step in front of this moving train! gaps don't have to be filled if they are runaway gaps!
Daily RSI is significantly overbought and price is far above the mean so a short term reversal is still expected though not guaranteed! We expect a test of the all time High Volume Node as support at least, $207
Safe trading
“$GOOG at the Mountain Peak: Pullback or Breakthrough?”1️⃣ Date & Time
Date: 3rd September 2025
Time: 12:00 AM IST
2️⃣ Fundamental News
The U.S. antitrust ruling spared Google from a Chrome/Android breakup but required it to share search data with rivals.
Markets read this as a relief → Alphabet stock surged.
AI competition (OpenAI, Microsoft) is being framed as a natural counterweight to Google’s dominance.
👉 Movement = both news-driven and technically aligned with macro expansion.
3️⃣ Public Sentiment & Human Behaviour
Retail Psychology: Retail chased aggressively after the court ruling, treating GOOG as a “must-own AI stock.”
Institutional Behaviour: Smart money distributed near $230+, trimming into euphoric buying.
Social Signal: Headlines frame “Big Win for Google,” but structure shows macro strength with micro exhaustion.
4️⃣ Current Structure
Macro :
Resistance: $232–240 zone.
Support: $225–218.
Stage: Macro candles in Maturity → Mountain expansion.
Micro :
Resistance: $231–232.
Support: $225, deeper $222.
Behaviour: Controlled pullbacks after thrust, candles stalling → failed rescues likely near resistance.
5️⃣ Projection
Primary Path (65%): Pullback to $225–222, then continuation higher.
Alternate Path (25%): Consolidates between $228–232 before pushing again.
Low Path (10%): Breakdown below $218 → would signal deeper correction.
6️⃣ Pullback Levels
Shallow: $228.
Medium: $225–222.
Deep: $218 (critical Titan Wall).
7️⃣ Final View
Bias: Bullish continuation after controlled pullback.
Near-term → cooling likely to $225, but path remains open toward $235–240 once rebalanced.
8️⃣ Essence (Philosophy Line)
“Macro is in Mountain Expansion, but Micro is in Exhaustion. Pullbacks are rebalances, not reversals.”
9️⃣ Disclaimer
⚠️ This analysis is shared for educational and research purposes only. It is not financial advice, trading advice, or investment recommendation. Market decisions are entirely your own responsibility.

GOOG Bulls Loading Calls ($243.5) – Ride or Fade?
## 🔥🚀 GOOG Weekly Options Alert 🚀🔥
📊 **Cheap Weekly Call Setup – Big Risk / Big Reward!** 💎💰
### ✅ Key Takeaways
* 📈 **Flow & Volume:** Institutional call flow 🔥 (C/P ratio **295:1**) with 1.3x volume → Bullish bias.
* ⚡ **Volatility:** VIX \~17 → Favorable for short-term calls.
* 🛑 **Caution:** Daily RSI 70.6, Weekly RSI 77 → Momentum divergence 📉.
* ⏰ **Risk:** Only 2 days to expiry → Theta & Gamma risk sky high ⚡.
### 🎯 Trade Setup (High-Risk, Small Size)
* 🏦 **Instrument:** GOOG
* 🚀 **Strike:** \$243.00
* 💵 **Entry Price:** \$0.11
* 🛑 **Stop Loss:** \$0.06 (50%)
* 🎯 **Target:** \$0.22 (100% gain)
* 📅 **Exit Plan:** By **Thursday EOD** (don’t hold into Friday gamma risk)
* 📊 **Confidence:** 65%
### ⚠️ Key Risks
* 🕒 Time decay (theta) → Premium melts fast.
* 📉 Momentum exhaustion → RSI overbought, possible pullback.
* 📊 Liquidity → Tight spreads, use limit orders.
---
## 📌 Viral Tags (TradingView + SEO)
\#GOOG #OptionsTrading #WeeklyOptions #CallOptions #SwingTrade #Breakout #StockMarket #GOOGAnalysis #TechStocks #RiskReward #TradingSetup #GammaRisk #ThetaDecay #MomentumTrading

SUPER CRAZY GOOGLE CALL/PUT OPTIONGoogle showed a big move today. I bout a call option around $3.50 and sell it of @ around $4.50. I took another trade Put option around $1.50 and looking to sell it @$2.50

GooglJust an adjustment and repost of my last googl idea... the short is here near 230..
Target price 197-200 by End of October or sooner..
Daily, weekly RSI overbought
Daily, Weekly' monthly Bbands over extended
Weekly moneyflow overbought
XLC Sector at resistance here at 113.00
Looking for a correction here with the rest of the market.. googl started late and is finishing late ..
Risk to reward here is
Stop loss and Add short up until 235.00
Target 1 - 210
Target 2 - 200
Good luck
$GOOG $226 Premarket! 2.61 Golden Pocket Above for Puts Well what do we have here? We have Taz taking a peak at the GOOGLE pop 👀 would you just look at it? If you put the fib right at the last high and low, you get a nice Golden Pocket Target Above at $228.97 …
Now let’s be clear here. Congrats to the Bulls in my Room that saw that Alert from the Bot and Hopped in with the Big Boys.
For now, it’s time to go with tie short side imo. If we can get a tap of that 2.61 pocket above, I’ll swing something to the downside for next week. Targets would include a Gap fill. If not, then I will be patient and possibly not even enter. I would rather optimal entry. Then forced entry. Have a good one yall.

Alphabet Stock Price Soars By Around 8% After Court RulingAlphabet (GOOGL) Stock Price Soars By Around 8% After Court Ruling
At the end of August, we reported that Alphabet (GOOGL) stock price had reached a historic high, closing above $210. But today, the price is likely to climb to a new, significantly higher level. Yesterday, in after-hours trading, it surged by roughly 8%.
Why did Alphabet (GOOGL) shares rise?
The jump is explained by a court ruling in a case concerning alleged monopoly practices related to the Chrome browser. According to Investopedia, a federal judge ruled that the tech giant does not need to sell Chrome. This dispelled fears that Alphabet might have been forced to part with a core part of its business.
Interestingly, one of the factors behind the judge’s decision was the spread of AI solutions (such as ChatGPT and Perplexity), which offer competition to Chrome’s search and browsing functions.
Technical analysis of GOOGL shares
In our earlier review, we identified:
→ an upward channel (shown in blue), formed by long-term price movements;
→ an intermediate channel (in place since late spring).
If today’s trading in GOOGL opens around where the price settled in yesterday’s after-hours session (close to $226), this would mean:
→ the growth target at the upper boundary of the blue channel has been reached;
→ in the context of the summer’s price swings, Alphabet (GOOGL) shares will be in an extremely overbought zone.
Once the initial excitement following the news subsides, this could pave the way for a correction, which seems reasonable after a rise of more than 55% in the past five months.
In this case, the $215 level may serve as an indicative target for the correction to end:
→ it marks the lower boundary of a bullish gap that is highly likely to form today;
→ the market could then return within the aforementioned channels, giving the bulls renewed confidence to buy, as Alphabet (GOOGL) would no longer appear overbought, while the strong fundamental backdrop (as can reasonably be expected) would remain intact.
This article represents the opinion of the Companies operating under the FXOpen brand only. It is not to be construed as an offer, solicitation, or recommendation with respect to products and services provided by the Companies operating under the FXOpen brand, nor is it to be considered financial advice.
GOOGL Technical Analysis-Sep. 3Alphabet ripped higher off the 207.5 support zone, launching straight into 227–229 resistance with a massive breakout candle. This kind of vertical move shows aggressive buying and likely short covering.
* Resistance: Price is stalling at 227–229, which lines up with prior supply. After such a sharp move, this zone is where profit-taking typically kicks in.
* Support: Immediate support sits back at 220–222.5, then stronger support at 217.5, and the base of the breakout at 207.5.
* Indicators: MACD flipped sharply bullish, histogram expanding. Stoch RSI is deep in overbought (near 90), suggesting the move may need to consolidate or pull back before continuation.
The structure shows bulls are in control, but the chart is overextended in the short term — a consolidation or retest is likely before another leg higher.
🔍 Options / GEX Confirmation
* Resistance:
* Heavy call positioning at 225–227.5, aligning with the current stall zone.
* Overhead walls thin out above 230, meaning if bulls clear this resistance, room opens toward 235+.
* Support:
* 220–222.5 has strong call wall and dealer support.
* 217.5 is the next layer of structural and options-backed support.
* 207.5 remains the deepest level tied to highest positive gamma support.
Options flow confirms the same setup: bulls control momentum, but 227–229 is a heavy ceiling until volume pushes through.
🎯 Trade Scenarios
* Bullish: Hold above 222.5–220 and break through 229 with volume → upside targets 235 → 240.
* Bearish: Rejection at 227–229 with a breakdown under 222.5 → downside targets 217.5 → 207.5.
GOOGL’s breakout is impressive, showing strong institutional buying. But the stock is now pressing into major resistance at 227–229, where consolidation or a pullback is likely. If bulls can defend 220+ on any dip, the chart sets up for another leg higher toward 235–240. If not, the rally risks fading back to 217.5 or even 207.5 before stabilizing.

Google Possible PullbackGoogle has been going strong as of recent, but I believe its due for a pullback to around 208. We have a rising wedge pattern that google has been following pretty accurately, and by the next week or so I think it will have a healthy cool off before continuing up so a small opportunity for puts.
$GOOG Trade BreakdownNASDAQ:GOOG Trade Breakdown
I entered on Aug 20 @ $200.75 off a hammer reversal that formed at a triple confluence:
– Rising trendline (Jul 9 → Aug 1 lows)
– Horizontal support (prior resistance)
– 21EMA support
Execution:
– Initial stop: $197.45 (beneath hammer low, ~1.6% risk)
– Trailed stop to breakeven once pivot held
– Position sizing: ~5% of account, <1% total risk
Current Structure:
– Cleared $208.70 pivot on strong volume
– RSI ~74 (extended, but consistent with breakout momentum)
– ATR ~$4.30 = 2% daily volatility
– Next resistance: $218–220 zone (upper channel + prior supply)
Takeaway:
This is a textbook anticipation → breakout sequence. Entry was early but disciplined with risk control. Trade is now “free-rolling” with stops above breakeven, allowing me to focus on letting the trend work.
#TechnicalAnalysis #SwingTrading

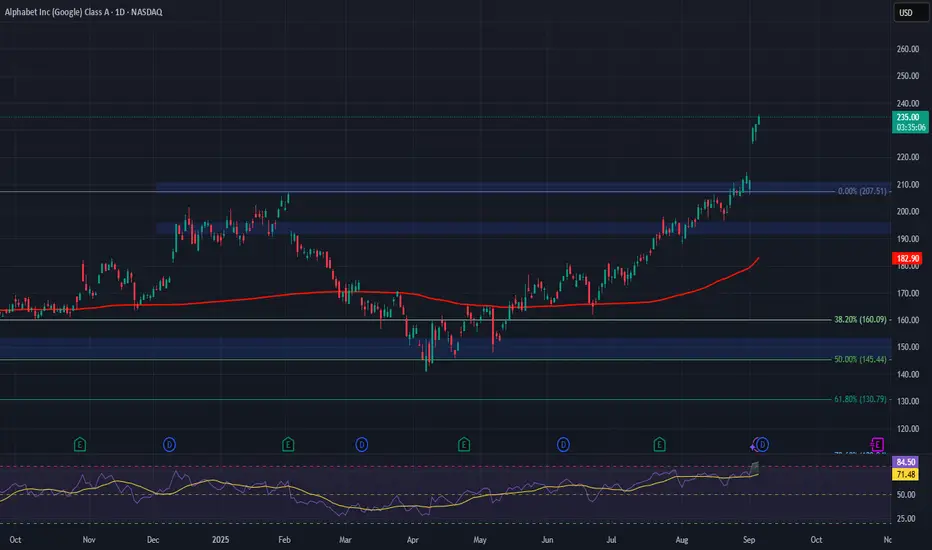
Alphabet (GOOGL) Shares Set an All-Time HighAlphabet (GOOGL) Shares Set an All-Time High
As the chart of Alphabet (GOOGL) shares shows, the price in August exceeded the February high. For the first time in history, the close price moved above $210.
The positive market sentiment is being driven by the development of AI technologies, as well as Alphabet’s (GOOGL) ambition to maintain a leading position in this field. Among the latest news, it is worth noting that Meta Platforms (META) has signed an agreement to use Google Cloud’s infrastructure for its AI projects, which is expected to bring Alphabet around $10 billion in revenue.
Technical Analysis of GOOGL Shares
In the long-term context, price fluctuations are forming an ascending channel (shown in blue). After falling to the lower boundary in early April (when Trump first announced his tariffs), the balance of sentiment shifted, and the price has since been moving within a new medium-term ascending channel (shown in purple), approaching the upper boundary of the blue channel.
At the same time, we can make the following observations, which generally point to a bullish market:
→ the price has confidently broken above the median line of the long-term channel;
→ the price has consolidated above the psychological level of $200, which acted as resistance at the start of the year;
→ this summer, the price has been trading near the upper boundary of the medium-term channel, highlighting strong demand – short-term declines towards the median line of the medium-term channel have quickly attracted buyers;
→ in August, the $205.75 level switched its role from resistance to support.
From a bearish perspective, the RSI indicator is showing signs of divergence, suggesting that the rally may be running out of steam. However, it seems that more significant drivers would be needed to shift the current positive sentiment:
→ Technically, Alphabet’s (GOOGL) share price reaching the upper boundary (which looks realistic given the bullish factors listed) could motivate buyers to take profits.
→ Major economic news, such as a change in the Federal Reserve’s interest rate policy.
This article represents the opinion of the Companies operating under the FXOpen brand only. It is not to be construed as an offer, solicitation, or recommendation with respect to products and services provided by the Companies operating under the FXOpen brand, nor is it to be considered financial advice.
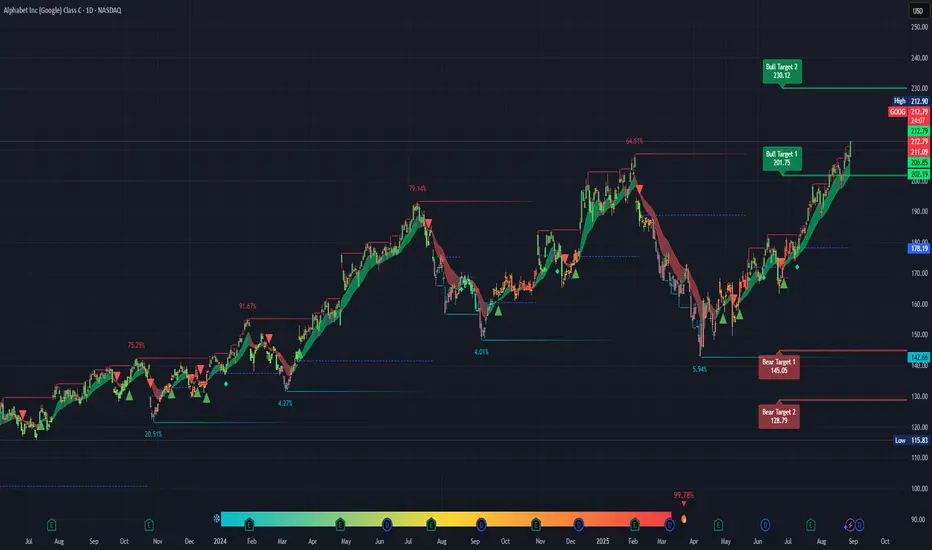
Goog....The question is how high?
Strong Trend: Price has been pushing higher since April 2025, with higher highs and higher lows intact. The green zone shows momentum is with the bulls.
Breakout Attempt: You’re sitting near recent highs around 212.90, which shows buyers are in control. If it clears that resistance cleanly, Bull Target 1 (201.75) is already hit, and Target 2 (230.12) is in play.
Volume Uptick: Volume looks supportive of the breakout move (12.61M shown). More buyers stepping in usually confirms the move.
⚠️ Concerns (Why It Might Fail)
Overextended Run: The stock has already run ~40+% since April. Moves like this often see consolidation or pullbacks before the next leg.
Bear Targets Still in Play: If the breakout fails, your downside risk is real: 142.66 → 145.05 (Bear Target 1), and possibly 128.79 (Bear Target 2). That’s a nasty ~30–35% potential drop.
Resistance at 212.90: If it can’t close strong above here, you may get a short-term double top.
🎯 Cost vs. Benefit
Upside to Bull Target 2 (230.12): ~8% gain.
Downside to Bear Target 1 (145.05): ~32% risk.
Risk/Reward: About 1:4 against you right now unless you use a tight stop. That’s not attractive for a fresh entry.
🤔 Too Good to Be True Filter
“This chart looks like it’s going straight to 230” — probably not that easy. Expect chop and possible pullbacks around the 210–215 zone. If it does blast through with high volume, then you’ve got confirmation.