Alphabet - The exceptional short setup!🔒Alphabet ( NASDAQ:GOOG ) is reversing right now:
🔎Analysis summary:
Alphabet is clearly indicating a major bearish move. With the current retest of major resistance, Alphabet is slowly reversing. Since Alphabet is also massively overextended, really everything is pointing towards a move lower. Just give it a couple of days to reverse.
📝Levels to watch:
$300
SwingTraderPhil
SwingTrading.Simplified. | Investing.Simplified. | #LONGTERMVISION
Alphabet Inc. Units Thailand Depositery Receipts Repr 0.01 Sh
No trades
Trade ideas

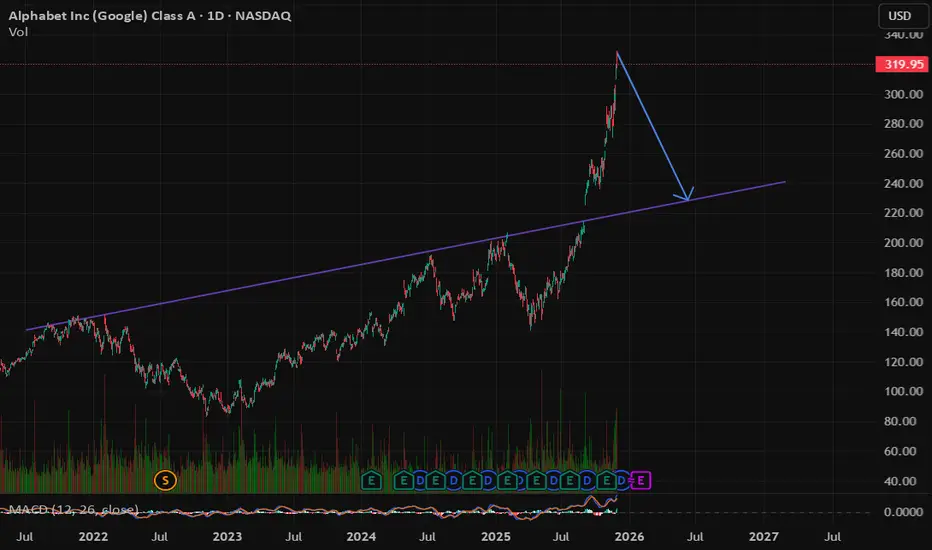
Google - A major correction starts now!🚽Google ( NASDAQ:GOOGL ) is now creating a top:
🔎Analysis summary:
Over the course of the past couple of months, we witnessed a major rally on Google of about +100%. This rally was totally expected, following the underlying bullish rising channel. But with the current retest of the trendline, Google is heading for a major correction.
📝Levels to watch:
$300 and $200
SwingTraderPhil
SwingTrading.Simplified. | Investing.Simplified. | #LONGTERMVISION

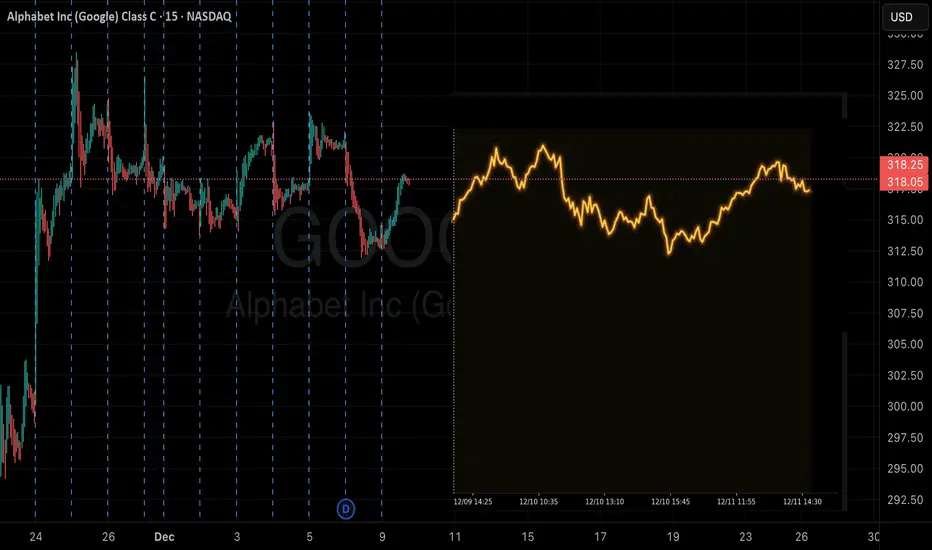
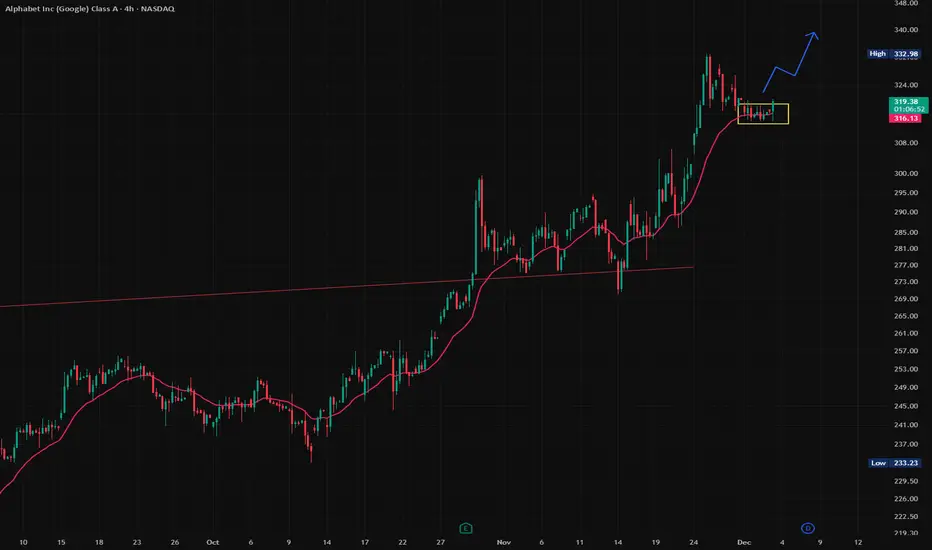
GOOGL at a Key Decision Zone — Dec. 10 TA with GEX InsightGOOGL continues to respect one of the most important levels on its chart: the 311–312 zone. Every time price dips into this area, it gets absorbed instantly, creating a solid base for the recent recovery. That kind of repeated defense usually means real buyers are sitting there, not just random bounces.
The move back toward 316–318 shows where supply still lives. Price wasn’t able to push through that pocket, and the rejection lined up perfectly with the upper trendline on the 1-hour chart. It doesn’t break the bullish structure, but it does tell us that sellers remain active and patient at that level.
On the 15-minute timeframe, the picture is cleaner. GOOGL had a strong run off the 311 support, pushed straight into 318, and then shifted into a controlled pullback. EMAs are flattening, which usually means the market is transitioning from momentum into consolidation. The structure stays constructive as long as price avoids making a new lower low. That 311–312 zone is the line in the sand.
The gamma exposure map adds clarity to why the stock keeps behaving this way. The put wall is stacked right at 311–312, which means dealers hedge by buying each time price approaches it — creating that reliable support. On the other side, the first meaningful call-wall pressure sits at 316–318. That’s exactly where price keeps getting rejected, because dealer hedging tends to produce sell-side flow as we approach those levels.
This leaves GOOGL pinned between two strong forces: a supportive floor and a heavy ceiling. Until one of those gives way, the stock is likely to keep drifting around the middle of the range, roughly near 315. A clean breakout over 318 would free it toward 322–325, where the next gamma pockets sit. A breakdown under 312, on the other hand, would open room toward 310 and possibly even 300 if momentum shifts.
Right now the chart and the options-based gamma structure are aligned, and that usually produces reliable levels. GOOGL is coiling — and whichever side breaks first will define the next directional leg.
Disclaimer: This analysis is for educational purposes only and is not financial advice. Always do your own research and manage your risk.
GOOGL Market Preview – December 5GOOGL is heading into tomorrow’s session sitting inside a rising structure that has now stalled under the 319–323 supply zone. Price has been grinding higher for days, but today’s sharp rejection showed the first sign of buyers losing momentum. At the same time, the lower trendline continues to hold cleanly, creating a pressure zone where a breakout or breakdown becomes more likely.
Structure Outlook (1H Trend View)
GOOGL has been respecting a gradual uptrend from the 311–313 support area. That zone has acted as the primary accumulation level each time sellers pushed down. But the big story is overhead: the 319–323 supply has rejected every attempt to break higher. Each test created fast selling wicks and stalled momentum.
Price is now compressing between:
* The rising trendline below
* A heavy, sticky supply box above
This creates a squeeze that usually leads to a decisive move. Until GOOGL reclaims 320–323, upside remains limited.
15M SMC View
What Today’s Price Action Means
the CHoCH and BOS marks tell the full story. The BOS into demand was strong, but the CHoCH did not turn into real continuation. Price spent most of the afternoon moving sideways under the red SMC zone — a sign of hesitation.
Bearish signs:
* Repeated rejection from 319–320
* SMC sell zone holding perfectly
* EMAs flattening to slightly downward
* Volume fading on each bounce
Bullish signs:
* Buyers defended the 315–316 demand area
* No clean breakdown beneath the trendline
* Liquidity resting above 320 that could be swept
Overall → buyers are still present, but they aren’t strong enough yet to force a breakout.
GEX Read for Tomorrow
GEX layout gives clear directional boundaries:
* Call walls: 320 → 322.5 → 327.5
* Highest positive GEX: near 320
* PUT support: 315 → 312.5 → 310
* Dealer bias: Calls only 19% (mixed-to-neutral)
* If GOOGL can take out 320, dealer hedging can accelerate a push toward 322.5 and 325.
* If it fails again, price flows naturally back toward 315–312.5, which aligns with the SMC demand zone.
This setup favors whichever boundary breaks first.
What I Expect on December 5:
Unless buyers show unusually strong momentum, GOOGL is more likely to stay range-bound or lean slightly bearish into tomorrow. The inability to reclaim the 319–320 zone today suggests sellers still have a grip.
Upside scenario:
If GOOGL breaks and holds above 320, mo
mentum can squeeze into 322.5 and potentially 325. Liquidity above 320 creates room for a continuation sweep.
Downside scenario (slightly higher probability):
If GOOGL rejects 319–320 again or loses 315 support, the structure favors a drift toward 313–312.5. Breaking that level exposes 310 as the next liquidity pocket.
My Bias:
neutral-to-bearish unless GOOGL can reclaim 320 with conviction. The combination of structure, SMC flow, and GEX resistance suggests the upside remains capped until buyers show real strength.
Quick Trade Thoughts (Not Financial Advice)
Bullish plan:
Break and retest above 320
Target 322.5 → 325
Invalidation: failure to hold the breakout
Bearish plan:
Reject 319–320
Target 315 → 313 → 312.5
Best RR is always near the top of the range
Avoid trading the middle of the wedge — it’s where GOOGL chops and kills prethetmium.
Disclaimer:
This outlook is for educational discussion only. It reflects a technical perspective on market structure and options positioning. Always trade your own plan and manage your risk.

GOOG - Strong Buy (Since COVID) 6 HRGOOG continues its 3 wave movement that started just following Covid. It recently completed the A wave of Circle 3 and now appears to want to retrace to just below 300 before continuing its climb to 865 next year. The current B wave is difficult to measure probability - given its exuberance (volume) and the tendency to alternate with the more protracted drop from circle 1 to circle 2, I suspect the B wave may complete quickly.

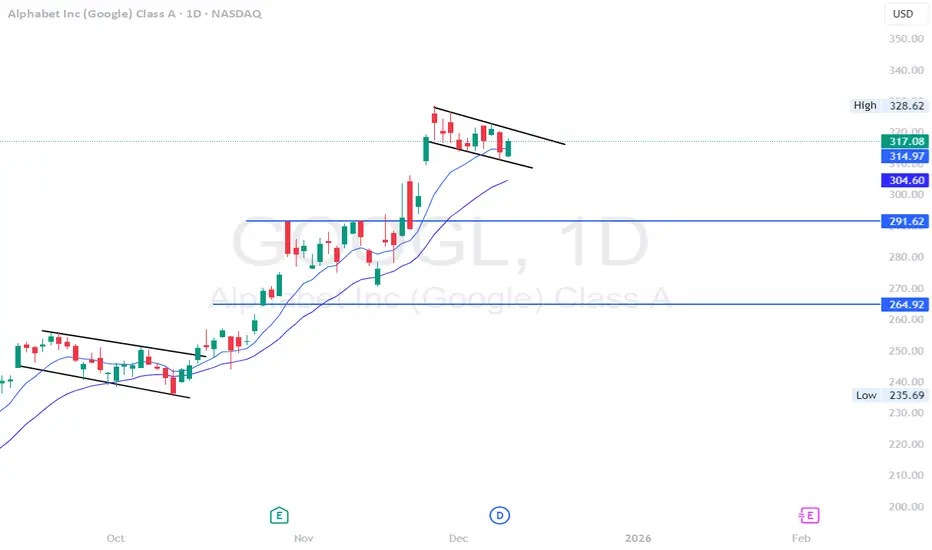
GOOGL - flagging on the daily time frame.GOOGL - Stock flagging on the daily time frame. potential breakout move above $320. Stock does have gap to fill to the downside of $309.50 breaks. possible move still on both sides.
GOOGLHow to become successful in forex and stock trading: 1.Master fundamentals and technical analysis. 2,Build and follow a solid trading plan. 3.Apply strict risk management (1–2% rule). 4.Stay disciplined—control fear and greed. 5.Record and analyze every trade. 6.Focus on high-quality setups only. 7.Diversify across assets and markets. 8.Keep evolving—study, adapt, and grow daily.
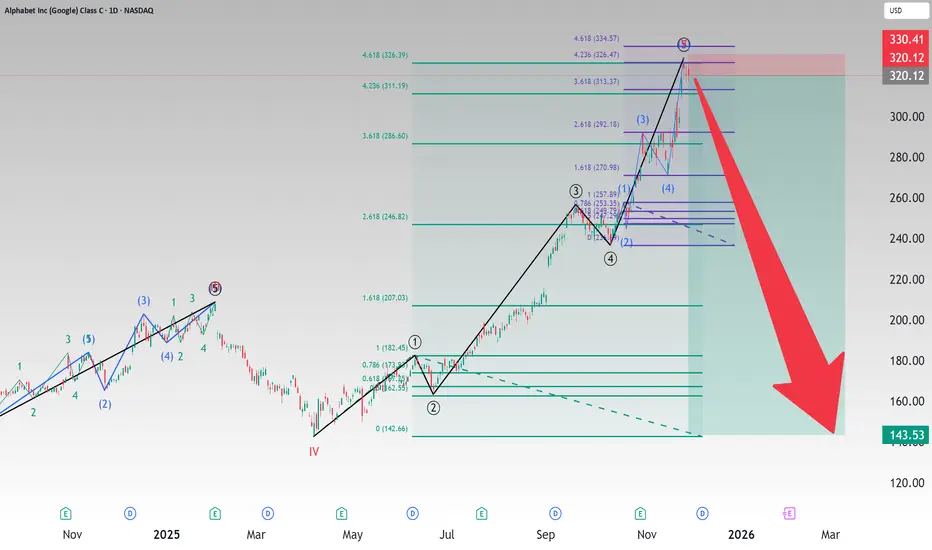
Google Short: 5-waves completion with Fibonacci ExtensionsOver here, I want to discuss the possibility that Google has peaked. I know that I am going against Berkshire Hathaway. But then, we can really confirm if the latest decision is really made by Warren Buffett given that he has also recently announced his retirement? And Charlie Munger is no longer with him.
Of course, I've always given my analysis based on Wester TA (chart patterns), Japanese TA (Candlesticks), and Elliott Waves. And over here, I present to you the potential 5-waves that might have completed on Google. And that is supported by 2 Fibonacci extensions:
1. From Primary Wave 1 across the entire wave, and
2. From Intermediate Wave 1 of 5 across entire Primary Wave 5.
But these are not certainties but probabilities and most importantly, risk-reward.
For this idea, the stop is most important: slightly above the All-time-high: $328.67. I would say that you can put the stop at $329 or $330. If Google goes beyond and makes new ATH, then this idea can be trashed.
The take profit is at the previous wave 4 of a higher degree, or the low made on 7th April 2025: $142.66.
Good luck!
Google at record highs but Wave 3 cluster/RSI screams pullback!Alphabet is leading the Magnificent Seven, hitting record highs near $330, while most AI and growth stocks, including Nvidia, have stalled. Since launching Gemini 3 in mid-November and with news of a $4.9 billion Berkshire stake, Alphabet has rallied more than 135% off its April low, outperforming all Big Tech peers in 2025.
But Alphabet is at the 161.8% Fibonacci extension of its long-term move and long-to-medium-term move, which matches a textbook Elliott Wave 3 cluster completion. RSI is at an extreme 83 on the weekly, hinting a Wave 4 pullback to $288 could be next, even as the macro backdrop (Gemini 3 AI buzz, Fed rate cut hopes, and demand for Google’s AI chips from Meta) stays strong. Ultimately, a final Wave 5 could extend up to $380-$400.
Key drivers:
Gemini 3 launch positions Alphabet as an AI leader, topping major multimodal benchmarks.
$4.9B Berkshire stake signals major institutional confidence.
Meta seeks Google’s TPU chips, boosting Alphabet’s AI hardware story while pressuring Nvidia.
Fed rate cut odds above 80% further support growth stocks.
Elliott Wave/technical structure aligns with a potential $288 pullback before any push to $380.
Will Alphabet finally pause after eight explosive months, or does the rally have further to run?
Let us know your view and Elliott Wave count in the comments, and follow for more big-picture, technical-plus-macro trade ideas!
This content is not directed to residents of the EU or UK. Any opinions, news, research, analyses, prices or other information contained on this website is provided as general market commentary and does not constitute investment advice. ThinkMarkets will not accept liability for any loss or damage including, without limitation, to any loss of profit which may arise directly or indirectly from use of or reliance on such information.

Alphabet - This rally will soon be over!🪦Alphabet ( NASDAQ:GOOG ) will end its rally soon:
🔎Analysis summary:
Starting back in 2025, Alphabet created a major bullish break and retest. Following this behavior, we witnessed an expected strong rally of about +120%. But with the current retest of the upper resistance trendline, Alphabet will soon create a healthy retracement.
📝Levels to watch:
$300
SwingTraderPhil
SwingTrading.Simplified. | Investing.Simplified. | #LONGTERMVISION

can be a nice short from heresuper extended movement here, the run is very likelly to dump soon in my opinion
Quant signals V3 GOOG Katy AI 1M Forecast: Bearish Drift AheadGOOG QuantSignals Katy 1M Prediction 2025-12-02
QuantSignals Katy AI Stock Analysis
Analyzed 1 stock(s): GOOG
GOOG Analysis:
Current Price: $318.32
Final Prediction: $316.01 (-0.73%)
30min Target: $315.65 (-0.84%)
Trend: BEARISH
Confidence: 54.9%
Volatility: 21.3%
Summary: Generated 0 trade signals from 1 successful analyses out of 1 symbols.

GOOG - Preparing to Run AgainIt would appear GOOG is finishing a corrective "B" wave and will soon turn upward for a "C" Wave toward a target of 364.
Note that there is a zone from 339 to 349 where we might see an early reversal down to a Wave 4. It appears to want to move toward its trend line though, which would require a slightly extended run. Be cautious in this zone.
GOOG Generally moves in a corrective pattern (ABC) upward and downward, which introduces volatility, but overall, I have about 70% confidence in this move once the current B wave finishes .

$GOOGL breakout of pullback?Bought some NASDAQ:GOOGL earlier today. I am bearish longer term on the chart, but this looks like it is going to make a new high first.
Google's new Ironwood TPU (7th-gen TPU) is a big deal for AI inference
Google (GOOGL): Bullish Reversal in Play – Eyeing $237 TargetBullish Engulfing and Fibonacci Channel Support
Last week’s green candle on the weekly chart of NASDAQ:GOOGL has engulfed the main body of the previous red candle, signaling a potential trend reversal. Moreover, the price has respected a key support level within the Fibonacci channel, further strengthening the bullish sentiment.
Key Observations:
Fibonacci Channel:
The stock is moving well within an upward Fibonacci channel, indicating a healthy uptrend.
Current support is holding at the midline, confirming buyers' interest at this level.
Bullish Candle Formation:
A clear bullish engulfing candle pattern has formed, a strong reversal signal.
Upside Potential:
Based on Fibonacci extensions and channel resistance, the next major target lies at $237, offering a ~20% upside from the current levels.
Moving Averages:
The price is trading above key moving averages (20, 50, and 200-week), reinforcing a strong bullish outlook.
What to Watch:
Volume confirmation will be crucial to validate this move.
Keep an eye on the support at $173.96 and $167.59 (short-term MAs) to manage risk effectively.
💡 Trade Idea:
A breakout above $196 could provide a clear signal to ride this uptrend. Consider trailing stops as the stock approaches $237 to lock in gains.

November's Tech Shake-Up: Google vs. Nvidia DivergenceNovember marked the widest divergence yet between Google and Nvidia NASDAQ:NVDA . Nvidia’s pullback wasn’t just routine profit-taking—markets started pricing in a strategic shift by hyperscalers potentially moving away from GPU-only AI stacks. This narrative could dilute Nvidia’s moat, while bolstering demand for diversified AI infrastructure players like Google.
📊 GOOGL Setup: Strong Fundamentals, Strategic Support
Google remains fundamentally strong and technically well-supported. With earnings resilience and infrastructure independence, NASDAQ:GOOGL may outperform if tech rotation accelerates. The stock is sitting above a clear demand zone, offering a calculated risk-reward play.
🔔 Trade Idea
Entry Zone: $252 – $256 (support area)
Take Profit 1: $292
Take Profit 2: $327
Stop Loss: $225
📌 This aligns with multi-month support and potential breakout continuation.

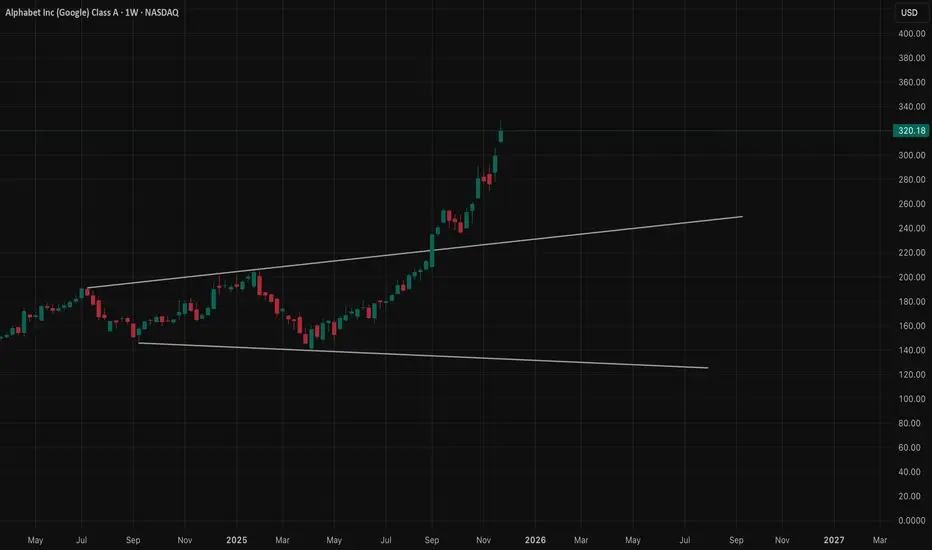
GOOGL · Dec 1–5 OutlookStretched Rally Meets Heavy Supply — Time for a Pause?
Weekly timeframe (bigger picture mood)
The weekly chart shows a monster trend. GOOGL has been riding this rising channel almost perfectly, and now price is pushing into the upper half of the channel where historically the momentum starts slowing. Candles are still green, but the bodies are getting smaller — that’s usually the market showing fatigue, not reversal.
Uptrend still intact, but the push is getting harder.
Daily timeframe (where the slowdown becomes real)
The daily chart lands right inside a clean supply zone around 323–332. Every attempt to break above that zone leaves long wicks. That’s not bearish yet — it just means sellers are active.
Volume dips here confirm one thing:
Buyers are getting tired exactly where sellers finally have the upper hand.
Whenever a strong weekly trend pushes into daily supply and stalls, that’s usually the stage before:
* a pause
* a pullback
* or a sloppy sideways grind
Not reversal… just cooling pressure.
1H timeframe (early crack in momentum)
This is where the weakness shows clearly.
Price tried to break supply, failed, and started forming lower highs directly underneath the ceiling.
That’s how uptrends slow: first the momentum dies, then structure breaks later.
There’s a small CHoCH on the 1H, meaning the market tested the bullish side and then flipped short-term control back to sellers. Trendline is still holding — but barely.
Whenever the 1H starts doing this under daily supply, the bulls usually need a “rest day.”
15m timeframe (the truth surface)
The 15m chart shows the “real” story before everyone sees it:
* Repeated rejections at the same zone
* Break of structure downward
* Retests failing
* And smaller and smaller bounces
This is the type of compression pattern that usually breaks to the downside first before anything else.
The 15m broke early.
The 1H is bending.
The daily is in supply.
The weekly is stretched.
The pieces fit.
How GEX confirms all of this
The GEX chart adds the final piece of evidence.
No need to hype — just simple cause & effect:
Major call-wall cluster: 327–335
This is thick resistance from hedging flows. Market makers get forced to hedge against upside when price enters that region, which creates downward pressure.
And guess what?
That zone lines up EXACTLY with the daily supply and the rejection levels on 1H and 15m.
Major put-magnet cluster: 312–310
Below, the heaviest put-weight sits around 312–310, which acts like a magnet if price loses 315.
So the GEX map basically says:
* “Upside is heavy and expensive near 327–335.”
* “Downside is easier if 315 breaks.”
Perfect confirmation to the TA.
Trade ideas (based on structure + GEX)
These are not signals — just how a trader would think based on the levels.
BULLISH SCENARIO (only if strength proves itself)
Trigger: Must reclaim 326 with a clean push + retest.
If that happens:
Targets:
* 330
* 332 (end of the supply zone)
* 335 (GEX wall — tough to break)
Safer call-side idea (for Dec 6 expiration):
* 325c / 330c spread
Tight risk, matches GEX resistance.
Aggressive idea:
* 330c, but only if 326 breaks with volume.
BEARISH SCENARIO (more likely unless buyers show strength)
Trigger: Break below 315
This opens the easier path where both TA and GEX want price to go.
Targets:
* 312
* 310
* 305 (if panic selling kicks in)
Put-side idea (Dec 6 expiration):
* 315p / 310p spread
Cheap, logical, and matches the GEX magnet.
Aggressive:
* 310p, aiming for the magnet flush.
NEUTRAL / SCALP IDEA (for those who don’t want directional risk)
Inside the 323–332 supply zone:
* Short calls above 332
* Short puts above 315
…because price is likely to chop until one side breaks.
This reflects the actual structure: compression between supply and short-term support.
My overall view for the week (Dec 1–5)
Everything points to a cooling week, not a runaway rally. Buyers have pushed hard for weeks, and GOOGL is finally running into an area where sellers care again.
Unless 326 breaks clean, this week favors:
* A pause
* A pullback
* Or a choppy range with bearish lean
Break of 315 = quick drop.
Break of 326 = one more push.
Disclaimer
This is not financial advice.
Educational analysis only — always manage risk according to personal trading rules.
Alphabet (NASDAQ: $GOOGL) Stock: 2025 Continues BullishAlphabet’s stock continues its remarkable performance in 2025, surging nearly 70% year-to-date as strong fundamentals and aggressive AI expansion fuel investor confidence. Much of the momentum comes from Alphabet’s rapidly growing cloud division and the continued rollout of Gemini, its advanced AI model powering enterprise workloads, search upgrades, and next-generation productivity tools. This expansion has pushed Alphabet’s market valuation close to $4 trillion, establishing it as one of the fastest-growing mega-caps this year.
Another major catalyst is Google’s deepening presence in India’s digital infrastructure. The Adani Group recently announced a $5 billion co-investment with Google to build a large-scale data center aimed at supporting India’s rising cloud, AI, and storage needs. This move comes shortly after Google committed $15 billion to an AI-focused data center cluster in Andhra Pradesh. Together, these investments reinforce Alphabet’s expanding footprint across one of the world’s fastest-growing markets and strengthen long-term revenue prospects.
From a technical standpoint, GOOGL remains strongly bullish after breaking above a long-held ascending trendline that acted as multi-year resistance. The breakout triggered a sharp rally, pushing the stock to the current price around $320. Momentum indicators show extreme strength, with the MACD at record highs and RSI firmly overbought—signals that suggest the uptrend remains intact but may face volatility.
The next psychological resistance sits at $350, a level traders will watch closely. On the downside, immediate support lies at $291, followed by a stronger structural zone at $255. As long as price stays above the former trendline and these supports, the broader bullish structure remains dominant.

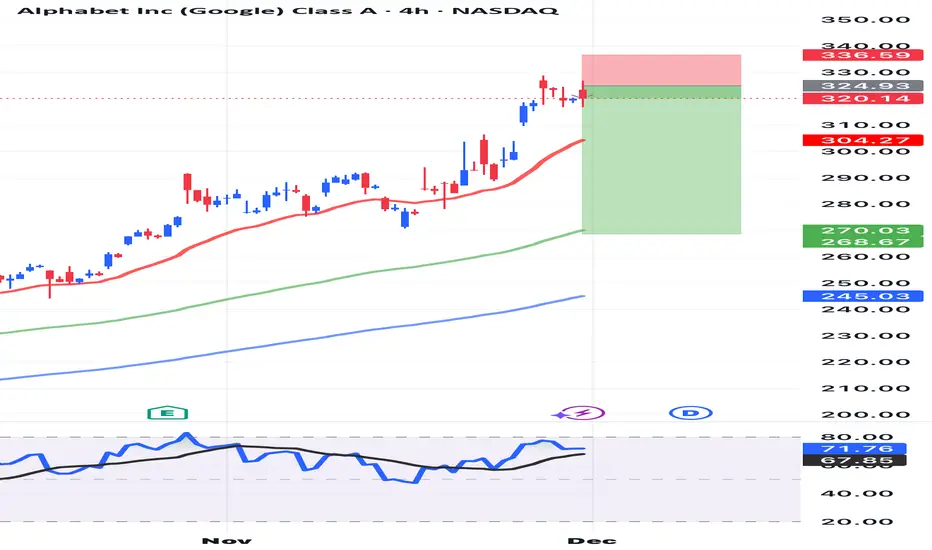
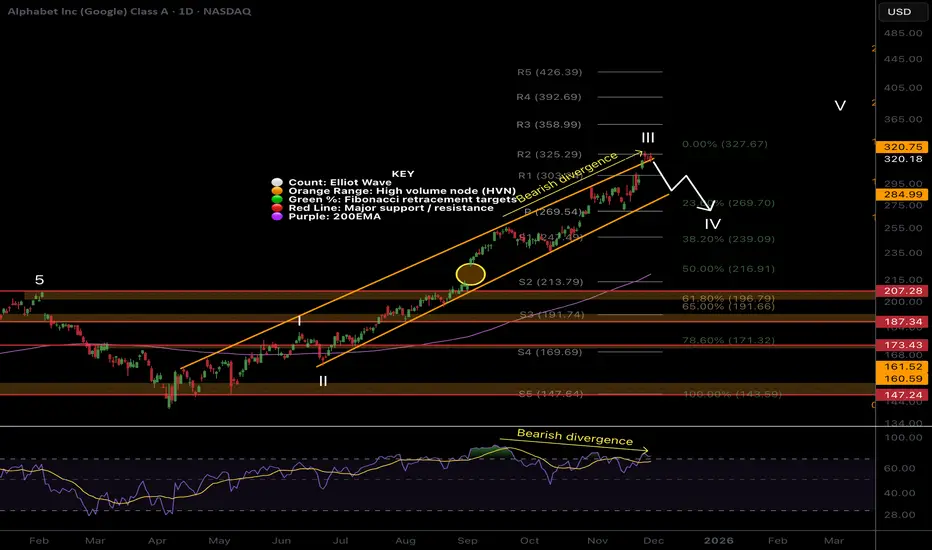
Google still going up in wave but hit 1.618 extensionNASDAQ:GOOGL Wave III continues, price looks exhausted but just won’t stop rewarding investors. It may trap late trend-chasing investors, causing them to capitulate lower.
Wave (5) of III is likely to complete with a throw-over of the upper channel boundary. Wave IV now has an expected retracement target of the 0.236 and daily pivot, $269. The gap remains unfilled.
📈 Daily RSI has printed a bearish divergence from overbought for weeks.
👉 Continued upside has a target of the R3 pivot
Safe trading
How to Use Simple Moving Averages (SMA) to Predict Price TargetsIn this video, you’ll learn exactly how to use the Simple Moving Average (SMA) to find both short-term and long-term price targets.
I explain which SMA settings work best, how to spot trend direction, and most importantly:
When you should take a trade and when you should stay OUT of the market to avoid losses.
What You’ll Learn:
How the Simple Moving Average works (SMA 9, 21, 50)
How to use SMA for short-term and long-term price targets
Best SMA crossover strategies
When to enter a trade using SMA
When to stop trading / avoid traps
How institutions use SMA to set levels
Tips to improve your accuracy and timing

GOOG Weekly CALL Alert — Early-Week Momentum Play ActivatedGOOG QuantSignals V3 — Weekly Signal (2025-11-28)
Expiry: 2025-12-05 (7 Days)
Instrument: GOOG
Current Price: $319.97
Direction: CALL (LONG)
Confidence: 60% (Medium)
Risk Level: ⚠️ MODERATE
📈 Signal Details
Strike Focus: $320.00 (ATM, 0.513 Delta)
Entry Range: $5.60 – $5.70 (mid $5.65)
Target 1: $9.04 (+60%)
Target 2: $12.43 (+120%)
Stop Loss: $2.83 (-50%)
Position Size: 2% of portfolio
🧠 Katy AI Analysis
Predicted Move: $319.97 → $333.48 (+4.22%) by Dec 1 afternoon
Trend: Bullish momentum building despite initial NEUTRAL label
Sustained Levels: Above $325 through Dec 2
Time Series: Clear gradual upward trajectory
AI Confidence: 60%
📊 Technical & Market Context
Weekly Momentum: +0.33% (Neutral)
Weekly Range Position: 90.2% high
VWAP: $321.97 (resistance)
Support: $315.17 (stop loss)
Resistance: $325 – $330 zone
MACD: Bullish confirmation
News Sentiment: Mixed tech headlines, AI bubble concerns, potential oversold bounce
Options Flow: Neutral PCR 1.00; unusual activity at $175 put is protective hedging
Gamma Risk: Low
⚡ Trade Setup & Strategy
Why This Trade: Katy AI reveals bullish momentum not captured in NEUTRAL summary
Timing Advantage: Entry near weekly high → early-week upside capture
Risk Mitigation: Tight 50% stop, balanced delta selection reduces gamma risk
Google: Pause?Over the past two weeks, Google's stock has been taking a breather, moving mostly sideways. Our primary scenario suggests that price will soon gather fresh upward momentum and swing into the red Target Zone between $377.44 and $418.64, where it should complete the overarching upward cycle of the beige wave I. Once this occurs, a new downward impulse is expected to begin, making the red zone suitable for entering short positions; a stop 1% above the upper boundary of the zone can provide protection.

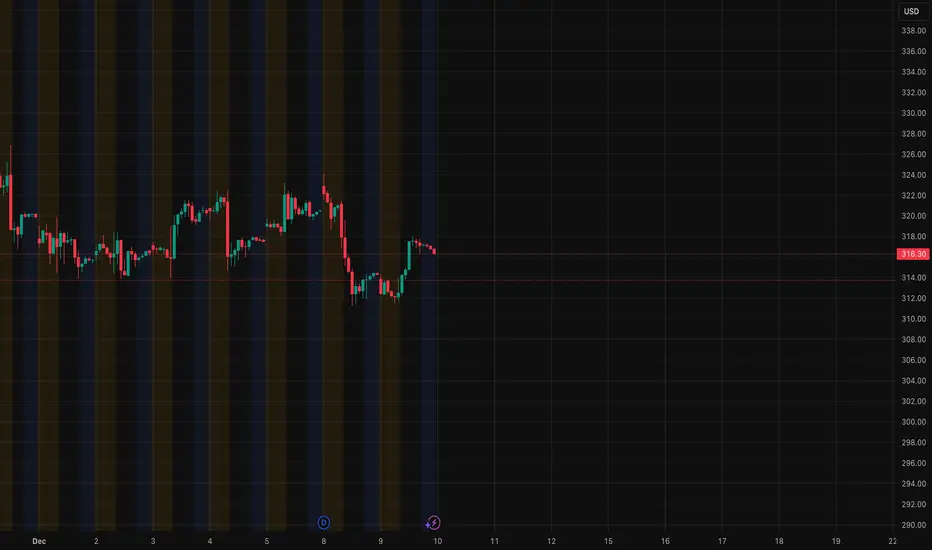
GOOGL Weekly Momentum Signal — Bullish Bias with CautionGOOGL Weekly Signal | 2025-12-09
BUY CALLS
Confidence: 58% (Low Conviction)
Risk Level: High — use small size
🔢 Options Setup
Strike: $317.50 (ATM)
Expiry: 2025-12-12 (3 days)
Entry Range: $4.25 – $4.30
Target 1: $6.38
Target 2: $7.50
Stop Loss: $2.85
Position Size: 2% of portfolio
📊 Market Conditions
Price: $317.81
Weekly Momentum: Bullish +1.15%
VWAP Support: $316.86
Volume: 0.1× normal (light)
Put/Call Ratio: 0.76 (bullish flow)
🤖 Katy AI
Trend: Neutral
Confidence: 50%
Slight upward bias to $319.58 (+0.56%)
📰 News Sentiment
Strong Google Cloud AI partnership news
Gemini user growth positive
Sector-wide tech/AI bullish momentum
⚠️ Key Notes
Low conviction → reduce size
Short expiry → fast decay
Light volume → possible whipsaws