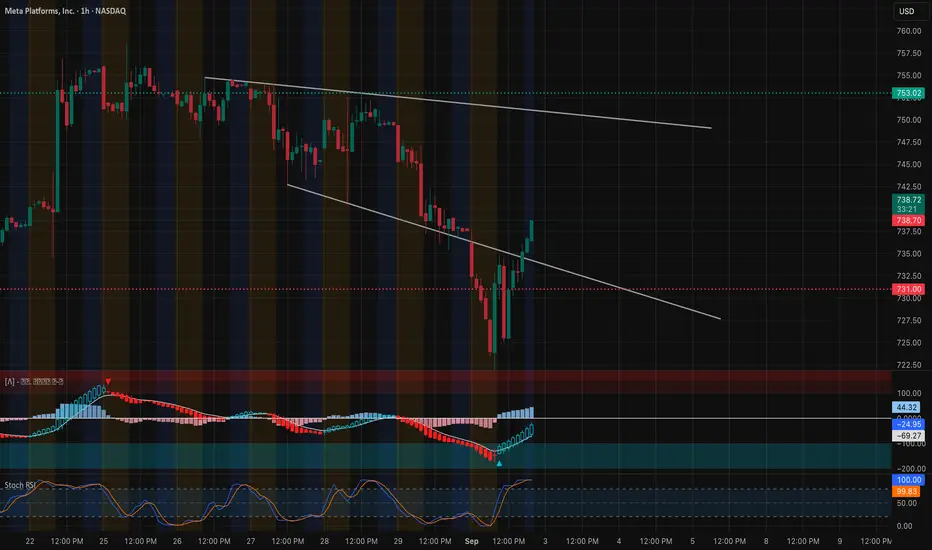
META Technical Analysis-September 3META rebounded strongly off the 721–725 demand zone, breaking through its descending trendline and regaining short-term momentum. The MACD has flipped bullish with a rising histogram, while Stoch RSI is pushing higher, suggesting momentum is building but still has room before becoming overextended.
Next report date
—
Report period
—
EPS estimate
—
Revenue estimate
—
921.00 THB
2.14 T THB
5.66 T THB
2.16 B
About Meta Platforms, Inc.
Sector
Industry
CEO
Mark Elliot Zuckerberg
Website
Headquarters
Menlo Park
Founded
2004
ISIN
TH0150121505
FIGI
BBG01LCH53X3
Meta Platforms, Inc. engages in the development of social media applications. It builds technology that helps people connect and share, find communities, and grow businesses. It operates through the Family of Apps (FoA) and Reality Labs (RL) segments. The FoA segment consists of Facebook, Instagram, Messenger, WhatsApp, and other services. The RL segment includes augmented, mixed and virtual reality related consumer hardware, software, and content. The company was founded by Mark Elliot Zuckerberg, Dustin Moskovitz, Chris R. Hughes, Andrew McCollum, and Eduardo P. Saverin on February 4, 2004, and is headquartered in Menlo Park, CA.
Related stocks
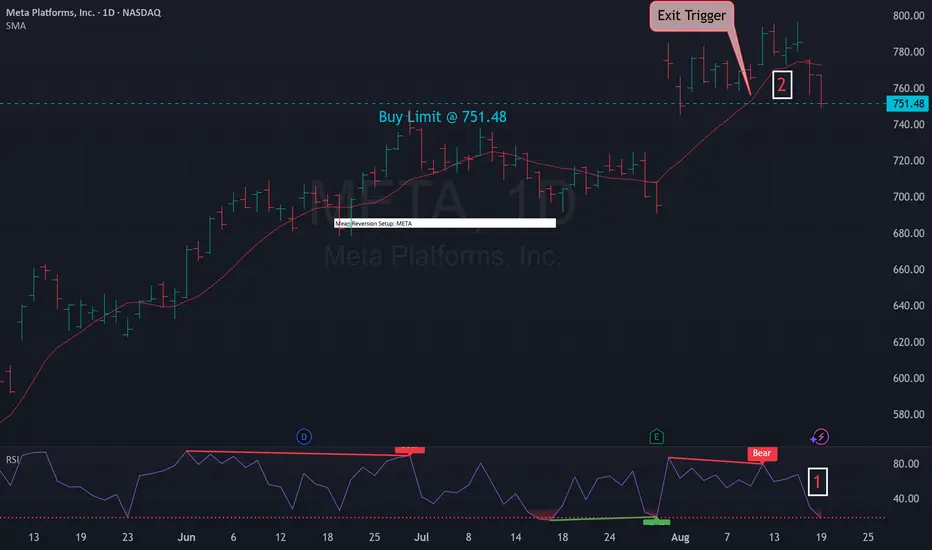
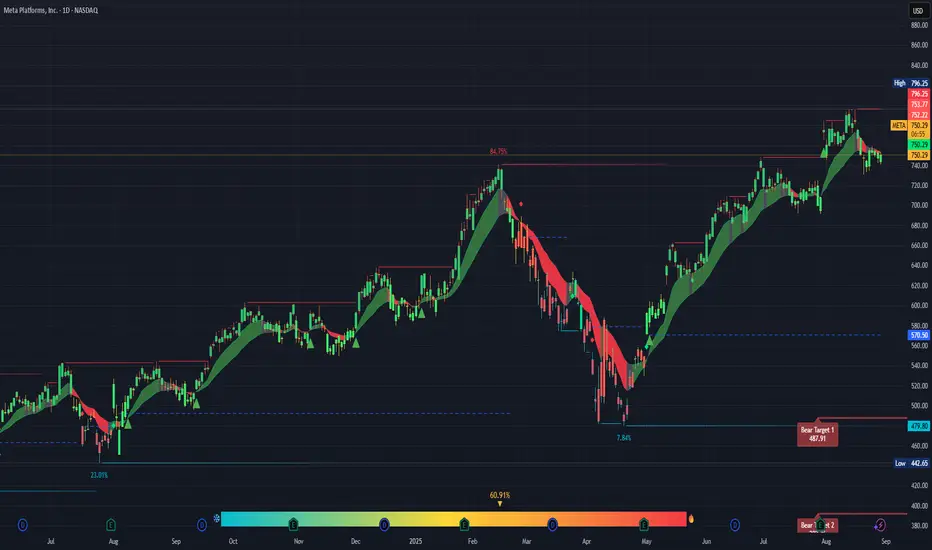
Mean Reversion Setup: META1. RSI in oversold region
2. Price likely to rebound back the the mean
Trade Rules:
Entry Trigger - RSI has cross below oversold region, enter limit buy at close price
Exit Trigger - Close at market when close price cross above exit trigger (Red Line)
Buy Limit @ 751.48
Entered Long @ 100.99
Meta Could Be Fighting HigherMeta Platforms recently pulled back, but some traders may think it’s still fighting higher.
The first pattern on today’s chart is the gap to new all-time highs after quarterly results beat estimates. That may reflect strong fundamentals in the social-media giant.
Second is the weekly close of $736

Meta on the RiseIf Meta breaks above the highlighted resistance zone, it could continue its upward momentum

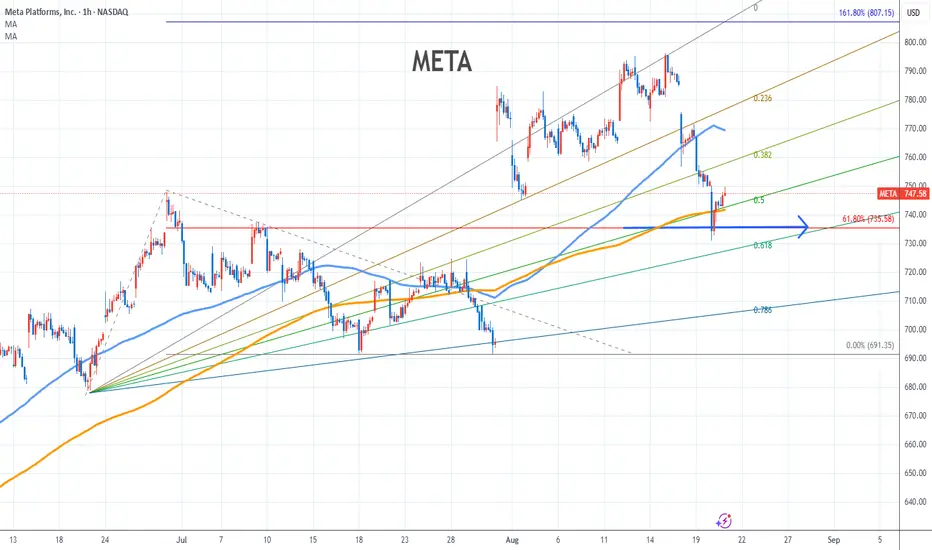
META Stock Chart Fibonacci Analysis 082625Trading Idea
1) Find a FIBO slingshot
2) Check FIBO 61.80% level
3) Entry Point > 736/61.80%
Chart time frame:C
A) 15 min(1W-3M)
B) 1 hr(3M-6M)
C) 4 hr(6M-1year)
D) 1 day(1-3years)
Stock progress:C
A) Keep rising over 61.80% resistance
B) 61.80% resistance
C) 61.80% support
D) Hit the bottom
E)
“Magnificent Seven Face-Off: Who’s Leading — and Who’s Losing — Picture a battleground of tech giants, each vying for supremacy in a year defined by AI, retail mania, and relentless volatility. Here’s how the Magnificent Seven stack up in 2025—with the numbers to prove it:
Performance Recap: YTD Returns (2025)
Meta (META): +18.6% — the surprising standout so f

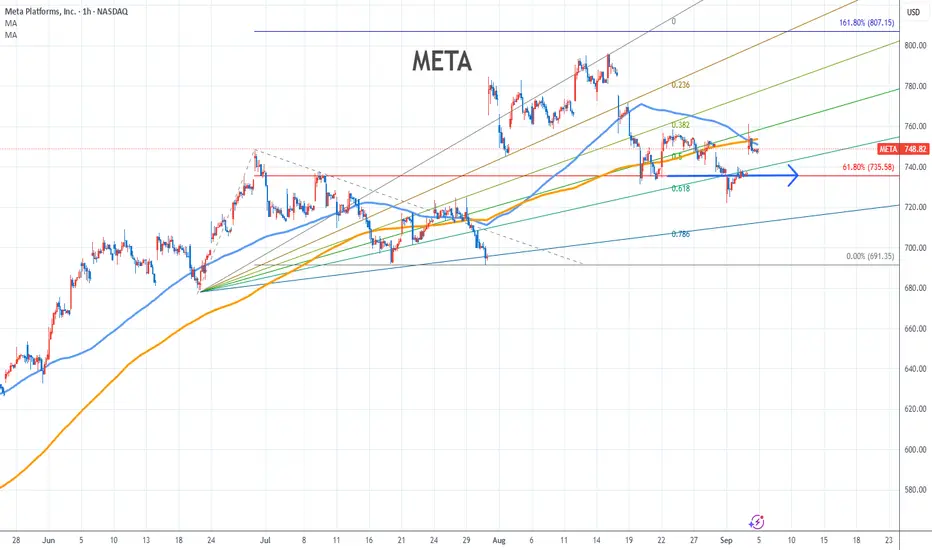
Meta Stock Chart Fibonacci Analysis 090425Trading Idea
1) Find a FIBO slingshot
2) Check FIBO 61.80% level
3) Entry Point > 736/61.80%
Chart time frame:B
A) 15 min(1W-3M)
B) 1 hr(3M-6M)
C) 4 hr(6M-1year)
D) 1 day(1-3years)
Stock progress:A
A) Keep rising over 61.80% resistance
B) 61.80% resistance
C) 61.80% support
D) Hit the bottom
E)
Meta....Which way?The Good
Trend: The longer-term trend is still up. You’ve had a strong run from the April low around ~$570 to the July high near ~$796. That’s nearly a 40% move.
Support Zone: The $740–$750 range looks like near-term support. Today’s close at $750.30 is sitting right on it. If this level holds, it
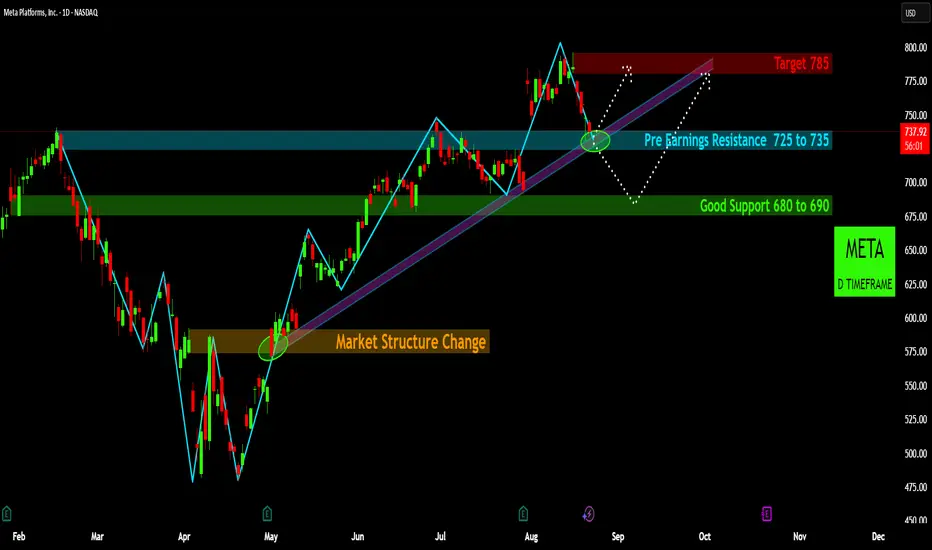
META's Uptrend: What to Watch NextMETA Stock: Key Levels & Potential Trades
Uptrend intact: META has been in a strong uptrend since May, consistently finding support along the green trendline and making higher highs.
Current Level: The stock is currently retraced back to $725 and $735 zone, which was Pre Earnings Resistance
META Stock Chart Fibonacci Analysis 082025Trading Idea
1) Find a FIBO slingshot
2) Check FIBO 61.80% level
3) Entry Point > 735/61.80%
Chart time frame:B
A) 15 min(1W-3M)
B) 1 hr(3M-6M)
C) 4 hr(6M-1year)
D) 1 day(1-3years)
Stock progress:C
A) Keep rising over 61.80% resistance
B) 61.80% resistance
C) 61.80% support
D) Hit the bottom
E)
See all ideas
Summarizing what the indicators are suggesting.
Neutral
SellBuy
Strong sellStrong buy
Strong sellSellNeutralBuyStrong buy
Neutral
SellBuy
Strong sellStrong buy
Strong sellSellNeutralBuyStrong buy
Neutral
SellBuy
Strong sellStrong buy
Strong sellSellNeutralBuyStrong buy
An aggregate view of professional's ratings.
Neutral
SellBuy
Strong sellStrong buy
Strong sellSellNeutralBuyStrong buy
Neutral
SellBuy
Strong sellStrong buy
Strong sellSellNeutralBuyStrong buy
Neutral
SellBuy
Strong sellStrong buy
Strong sellSellNeutralBuyStrong buy
Displays a symbol's price movements over previous years to identify recurring trends.
FB5581187
Meta Platforms, Inc. 4.6% 15-MAY-2028Yield to maturity
—
Maturity date
May 15, 2028
FB5581329
Meta Platforms, Inc. 4.95% 15-MAY-2033Yield to maturity
—
Maturity date
May 15, 2033
FB5509319
Meta Platforms, Inc. 3.5% 15-AUG-2027Yield to maturity
—
Maturity date
Aug 15, 2027
FB5868811
Meta Platforms, Inc. 4.75% 15-AUG-2034Yield to maturity
—
Maturity date
Aug 15, 2034
FB5458293
Meta Platforms, Inc. 4.45% 15-AUG-2052Yield to maturity
—
Maturity date
Aug 15, 2052
FB5458295
Meta Platforms, Inc. 4.65% 15-AUG-2062Yield to maturity
—
Maturity date
Aug 15, 2062
FB5868809
Meta Platforms, Inc. 5.4% 15-AUG-2054Yield to maturity
—
Maturity date
Aug 15, 2054
FB5458291
Meta Platforms, Inc. 3.85% 15-AUG-2032Yield to maturity
—
Maturity date
Aug 15, 2032
FB5868522
Meta Platforms, Inc. 4.3% 15-AUG-2029Yield to maturity
—
Maturity date
Aug 15, 2029
FB5458289
Meta Platforms, Inc. 3.5% 15-AUG-2027Yield to maturity
—
Maturity date
Aug 15, 2027
FB5522214
Meta Platforms, Inc. 4.45% 15-AUG-2052Yield to maturity
—
Maturity date
Aug 15, 2052
See all META80 bonds
Curated watchlists where META80 is featured.

Big software stocks: Red pill gains
9 No. of Symbols


Political stocks: The corridors of power
15 No. of Symbols
See all sparks