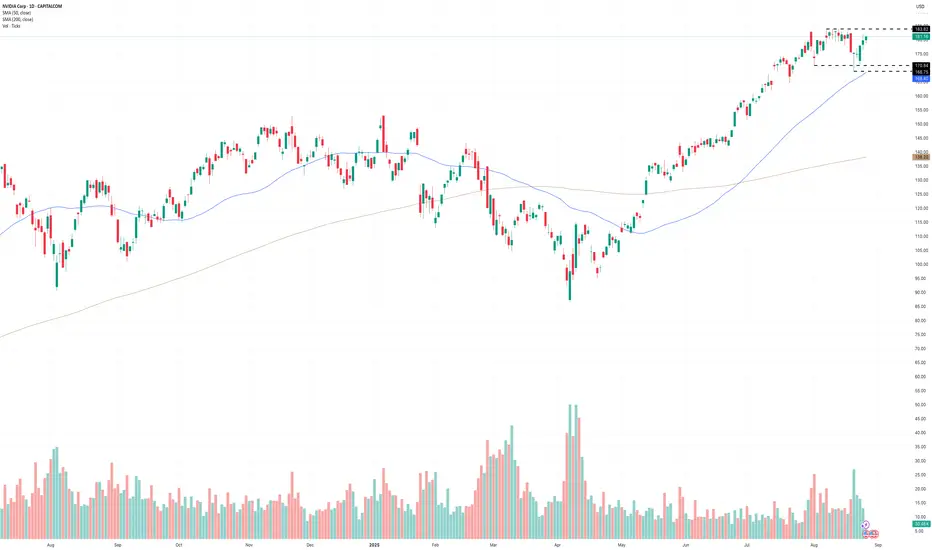
$NVDA | The Next Big Leg?NVIDIA has been a textbook case of Smart Money structure this cycle.
✅ Break of Structure (BOS) confirmed
✅ Trendline + MA confluence support at ~$177
✅ Strong premium zone rejection near $195
✅ Fibonacci extension eyeing $231.80
🔑 Levels to Watch:
$177 = Key support (trendline + MA)
$195 = Resistance zone (premium supply)
$231 = Next target if bullish momentum continues
💡 Game Plan:
Above $177 = Long bias toward $195 → $231
Break below $177 = Retrace toward $153 equilibrium
⚡️ Tech + AI flows remain strong; NVDA could be gearing up for another explosive move.
📢 Question to the community:
👉 Do you think NASDAQ:NVDA pushes through $195 straight to $231, or do we retest $153 first?
#NVDA #TradingView #Stocks #Fibonacci #SmartMoneyConcepts #AI #Bullish
NVDA01 trade ideas

NVIDIA Has Some Reversal SignsNVDA has formed a double top and stochastic oscillator divergance on the dailyt chart. ON the monthly chart it has a it has formed a shooting star candle.
Good luck for all of you
Markets Titan

NVDA TRADE AFTER LONG WEEKENDI am looking at NVDA and took Call option expiring sep 5, strike price $170 @$3.40.

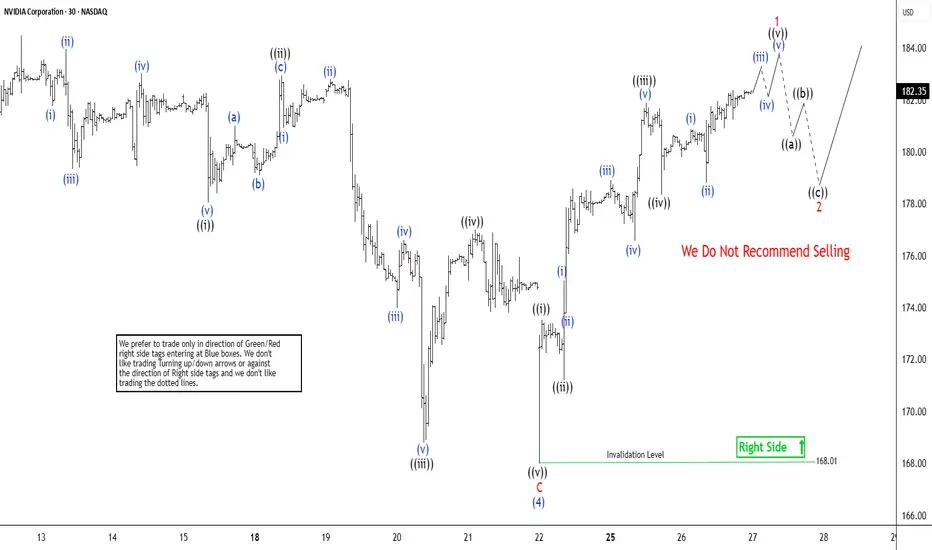
Nvidia (NVDA) Targets 189+ in Wave 5 CompletionNvidia (NVDA) aims to advance in wave (5), targeting $189 or higher. The rally to $185.22 completed wave (3). A pullback in wave (4) formed a zigzag Elliott Wave pattern. From wave (3), wave A dropped to $170.89. Wave B peaked at $184.48, and wave C fell to $168.01, showing an impulsive structure on the 30-minute chart below.
The stock has since turned upward. It must break above $185.22, the wave (3) high, to confirm no double correction. The rally from wave (4) unfolds as a five-wave impulse, supporting a bullish bias. From the wave (4) low, wave ((i)) reached $173.53. Wave ((ii)) dipped to $171.11. The stock then climbed in wave ((iii)) to $181.91. A brief wave ((iv)) pullback ended at $178.35. Nvidia nears completion of wave ((v)), finalizing wave 1 in a higher degree.
A wave 2 pullback should follow, correcting the cycle from the August 22 low. The stock will likely resume its climb afterward. As long as the $168.01 pivot holds, pullbacks should attract buyers in a 3, 7, or 11 swing, paving the way for further upside. This setup keeps Nvidia’s bullish momentum intact, provided the key support level remains unbroken.
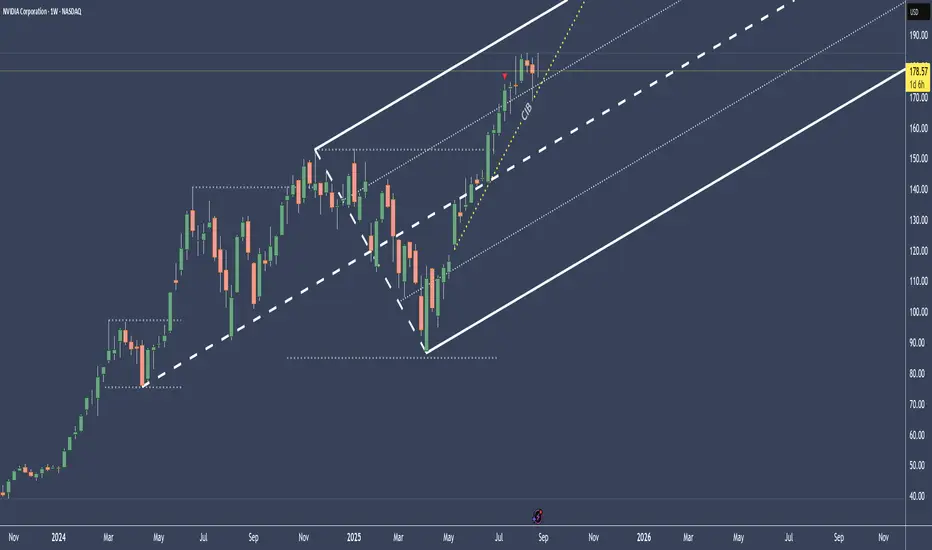
Nvidia - The rally is still not over!🔌Nvidia ( NASDAQ:NVDA ) still heads much higher:
🔎Analysis summary:
For the past decade, Nvidia has perfectly been respecting a major bullish rising channel formation. Currently, Nvidia is still far away from the upper red resistance trendline, which indicates another potential move higher. Just understand that the trend is your closest friend.
📝Levels to watch:
$200
SwingTraderPhil
SwingTrading.Simplified. | Investing.Simplified. | #LONGTERMVISION

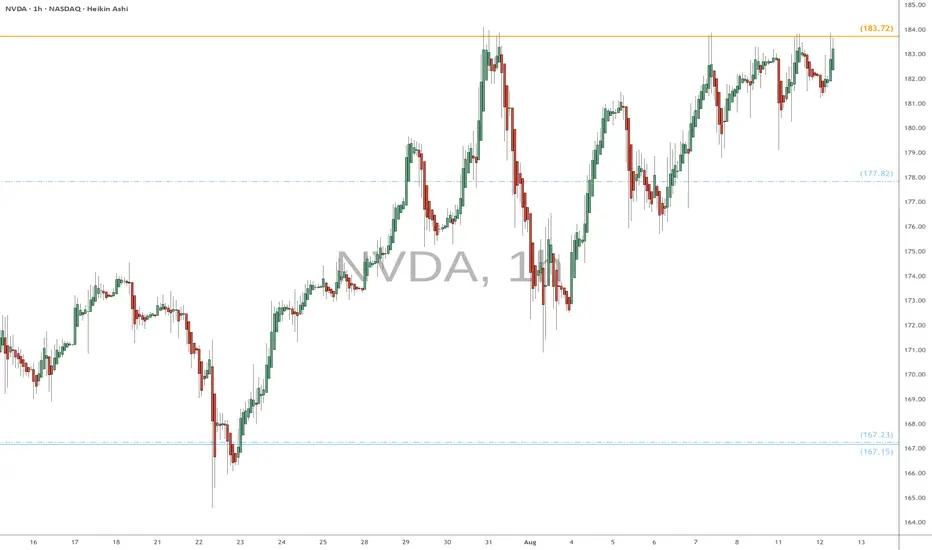
NVDA eyes on $183.72 again: Golden Genesis Fib about to Break? NVDA looks ready for a break out to new highs.
Beating against the Golden Genesis at $183.72
Looking for a Break-n-Run, maybe no retest even.
$195.01 is first target and should be quick.
$201.51 is next target maybe after a dip.
$177.82 is high support for bulls to hold.
.
Previous analysis that gave EXACT Shorts from this Fib:
Hit BOOST and FOLLOW for more such PRECISE and TIMELY charts.
=========================================================
.
NVDA - Watch the show, until the Sh** hits the FanThe expected “end of hype” around Nvidia stems from its current inability to forecast H20 chip sales to China, forced production halts, and growing political friction—despite its strong financial performance elsewhere.
The tension between U.S. export policy and China’s technological self-reliance is creating real operational and strategic obstacles for Nvidia.
In this weekly chart we still have an upward projection.
Nonetheless do we all know what a Game NVDA is playing by selling to its one companies.
The air is thin, very thin up there.
And after the Earnings Report we all know how the books are pimped.
A breach of the CIB line would make me go "hmmm....", and starting to look for a short.
Until then, just relax and watch the show.
Nvidia Is Up 100%+ Since April. What Does Its Chart Say?Perhaps the most important single earnings release of this earnings season is on deck. AI-friendly chipmaker Nvidia NASDAQ:NVDA will report earnings this week at a time when many of the artificial-intelligence trade's darlings have come off of their highest valuations. What does NVDA's technical and fundamental analysis say ahead of the report?
Let's take a look:
Nvidia's Fundamental Analysis
What timing! NVDA will unveil fiscal Q2 earnings on Wednesday after the bell in what could be the market's next big thing following AI stocks' recent pullback and Federal Reserve Chairman Jerome Powell's key Jackson Hole speech.
Nvidia also recently got the go ahead from the US government to resume exports of certain products to China, and its stock has risen more than 100% since hitting an $86.62 52-week intraday low on April 7.
As I write this, analysts expect NVDA to report $1.01 of adjusted earnings per share on about $45.3 billion of revenue.
That would be good for about 53% year-over-year growth from fiscal Q2 2025's $30 billion in revenue, as well as a 48.5% increase from the firm's $0.68 in adjusted EPS in the same period last year.
Now, many investors would view 53% year-over-year sales growth as enormous for most companies, but that would actually represent a deceleration of y/y growth for Nvidia.
That said, the "law of large numbers" argues that the pace at which Nvidia has been increasing year-over-year sales since the surge in AI-based capital-expenditure spending began in earnest is unsustainable.
Still, some on Wall Street expect NVDA to stabilize sales growth in the low 50%-ish range for at least a few quarters.
A number of very highly rated sell-side analysts have also increased their price targets for Nvidia heading into this week's earnings report.
Cantor Fitzgerald's CJ Muse, Joseph Moore of Morgan Stanley, TD Cowen's Joshua Buchalter and John Vinh of KeyBanc have all upped their NVDA target prices in just the past few days. TipRanks rates every one of those four at either four or five stars out of a possible five.
The group increased their price targets from an average of $191.25 to an average of $224 vs. the $179.81 that Nvidia closed at on Monday.
Nvidia's Technical Analysis
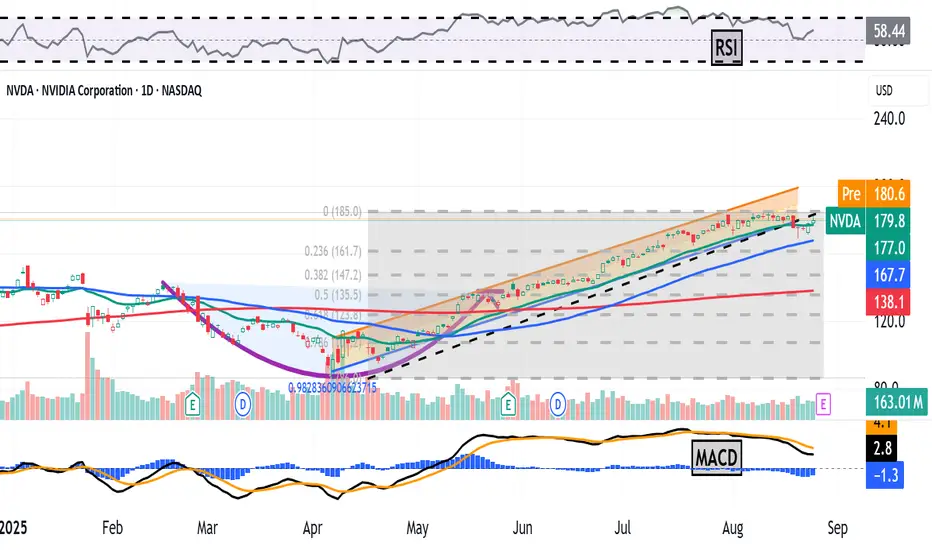
Now let's look at NVDA's year-to-date chart as of Aug. 20:
We have a very complex chart to take in here.
Readers will first note that a "cup-with-handle" pattern (the purple curving line at the chart's center) kicked off Nvidia's April-into-August rally.
However, the stock's trend -- illustrated here by a Raff Regression model marked with orange shading -- has been broken to the downside as Nvidia approaches earnings.
NVDA also appears to have tested the swing crowd at the stock's 21-day Exponential Moving Average (or "EMA," marked with a green line) and lost that fight.
Next up would be the stock's 50-day Simple Moving Average, or "SMA," denoted by the blue line above. It will be very interesting to see if institutional money defends the stock at that level.
Keep in mind that key Fibonacci retracement levels also exist at roughly $162 (23.6% retracement) and $147 (38.2% retracement), as denoted by the gray shaded area above.
The stock's 50-day SMA is the downside pivot that could pave the way to the stock's even more important 200-day SMA (the red line above at $137.40).
Meanwhile, Nvidia's upside pivot would be the stock's recent high near $184. A retake of that level in response to a well-received earnings report could make the above analysts' new target prices suddenly seem very realistic.
As for the other technical indicators in the above chart, they're not looking very pretty.
Nvidia's Relative Strength Index (the gray line at the chart's top) is sinking like a rock and is trying to hold at a neutral reading.
And check out the stock's daily Moving Average Convergence Divergence indicator (or "MACD," marked with black and gold lines and blue bars at the chart's bottom).
The histogram of the 9-day EMA (marked with blue bars) is suddenly deeply negative. That's usually a short-term bearish signal.
The 12-day EMA (the black line) has also crossed below the 26-day EMA (the gold line). That's also typically a negative signal -- but with both lines still in positive territory, it's not quite as foreboding.
(Moomoo Technologies Inc. Markets Commentator Stephen “Sarge” Guilfoyle was long NVDA at the time of writing this column.)
This article discusses technical analysis, other approaches, including fundamental analysis, may offer very different views. The examples provided are for illustrative purposes only and are not intended to be reflective of the results you can expect to achieve. Specific security charts used are for illustrative purposes only and are not a recommendation, offer to sell, or a solicitation of an offer to buy any security. Past investment performance does not indicate or guarantee future success. Returns will vary, and all investments carry risks, including loss of principal. This content is also not a research report and is not intended to serve as the basis for any investment decision. The information contained in this article does not purport to be a complete description of the securities, markets, or developments referred to in this material.
Moomoo and its affiliates make no representation or warranty as to the article's adequacy, completeness, accuracy or timeliness for any particular purpose of the above content. Furthermore, there is no guarantee that any statements, estimates, price targets, opinions or forecasts provided herein will prove to be correct.
The Analyst Ratings feature comes from TipRanks, an independent third party. The accuracy, completeness, or reliability cannot be guaranteed and should not be relied upon as a primary basis for any investment decision. The target prices are intended for informational purposes only, not recommendations, and are also not guarantees of future results.
Moomoo is a financial information and trading app offered by Moomoo Technologies Inc. In the U.S., investment products and services on Moomoo are offered by Moomoo Financial Inc., Member FINRA/SIPC.
TradingView is an independent third party not affiliated with Moomoo Financial Inc., Moomoo Technologies Inc., or its affiliates. Moomoo Financial Inc. and its affiliates do not endorse, represent or warrant the completeness and accuracy of the data and information available on the TradingView platform and are not responsible for any services provided by the third-party platform.
Getting Support and Resistance Levels using optionsI describe a creative method to use external options data to then plot support and resistance levels directly on the chart. Up to 30 tickers supported at once and updates as frequently as you want.

NVDIA SHORT TRADING PLANSWhy:
Weekly Divergence
Field BOS in 4H
Focus on Daily
My Entry is only discounted Price : FIB Values
if you want to enter you can entry after the BOS and SL will be the

I believe NVDIA will...I think NVIDIA is in a consolidation phase and we may see a pull back into the liquidity zone before its next run and I believe that this is a buying opportunity, to see let profits run. According to the Fibonacci retracement tool that we are using it was going to have a pullback. The way in which it is set up in a way where I am able to tell. It you look at my recent bitcoin publication you would see how it works. It's able to essentially tell you if the asset is going to be bearish or bullish based on its pull backs. Now I am always one for fundamental and I am still experimenting with this strategy. So, I guess we will see.
ALWAYS REMEMBER THIS IS NOT FINANCIAL ADVICE. I PRAY THAT YOU (THE READER) RECIEVE YOUR BLESSING WITH THIS TRADE.

NVDA Range BoundMonth of August Range Bound
After market since Earnings...holding previous support/resistance level $172.

Nvidia Earnings Preview: The Guidance GauntletNvidia reports after the bell on Wednesday, and once again the market is treating it less like an earnings call and more like a policy event. At a $4.4 trillion valuation and with eight straight beat-and-raise quarters behind it, expectations are sky high. The numbers themselves are unlikely to surprise. What really matters is how management handles guidance on China, Blackwell shipments, and the durability of AI demand.
Numbers Matter, Guidance Matters More
Consensus sits around $48 billion in revenue and $1.02 earnings-per-share (EPS), implying year-on-year growth above 50%. Those are extraordinary figures for a mega-cap, but the bar has been set by Nvidia itself. The market already expect another blockbuster quarter, which is why the stock has gained nearly 25% this year.
Guidance is where the tension lies. China remains the key swing factor after months of shifting regulation. Licensing restrictions on H20 chips forced Nvidia into a $4.5 billion charge earlier this year, and the new 15% revenue skim on exports has made the picture even messier. Most analysts expect management to keep guidance conservative, excluding China for now while pointing to compliant new products such as the rumoured B30. A lack of clarity here could rattle confidence.
Beyond China, hyperscaler demand is the second focal point. Around 90% of Nvidia’s sales now come from data centres, leaving the company reliant on just a handful of customers. With Microsoft, Google, Amazon and Meta collectively spending over $300 billion on capex this year, the opportunity is huge, but even small shifts in timing could dent results. Concentration risk at this scale is something the Street won’t ignore.
The Blackwell ramp rounds out the story. Nvidia needs to prove that hype has turned into hardware. Investors want detail on system-level shipments, lead times, and throughput for NVL72 racks. If management can show that execution is running smoothly while margins hold steady in the low 70s, belief in Nvidia’s ability to sustain its dominance will strengthen. If not, even a strong top line could be overshadowed by doubts about delivery.
Range in Focus
Nvidia’s relentless uptrend has paused in recent weeks, with prices consolidating sideways. This mean reversion has pulled the stock back toward its rising 50-day moving average. The short-term support and resistance levels created by the consolidation are now strategically significant.
A decisive break and close above the range could trigger the next leg higher, giving traders a clean breakout setup. Conversely, an earnings disappointment could see price break lower, with downside targets toward the confluent support zone formed by the 200-day moving average and VWAP anchored to the April lows. The range also offers clear stop placement: in the case of a bullish breakout, stops can be placed back within the range below broken resistance, while a bearish breakdown setup would favour stops just above broken support.
NVDA Daily Candle Chart
Past performance is not a reliable indicator of future results
Disclaimer: This is for information and learning purposes only. The information provided does not constitute investment advice nor take into account the individual financial circumstances or objectives of any investor. Any information that may be provided relating to past performance is not a reliable indicator of future results or performance. Social media channels are not relevant for UK residents.
Spread bets and CFDs are complex instruments and come with a high risk of losing money rapidly due to leverage. 85.24% of retail investor accounts lose money when trading spread bets and CFDs with this provider. You should consider whether you understand how spread bets and CFDs work and whether you can afford to take the high risk of losing your money.
NVDA – Decision Week Ahead $200 or $140?NVIDIA (NVDA) has been on an incredible bull run, climbing from $140 to nearly $180+ in just 2–3 months. Now, with earnings coming this week, the market is at a decision point: Will the AI leader extend its rally toward $200 🚀, or will profit-taking and cautious guidance send it back toward $150 📉?
🟢 Bullish Scenario
Entry points: 170→165→160
Targets: $185 → $190 → $200+
Lose $170? I’ll wait patiently for $150–140 before sizing back in.
🔴 Bearish Scenario – Pullback to $150–140
If earnings disappoint or guidance weakens (China restrictions, slowing demand), NVDA could unwind toward prior support.
Entry Points (for long re-entry after correction):
$160
$150
$140
Targets on recovery: $160 → $175 → $190
📌 Disclaimer: This post reflects my personal trading plan, not financial advice. Always do your own research and use proper risk management.
Nvda volume spike at top?Bearish argument:
Volume spike at the top on the daily
No daily reversal seen as of Monday Sept 1st
Daily bearish divergence
Monthly indecision candle
TP: Last week's low
Daily RSI 30
Daily bullish divergence
160 gap
Last year's high
Bullish arguments:
High volume on Friday's dump on QQQ
Need to monitor for QQQ daily reversal
Conclusion: Probable chance of continued dump on NVDA.
Most likely price target is NVDA or when QQQ reaches last week's low as it coincides with a previous high volume spike level.

1ST TARGET PROFITIT hit the 1st target profit. I have exited partially wait until it reaches 2nd highest of the day.

$NVDA big move comingWatching NASDAQ:NVDA close the month with a long legged Doji at the top is leading me to believe that some bigger news will be coming out to drop the stock to the downside. I would expect a nice discount coming for potential longer term entry.
Potentially something like China is rejecting their chips or an international market rejection or lawsuit to come into play.

NVDA - Critical Point right now! Back to 150 OR we make new high📊 NVDA – Multi-Timeframe Outlook
🔎 Monthly (1M)
Strong bullish structure with clear Elliott Wave progression (1)-(3) unfolding.
Current candle shows retracement after a parabolic push, but higher timeframe structure remains intact.
Target level stands at 200 USD, aligning with Wave (3) completion zone.
🕰 Weekly (1W)
NVDA completed Wave (3) near 184, now pulling back into a local support zone ~160 – 165.
Structure suggests a corrective Wave (4) before potential continuation higher.
As long as support holds, expectation remains for a Wave (5) push towards 200+.
⏱ Daily (1D)
Price coiling inside a corrective a-b-c structure under trendline resistance.
Demand/support zone ~170 – 172 is acting as the base.
Break above 184 resistance confirms bullish continuation, while loss of support opens risk towards 152 (deeper retrace).
⏳ 8H
Clear retracement into demand after Wave (3) high.
Price holding trendline support + demand confluence.
If buyers step in, expect a rally into Wave (5) targeting 190 – 200.
Breakdown of demand would shift momentum bearish short-term.
🎯 Trade Plan
Bias: Bullish continuation (Wave 5 setup)
Entry Zone: 170 – 175 (demand/support)
Targets: 184 (short-term), 200 (medium-term)
Invalidation: Break & close below 160 support
NVDA option trade in 0 day expirationI bought a PUT option around 9:36 a.m when it was sitting at $1 and sell off my position at $2. Even though it went up to $2.50 but I played safe.

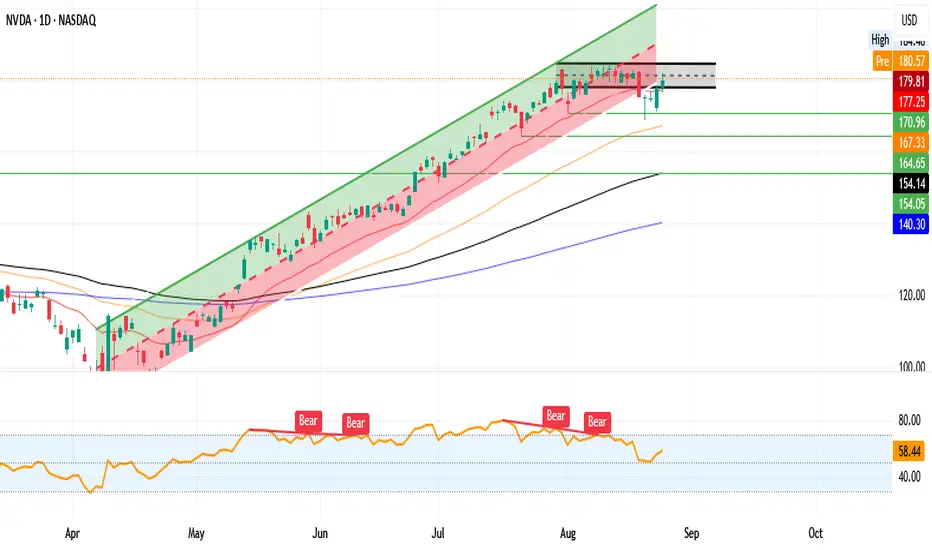
NVDA Daily Chart NVIDIA NASDAQ:NVDA continues to respect its long-term ascending channel (green zone), with price currently trading at $179.81 (+1.02%). After the recent pullback toward the mid-channel, buyers stepped back in, defending key moving averages and reclaiming short-term momentum.
- Support Levels
$177.25 (recent breakout zone, now first line of support)
$170.96 (gap-fill + mid-channel support)
$167.33 (critical higher-low level)
Below this, $164.65 and $154.14 are major swing supports.
- Resistance Levels:
$180.51 (near-term resistance; previous high rejection area)
Break and hold above $181.91 could open the path toward $188–$190.
- Momentum (RSI 58.44):
RSI has cooled off from overbought conditions in July.
Currently trending higher but not yet extended, leaving room for continuation.
*Bullish Scenario: A daily close above $181.91 would confirm breakout continuation, targeting $188–$190 near channel resistance.
*Bearish Scenario: Failure to hold $177.25 risks a pullback toward $171–167, where trend support and buyers are likely to step in.
Disclaimer: I am not a financial advisor. The information shared here is for educational and informational purposes only and should not be considered financial advice. Always do your own research and consult with a licensed financial professional before making investment decisions.
NVIDIA shows signs of a potential breakout.If NVIDIA breaks above $180, we should analyze the candlesticks at $183 and prepare for a move toward $190.

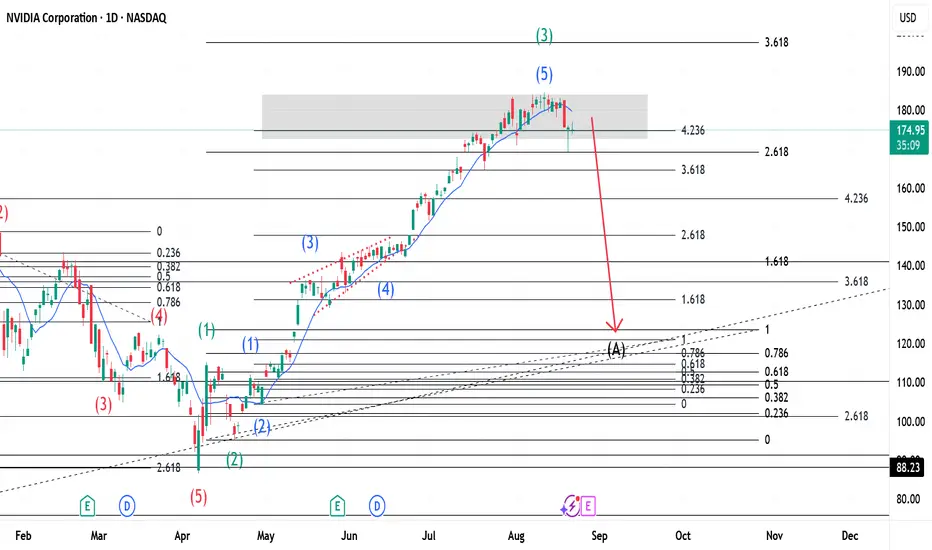
$NVDA and the Elliott Wave Theory(Updates)This is an update of a previous publication(link below). With price above the 423% Fib. level, this means that there is overbuying. Using Elliott Wave Theory we can see that Wave 3(Green) is complete with 5 waves(shown in Blue) inside it. What should follow from this is a Flat correction for Wave 4(Green) because Wave 2(Green) was a Zigzag. The Red arrow shows price direction only and points to a Wave A(Black) as our first wave for the Zigzag. This arrow does not show precise price ending rather shows direction. For more on the same, go to:
NVDA Wave Analysis – 25 August 2025- NVDA reversed from the support area
- Likely to rise to resistance level 183.45
NVDA recently reversed with the daily Hammer from the support area between the pivotal support level 170.00, lower daily Bollinger Band and the support trendline of the daily Up Channel from May.
This support area was strengthened by the 50% Fibonacci correction of the previous sharp upward impulse from the start of July.
Given the strong daily uptrend, NVDA can be expected rise to the next resistance level 183.45 (which stopped the earlier impulse wave i).
