Past Resistance = Future Support: SPX500 and Others UpdateIt is August 21, 2025. I have entitled this video, Past Resistance = Future Support. As I purchased many stocks from the yearly lows of 2025, I anticipate, from a probabilistic perspective, that this new retracement will not last, but alas! It shall be a 3% to 5% pullback.
I investigate, from a technical perspective, the chart built on the principles and experience I have gained over the years of watching the markets: from the smallest (general) timeframes to the biggest.
Stocks have been pent up for months, coiling, building up weekly pressure. It is time to grow. Time to invest. Time to be patient over the course of one or two quarters.
Expectation:
A Halloween or Thanksgiving rally. Targets will be hit by December 2025 to January 2026.
NVDA01 trade ideas

NVDA at a Pivotal Spot – Aug 21NVDA at a Pivotal Spot – Reversal or Just a Dead Cat Bounce? 🚨
Technical Analysis (1H Chart)
NVDA sold off hard from the $182.5 zone, breaking structure and sliding toward $170 before bouncing. Current price is hovering near $175–176, right under a descending trendline.
* Resistance Levels:
* $178.0 → First key rejection point (previous supply & resistance line).
* $182.5 → Strong supply zone, coincides with prior range high.
* Support Levels:
* $172.5 → Short-term demand from recent bounce.
* $170.0 → Stronger base support; breakdown risks deeper selloff.
* Indicators:
* MACD is turning bullish with histogram rising, suggesting short-term momentum favoring upside.
* Stoch RSI is overbought, which warns of a possible pullback after this bounce.
* Trendline still points downward; NVDA must reclaim $178–182.5 to flip bullish.
⚡ Intraday Bias: Cautious bullish momentum but still within a bearish macro structure. $178–182.5 is the line in the sand.
GEX / Options Sentiment
The options board reinforces the technical zones:
* Upside Gamma Resistance:
* $178.0 → 2nd Call Wall (79%)
* $182.5 → Highest positive NetGEX + Major Call Resistance
* Above $182.5, upside unlocks $187.5 → $190
* Downside Gamma Support:
* $172.5 → 2nd Put Wall (–81%)
* $170.0 → Strongest Put Support (–87%)
* Break below $170 risks fast flush toward $167.5
* Sentiment:
* IVR 20.2 (low → option premiums cheap).
* Options flow leaning slightly bearish with 7.9% Calls, heavy put concentration below $172.
Trading Thoughts & Suggestions
* Bullish Setup: Consider short-dated Calls if NVDA can hold above $175 and break $178 with volume. Target $182.5, then $187.5. Stop under $172.
* Bearish Setup: If rejection comes at $178–182.5, Puts back toward $172.5 and $170 make sense. Strong stop above $183 to manage risk.
Conclusion:
NVDA is at an inflection zone. Short-term bounce looks promising, but unless bulls push through $178–182.5, bears keep control. Watch options walls closely — they align with key technical levels.
Disclaimer: This analysis is for educational purposes only, not financial advice. Always do your own research and manage your risk.

NVIDIA BUY SET UPNVIDIA has broken out of its triangle consolidation, confirming strong upward momentum. Expecting continuation with new higher highs ahead. price target 250

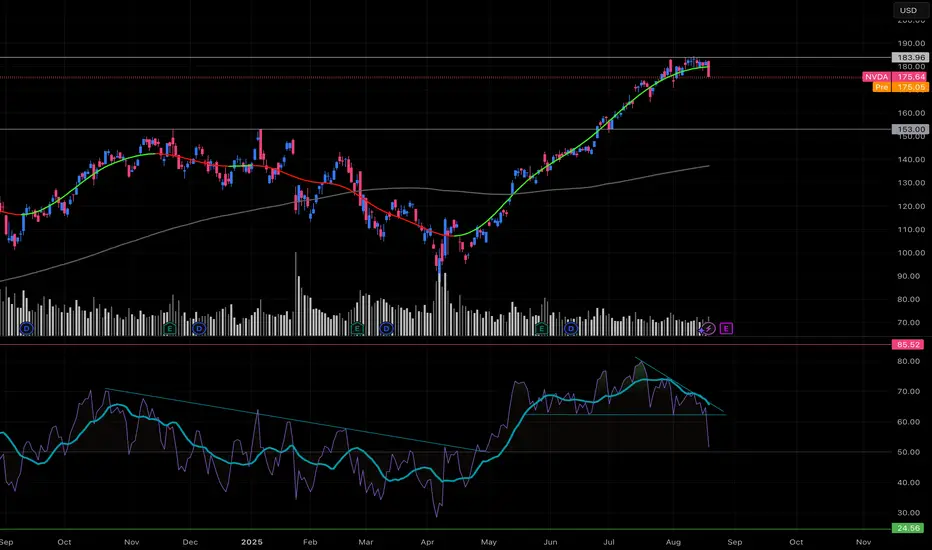
NVDANVDA Weekly:
The price is trading within a well-defined ascending channel, with the upper trendline acting as resistance and the lower trendline as support.
The price recently touched the upper boundary of the channel around $182–$185 and has since slightly retraced.If the price breaks above the $182–$185 resistance (upper channel boundary), we could see accelerated bullish momentum. The next potential target would be based on an extrapolation above the channel or psychological levels such as $200.
The price appears to respect the dashed midline of the channel as a dynamic support/resistance, signifying its importance in price movements.
A previous consolidation zone between $135 and $150 (highlighted by the shaded gray area) now represents a major support area. If the price declines, the stock may test this zone.
If the pullback continues, the $150–$160 range serves as a critical support zone. Breaking below this range might send the stock toward the midline of the channel or the $140 region.

Bullish Pullback Attack – NVIDIA Heist Plan for Escape Loot!🚨💻 NVIDIA (NVDA) Stock Heist Plan 🎭 | Swing & Day Trade Robbery 💰⚡
🌟 Hey Money Makers & Market Robbers! 🌟
Welcome back to the Thief Trading Den where we don’t trade… we steal from the market vaults! 🏦💸
🔥 Asset: NVIDIA (NVDA)
🎭 Heist Type: Swing / Day Trade
🔑 Plan: Bullish Pullback Robbery
🗝️ Entry (Breaking into the Vault)
First lockpick entry above 167.00+ 🔓
Retest & pullback = perfect robbery spot
Thief layering strategy: stack multiple buy limit orders (layered entry like robbers tunneling from multiple sides 🛠️).
Any price level? Yes, thieves adapt—grab loot wherever the window cracks open! 🏃♂️💨
🛑 Stop Loss (Escape Route 🚪)
Official Thief SL: @ 161.00 ⚠️
But dear Thief OG’s, adjust based on your risk appetite, loot bag size & startergy 🎭
Remember, no thief survives without an escape route! 🚁
🎯 Target (The Electric Fence Escape ⚡)
The High Voltage Electric Shock Fence is guarding the treasure @ 196.00 ⚡⚡
Snatch your profits before the fence fries the loot 🔥
Escape fast, spend faster, rob smarter 💸🍾
⚠️ Thief Alert 🚨
The market guards (short sellers) are patrolling heavy—don’t get caught in their traps 🕵️♂️
Use layered limit orders, scale out profits, and keep your SL tight!
A true thief never overstays at the crime scene 👀
💥 Boost this Robbery Plan 💥
Every like & comment powers the Thief Trading Family 🏆
Stay sharp, stay sneaky & let’s rob NVIDIA together! 🤑🎭

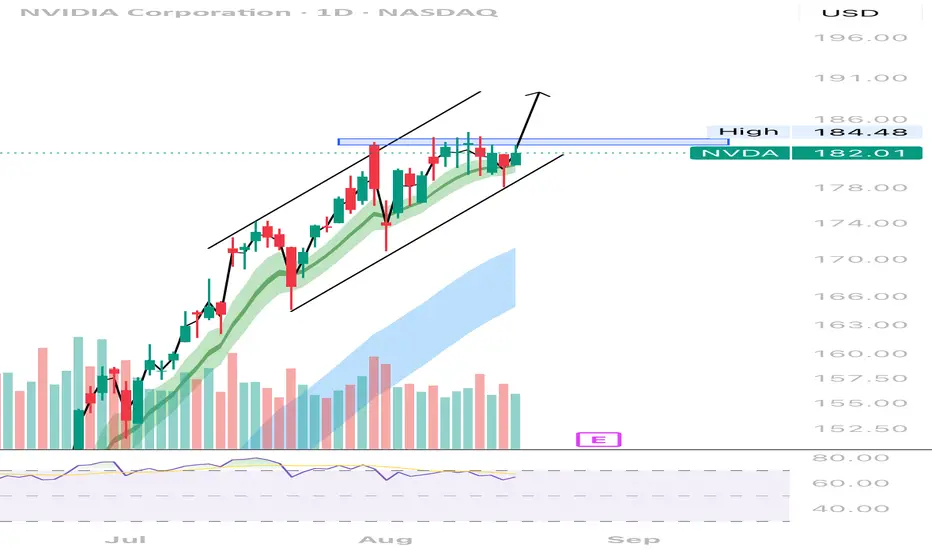
NVDA Ready to Break Out? Targeting $200NVIDIA (NVDA) has been consolidating inside an upward wedge, and the price action is looking primed for a breakout to the upside. Based on this technical setup, I believe NVDA has the potential to push toward the $200 level. 📈
I’ll walk through the chart, key levels to watch, and why this wedge could be the launchpad for NVDA’s next big move.
👉 What do you think—will NVDA break out or fake out? Drop your thoughts below!
#StockMarket #Trading #DayTrading #Investing #TechnicalAnalysis #OptionsTrading #StockTrader #StockTips
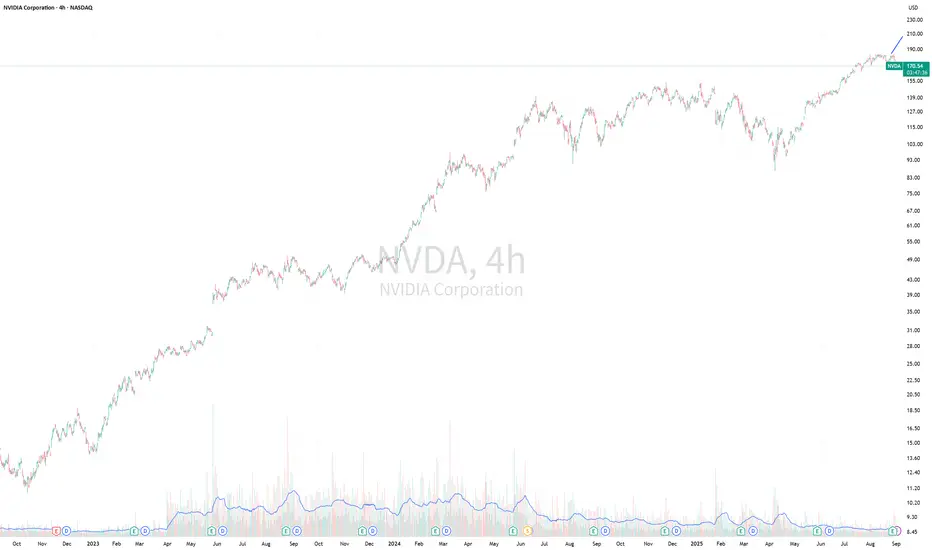
BEARISH CASE: NVDA SHOWING CLASSIC PARABOLIC EXHAUSTION BEARISH CASE: NVDA SHOWING CLASSIC PARABOLIC EXHAUSTION 📉
After an unsustainable 300%+ rally since Q3 2023, NVDA is displaying textbook parabolic blowoff characteristics. Weekly chart shows fractal trend violation with price touching upper resistance for first time since 2023.
4-hour chart reveals rapid breakdown below parabolic SAR support - a key reversal signal after extended uptrends. RSI at weekly overbought levels (70+) for prolonged period, historically precedes significant corrections.
Multiple Fibonacci retracement levels ($110-130) now acting as downside targets, representing 30-40% correction potential from all-time highs.
Institutional rotation away from AI premium already in progress. Extremely elevated valuation metrics combined with technical exhaustion pattern suggests profit-taking accelerating.
The AI narrative has pushed NVDA's market expectations beyond reasonable execution capabilities. Watching for confirmation at $150 support level - a break there opens path to much larger correction.
NASDAQ:NVDA #TechnicalAnalysis #BearishSetup

NVDAEVENTS:
1. Relative highs avoided (from July 30 to August 19)
2. Price swept low of August 1 (8% retrace of ATH)
3. Bullish reaction (wick up) from bullish day & 4hr gap
OBJECTIVE:
To Break all time high (ATH)
HISTORY:
Previously, on April 7 2025, price swept low of August 5 2024 (40% retrace of ATH)
$NVDA Huge Buy FridayThere was a massive NASDAQ:NVDA buy at open Friday of $1.1 Billion. It's been sideways for a while. Could be good for a push.

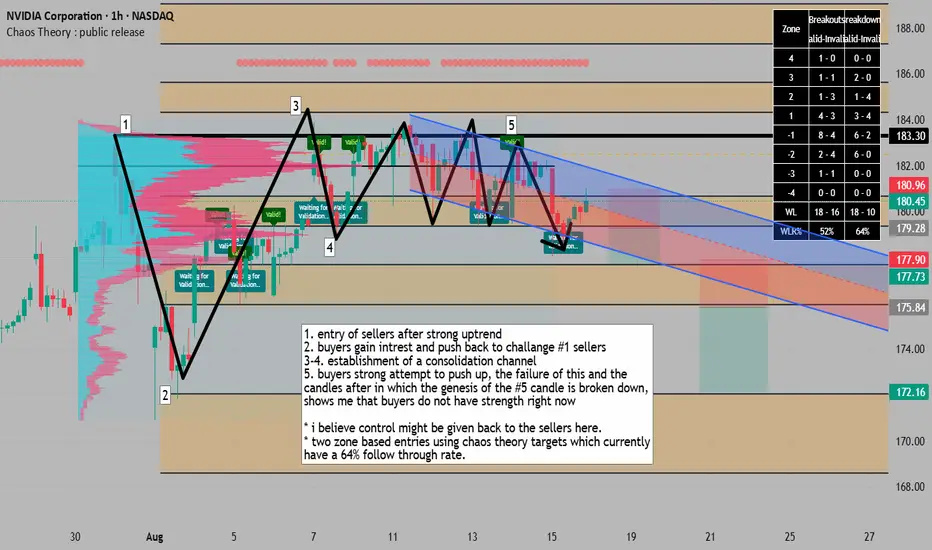
sellers showing signs of exhaustion, potential return to support1. entry of sellers after strong uptrend
2. buyers gain intrest and push back to challange #1 sellers
3-4. establishment of a consolidation channel
5. buyers strong attempt to push up, the failure of this and the
candles after in which the genesis of the #5 candle is broken down,
shows me that buyers do not have strength right now
* i believe control might be given back to the sellers here.
* two zone based entries using chaos theory targets which currently
have a 64% follow through rate.
NVDA short (Daily chart)MVP SYSTEM
this one is fairly obvious.
MOMENTUM- rsi broke from the triangle; sharply lower
VOLUME- not only was the volume light during this last move went upward, now there is a larger volume red engulfing candle
PRICE- as stated, large red candle. price broke below the topping area. and there is a smooth/rounded top here.
the weekly chart had a breakout to the upside; i suspect this move downward to be a pullback to the last support
Nvidia - This is clearly not the end!📐Nvidia ( NASDAQ:NVDA ) will simply rally more:
🔎Analysis summary:
Yes, over the past couple of months, Nvidia has been rallying another +100%. But looking at the higher timeframe, this is still not the end of the unbelievable bullrun. Following the rising channel pattern, Nvidia can rally another +20% before we might see a potential retracement.
📝Levels to watch:
$250
SwingTraderPhil
SwingTrading.Simplified. | Investing.Simplified. | #LONGTERMVISION

NVDA Looking at NVDA on the 1H chart, the broader market structure has been bullish for weeks, consistently printing higher highs and higher lows. That trend began to weaken when a Change of Character (CHoCH) printed at $183.97, as sellers managed to break through a minor higher low. This was later followed by a Break of Structure (BOS) at $173.89, confirming that momentum has shifted bearish in the short term and opening the door for a deeper pullback within the larger bullish context.
The demand zones beneath price show where buyers previously acted decisively. Around $173–$175, buyers stepped in with strength, sending price higher toward $183. A deeper demand base sits around $165–$167, which looks very strong because it was the origin of the rally that established the higher highs earlier in August. On the supply side, the $179–$182 band is strong as sellers rejected price from this level multiple times, producing sharp downward moves.
Inside the marked region, price is currently sliding lower, retracing into nearby demand just above $175. If buyers defend this level, a bounce into the $179–$181 supply is likely. However, should the $173 support give way, sellers could extend control and drive price into the $167–$165 demand area before the next meaningful reaction.
The trade bias right now is short-term bearish, looking for a pullback into demand before a relief bounce. The invalidation level for this view sits at $183; a clean reclaim above that would reestablish bullish continuation and negate the bearish structure shift. Momentum currently favors sellers, as shown by the impulsive downside move, but if a bullish engulfing or rejection wick forms off $175 demand, that would signal buyer strength returning.

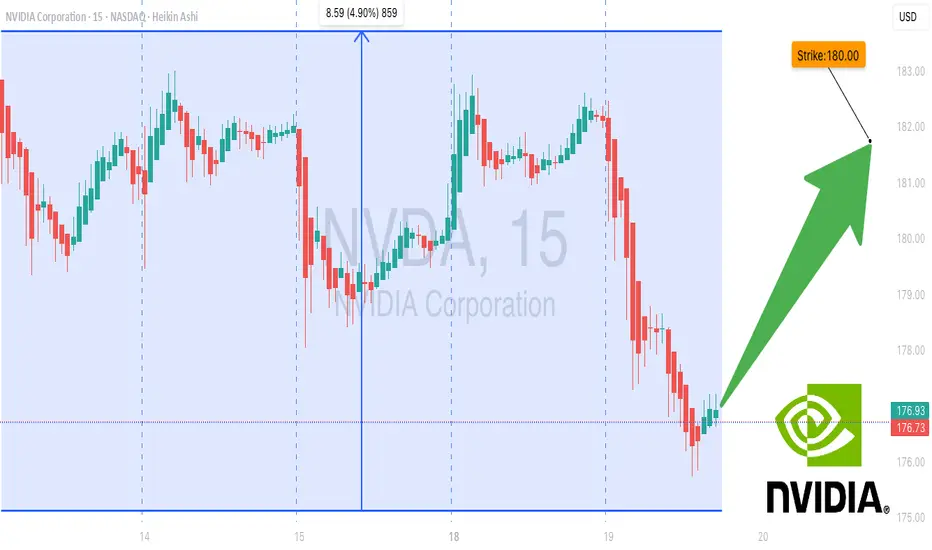
Strong Bullish Flow in NVDA: $180 Calls Primed for Breakout! 🚀 NVDA Weekly Options Bullish Flow – Aug 19, 2025
**Market Sentiment:**
📈 Total calls: **632,689** | Total puts: **334,721**
💥 **Call/Put Ratio: 1.89 → Strong Weekly Bullish Flow**
⚠️ Gamma Risk: Moderate – watch volatility closely.
**Technical Indicators:**
* **Daily RSI:** 63.3 → slight pullback signs
* **Weekly RSI:** 87.2 → 🚀 strong weekly momentum
* **Weekly Volume Ratio:** 0.9x → weak institutional activity, caution advised
**Options Highlights:**
* Key strikes: **\$180** (OI: 65,649), **\$187.50** (liquid and premium-friendly)
* Expiration in **3 days** → time decay accelerating
**Risks to Monitor:**
* Weak weekly volume
* Daily RSI trending down
* Price support at **\$175.90–\$176.00**
**Consensus & Trade Setup:**
* **Overall Bias:** Moderate Bullish
* **Recommended Trade:** **Single-leg Call**
* **Strike:** \$180.00
* **Entry:** \$3.60
* **Stop Loss:** \$1.80
* **Profit Target:** \$6.00–\$7.50 (80%-100% potential)
* **Confidence:** 65%
**Trade JSON Snapshot:**
```json
{
"instrument": "NVDA",
"direction": "call",
"strike": 180.0,
"expiry": "2025-08-22",
"confidence": 0.65,
"profit_target": 6.00,
"stop_loss": 1.80,
"size": 1,
"entry_price": 3.60,
"entry_timing": "open",
"signal_publish_time": "2025-08-19 13:15:57 EDT"
}
NVDA TRADE AFTER LONG WEEKENDI am looking at NVDA and took Call option expiring sep 5, strike price $170 @$3.40.

NVIDIA to $900? That’s what an AI debate tool just told meSo I stumbled on this AI tool named "AI Debate" that analyzes stocks.
At first, I tried Apple and Microsoft — the results were solid, very thorough, but nothing shocking.
Then I plugged in NVIDIA.
And the “AI experts” came back saying that at current levels, there’s still a 4–5x upside. From around $180 to a target above $900.
My jaw dropped. Honestly, it feels unbelievable.
But here’s the thing: I kinda trust this more than random human “gurus” with agendas. At least the AI is pulling fundamentals, technicals, sentiment, and laying it out objectively — no one is pumping their own bags.
Can I try buying some NVDA?
Or can you break down where the AI analysis might be flawed?
Below is the evidence:
Analysis log:
AI Warren Buffett:
NVIDIA is a remarkable company with outstanding profitability and growth—its return on equity is over 115%, net margins exceed 50%, and revenue is growing at a blistering pace. The business is financially sound, with a strong balance sheet and ample free cash flow. If you look at the numbers alone, it’s easy to see why so many investors are excited. However, as I’ve often said, 'Price is what you pay, value is what you get.' At a P/E of 58 and a price-to-book over 50, you’re paying a very steep price for future growth. This is a classic case where the business is excellent, but the stock may be ahead of itself. If growth slows even a little, the stock could face a sharp correction. I generally avoid technology companies outside my circle of competence, but NVIDIA’s dominance in AI chips gives it a real, though possibly temporary, moat. For investors with a high risk tolerance and a long-term horizon, it may be worth a small position, but I would insist on a significant margin of safety. My target price is based on a discounted cash flow approach, assuming continued strong growth but building in a 25% margin of safety. The 12-month target price range is $650 (conservative) to $800 (reasonable), with $900 as an optimistic scenario if growth persists. At current prices, caution is warranted—sometimes the best thing to do is wait for a better pitch.
AI Peter Lynch:
When you look at NVIDIA, you’re staring at a company that’s firing on all cylinders—profitability, growth, and financial health are all top-notch. I mean, a 115% ROE and net margins over 50%? That’s the kind of stuff you dream about as an investor. Revenue is up nearly 70% year-over-year, and earnings are still growing at a healthy clip. The balance sheet is rock solid, with a current ratio of 3.46 and manageable debt. If you’re looking for a company with a great story, just look around: AI, gaming, data centers—NVIDIA’s chips are everywhere, and if my kids are talking about it, you know it’s mainstream. But here’s the rub: the valuation is sky-high. A P/E of 58, P/B over 50, and P/S close to 30? That’s a lot of future growth baked into the price. The PEG ratio is well above 1, so you’re not getting a bargain here. This isn’t the kind of stock you buy for a quick double; you’re betting on NVIDIA becoming even more dominant in the years ahead. The technicals are still bullish, but momentum is cooling off, and the social buzz is pretty quiet—maybe folks are waiting to see if the next earnings report justifies the price. So, is this a ten-bagger from here? Probably not, given the current valuation. But if you’re a growth investor with a strong stomach for volatility, NVIDIA’s fundamentals make it a compelling long-term hold. Just don’t expect a smooth ride, and be ready for some bumps if the market decides the price is too rich. Target Price Logic: With a forward EPS estimate of around $20 and a more reasonable growth-adjusted P/E of 40 (still a premium, but justified by leadership in AI and data centers), the 12-month target price comes to about $800. That’s factoring in continued strong growth, but not assuming another explosive year like the last one. If growth slows or the market re-rates tech stocks, downside risk is real.
AI Cathie Wood:
NVIDIA is the quintessential example of a company at the forefront of disruptive innovation, driving the AI revolution and transforming industries from data centers to autonomous vehicles. Its GPU and AI accelerator technologies are not only powering exponential growth in cloud computing and generative AI, but also expanding the total addressable market (TAM) into trillion-dollar territory as enterprises and governments race to adopt AI infrastructure. The company's fundamentals are outstanding: ROE at 115.5%, net margin at 51.7%, and revenue growth of 69.2% YoY signal a rare combination of profitability and hypergrowth. NVIDIA's R&D intensity and relentless innovation pipeline have created a technological moat that is widening as AI adoption accelerates globally. Over a 5-10 year horizon, we see NVIDIA capturing a disproportionate share of the expanding AI and accelerated computing markets, with potential for TAM expansion as new applications emerge. However, the current valuation is extremely rich (P/E 58, P/S 29.5), reflecting high expectations and introducing volatility risk if growth decelerates. While short-term technicals and muted sentiment suggest caution, the long-term exponential growth trajectory remains intact. Our 12-month target price is derived from a forward EV/Revenue multiple of 30x on projected FY2026 revenues, reflecting continued AI adoption and market leadership, but we emphasize the need for risk management given the premium pricing.
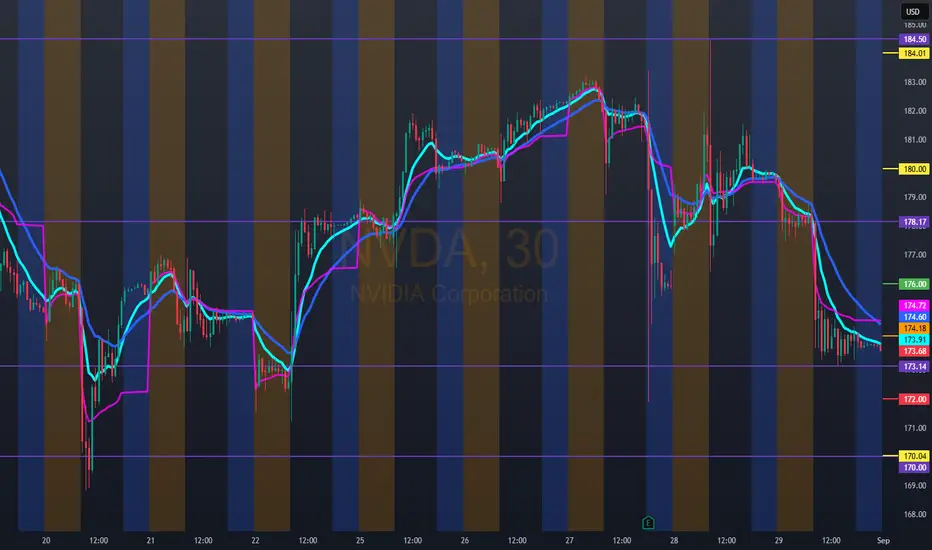
Hello trader, for tomorrow, February 9, 2025.NVDA: Bullish entry at 176.00. Possible profit-taking at 180.00. If there is no rejection at 180.00, for a next bullish entry, we should wait for a breakout of the double top at 184.00, taking a new bullish entry at 186.00.
For the bearish entry: 172.00/170.00. This last one could act as a rebound zone because it would form a double bottom. Use the VWAP indicator for your stops.
$NVDA big move comingWatching NASDAQ:NVDA close the month with a long legged Doji at the top is leading me to believe that some bigger news will be coming out to drop the stock to the downside. I would expect a nice discount coming for potential longer term entry.
Potentially something like China is rejecting their chips or an international market rejection or lawsuit to come into play.

Institutions & Participants in Financial Markets1. Introduction
Financial markets are the backbone of global economies. They provide a platform where individuals, corporations, and governments can raise capital, invest savings, and manage risks. Behind every transaction in the stock market, currency exchange, bond market, or commodity trading, there are participants who make the system function. Some are individuals trading with their own savings, while others are large institutions managing billions of dollars. Together, they form a complex network of buyers, sellers, intermediaries, and regulators who ensure liquidity, stability, and transparency in markets.
Understanding Institutions and Participants is essential because they influence how prices are discovered, how risks are shared, and how capital flows across economies. Without them, financial markets would not function efficiently.
2. Definition of Institutions & Participants
Institutions in financial markets refer to organized bodies that create, regulate, or facilitate market activities. Examples include central banks (RBI, FED), regulators (SEBI, SEC), stock exchanges (NSE, NYSE), clearing houses, and depositories. Their primary role is to ensure smooth functioning, enforce rules, and reduce risks of defaults or fraud.
Participants are entities or individuals that actively take part in financial transactions. This includes retail traders, institutional investors, corporations, governments, and intermediaries like brokers and dealers. They provide liquidity, demand, and supply for financial assets.
Together, institutions and participants form the ecosystem of financial markets, where institutions provide the structure and participants provide the activity.
3. Types of Market Participants
(a) Retail Investors
Retail investors are individual participants who invest their personal savings in stocks, mutual funds, bonds, or derivatives. They usually trade in smaller quantities compared to institutions. Retail participation has grown tremendously with the rise of mobile trading apps, discount brokers, and financial literacy campaigns.
Strengths: Flexibility, diversity of strategies, emotional conviction.
Weaknesses: Limited capital, lack of information compared to institutions, prone to herd behavior.
Example: In India, after 2020, retail investors surged on platforms like Zerodha, Upstox, and Groww, contributing significantly to stock market liquidity.
(b) Institutional Investors
These are large organizations that pool funds from clients or members and invest systematically. They include:
Mutual Funds – Manage pooled capital for retail investors.
Pension Funds – Invest long-term for retirement benefits.
Insurance Companies – Invest premiums in safe and growth-oriented assets.
Hedge Funds & Private Equity – Use complex strategies to maximize returns.
Institutions play a dominant role because of their large capital base and access to advanced research. Their actions often influence market trends and sentiments.
(c) Brokers & Sub-Brokers
Brokers act as intermediaries between investors and the stock exchange. They provide platforms, research, and execution services. Sub-brokers or franchisees work under main brokers to service clients in smaller regions.
In India, SEBI regulates brokers, requiring them to register and follow compliance rules. Discount brokers like Zerodha revolutionized the industry by reducing costs and increasing retail participation.
(d) Market Makers & Dealers
Market makers are institutions or individuals who continuously provide buy and sell quotes for securities, ensuring liquidity in the market. Dealers trade on their own account, taking positions in securities to profit from price movements.
Example: In the Forex market, banks act as market makers by offering two-way quotes (bid and ask prices).
(e) Corporates
Companies participate in markets to raise funds by issuing shares, bonds, or commercial papers. They also engage in hedging using derivatives to manage currency or interest rate risks.
For example, Reliance Industries regularly taps debt markets, while Infosys issues shares under ESOPs.
(f) Governments & Central Banks
Governments raise capital through bonds (sovereign debt) to finance infrastructure, welfare, and development. Central banks regulate money supply, set interest rates, and intervene in foreign exchange markets.
The Federal Reserve (US) sets monetary policy that affects global markets.
The Reserve Bank of India (RBI) manages inflation, rupee stability, and liquidity.
(g) Regulators & Exchanges
Regulators (e.g., SEBI in India, SEC in the USA) create and enforce laws to protect investors and maintain fair markets.
Exchanges (e.g., NSE, NYSE) provide the physical or electronic infrastructure where buyers and sellers meet. They ensure price transparency, equal access, and fair competition.
(h) Foreign Institutional Investors (FIIs) & Foreign Portfolio Investors (FPIs)
Global investors participate in emerging markets like India to seek growth opportunities. They bring in large capital inflows, which can boost stock indices but also increase volatility if they withdraw funds quickly.
Example: In 2020–2021, FPIs invested heavily in Indian equities, leading to record highs in Nifty and Sensex.
4. Institutions in Global & Indian Context
Stock Exchanges
Global: NYSE, NASDAQ, London Stock Exchange.
India: NSE and BSE dominate trading volumes.
Clearing Corporations & Depositories
They reduce settlement risks by ensuring that buyers get their securities and sellers receive payments.
India: NSDL, CDSL.
Global: DTCC (USA), Euroclear (Europe).
Regulators
India: SEBI, RBI, IRDAI.
Global: SEC (USA), FCA (UK), ESMA (Europe).
International Institutions
IMF & World Bank – provide financial stability and funding to nations.
Bank for International Settlements (BIS) – sets banking regulations.
5. How Participants Interact in Markets
Financial markets are divided into:
Primary Market: Where new securities are issued (IPOs, bonds). Corporates and governments raise funds here.
Secondary Market: Where existing securities are traded. Retail and institutional investors interact here.
Price Discovery happens when buyers and sellers agree on prices based on demand and supply. Institutions often lead price discovery, while retail investors follow.
Technology’s Role: Algorithmic trading, high-frequency trading, and fintech platforms have transformed participation. Machines now execute trades in microseconds, increasing liquidity but also creating flash-crash risks.
6. Case Studies & Examples
2008 Financial Crisis: Triggered by reckless lending by banks, misuse of mortgage-backed securities, and regulatory gaps. It showed the danger of unregulated institutions.
Indian Markets Post-2020: Surge in retail investors and rise of discount brokers democratized investing. FIIs also played a strong role in pushing indices to record highs.
7. Challenges & Risks
Conflicts of Interest – Brokers may mis-sell products, institutions may prioritize profits over clients.
Market Manipulation – Pump-and-dump schemes, insider trading, and algorithmic manipulation distort fairness.
Globalization Risks – Capital flight during crises (e.g., FIIs pulling funds).
Regulatory Gaps – Some instruments (like crypto) still lack clear regulations.
8. Future of Institutions & Participants
AI & Algorithmic Trading will dominate markets, with human traders playing a smaller role.
Fintech & Digital Platforms will bring more retail investors into the system.
Global Institutional Flows will decide the fate of emerging markets like India.
Sustainable Finance – ESG-focused investing and green bonds will rise.
9. Conclusion
Institutions and participants together form the lifeline of financial markets. Institutions provide the rules, infrastructure, and trust needed for smooth functioning, while participants provide liquidity, capital, and demand. Their interaction shapes prices, drives innovation, and supports economic growth.
From a small retail trader buying a single stock to a central bank moving billions in currency reserves, each participant plays a vital role in maintaining balance. The future will bring more technology-driven participation, deeper global integration, and stronger institutional oversight.
In essence, the strength of a financial market depends on the quality of its institutions and the diversity of its participants.
NVDA Under Pressure: Sellers Dominate as Volume Spikes Fail NVDA Under Pressure: Sellers Dominate as Volume Spikes Fail to Sustain Price Gains
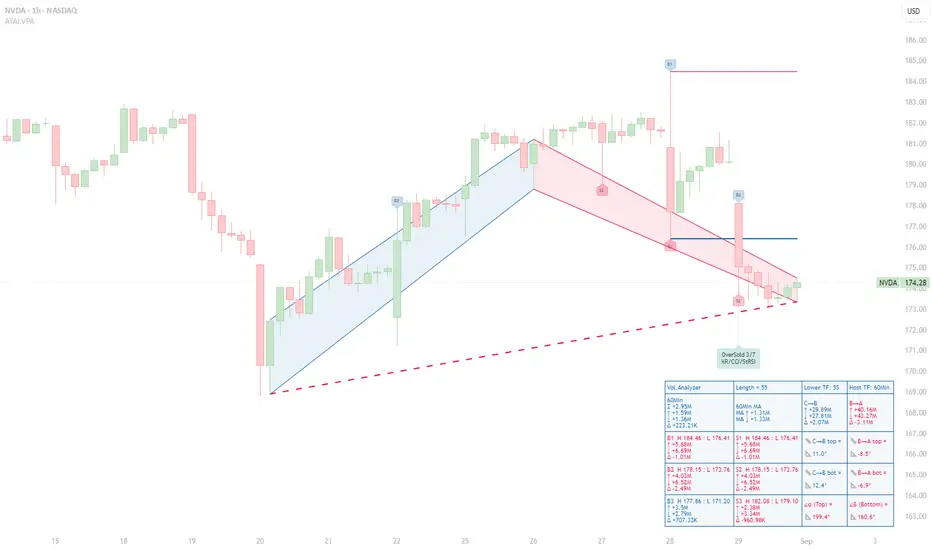
Context – This 60‑minute NVDA chart uses the ATAI Volume Pressure Analyzer (VPA) on a 55‑bar window. The indicator plots an A→B→C structure: the blue C→B segment tracks the preceding advance and the red B→A segment the subsequent pull‑back. Up‑volume and down‑volume are calculated on a lower time frame and then aggregated into host‑time‑frame bars to expose buying and selling pressure.
Volume ranking – Within this window the indicator labels the three largest buying and selling bars (B1–B3 and S1–S3) and reports their statistics in a HUD. The most prominent bar, B1, spans H 184.46 to L 176.41 and shows 5.68 M up‑volume versus 6.69 M down‑volume, producing a –1.01 M delta. B2 (H 178.15–L 173.76) is even more bearish, with 4.03 M up‑volume and 6.52 M down‑volume (delta –2.49 M). B3 (H 177.86–L 171.20) is the only buying bar with a positive delta: 3.50 M up‑volume, 2.79 M down‑volume and a +0.71 M surplus. On the sell side, S1 and S2 coincide with B1 and B2 and mirror their negative deltas. S3 (H 182.08–L 179.10) registers 2.38 M up‑volume against 3.34 M down‑volume for a –0.96 M delta. Collectively, the pattern shows that peaks in buying volume have not yielded higher closes; sellers control all but one of the ranked bars.
Segment behaviour – The C→B rally accumulated roughly 29.89 M up‑volume versus 27.81 M down‑volume, a modest +2.07 M delta. In contrast, the B→A decline logged 40.16 M up‑volume against 43.27 M down‑volume, giving a –3.11 M deficit. The slopes of the trend lines accentuate the story: the advance has gentle positive slopes (~+11° top, +12.4° bottom), whereas the pull‑back slopes downward (–8.5° and –6.9°). Sellers have pushed prices lower more decisively than buyers previously drove them higher.
Price structure and implications – Price currently trades around 174.28 USD. Resistance sits near 178.15 (B2/S2) and 184.46 (B1/S1). As long as price remains beneath these pivot highs and subsequent B‑ranked bars fail to show a positive delta, the selling bias persists. The red dashed guide, connecting recent lows, continues to slope downward, confirming the bearish tilt. Only a flattening or reversal of this guide—coupled with a new B‑ranked bar sporting a positive delta—would hint at a shift in momentum.
Risk management – This analysis is intended for educational purposes. It illustrates how separating up‑ and down‑volume on lower time frames can reveal hidden pressures in intraday charts. It is not a recommendation to buy or sell NVDA stock. Always consult your own trading plan and risk tolerance before acting.
I believe NVDIA will...I think NVIDIA is in a consolidation phase and we may see a pull back into the liquidity zone before its next run and I believe that this is a buying opportunity, to see let profits run. According to the Fibonacci retracement tool that we are using it was going to have a pullback. The way in which it is set up in a way where I am able to tell. It you look at my recent bitcoin publication you would see how it works. It's able to essentially tell you if the asset is going to be bearish or bullish based on its pull backs. Now I am always one for fundamental and I am still experimenting with this strategy. So, I guess we will see.
ALWAYS REMEMBER THIS IS NOT FINANCIAL ADVICE. I PRAY THAT YOU (THE READER) RECIEVE YOUR BLESSING WITH THIS TRADE.

The Many Roads of Your Trading SystemThere are many possible journeys for your account — some lucky, some painful. But why is it that only one of them really matters? Let’s find out.
1. A Glimpse Into the Future (With All Its Paths)
How confident would you feel if your trading plan could show you not just the average outcome you can expect, but also the good, the bad, and even the ugly roads your account might take?
In this blog, we’ve talked about expected value as the trader’s true laser vision: the ability to project the evolution of your account instead of obsessing over the price of a single trade.
Today, we’ll turn that laser forward in time. We’ll see how expectancy becomes real when trades start piling up, and how a couple of simple simulations let us peek into the different futures of a trading system.
2. The Power of Repetition: When the Average Becomes Real
A single trade tells you nothing. It may end in profit, it may end in loss — but in statistical terms, it’s just noise.
Things change once you start repeating trades under a rule-based system. Variance begins to smooth out, and the average result — expectancy — becomes visible.
Think of flipping a coin: if you flip it 5 times, you might get 4 heads and 1 tail. Misleading, right? But flip it 500 times, and the ratio will settle close to 50/50.
Trading works the same way: a system is not judged by one trade but by hundreds or thousands. And here’s where many beginners stumble: they overvalue a single outcome, feeling euphoric after a win or devastated after a loss. That emotional swing is one of the main reasons traders blow up their accounts. But judged in the bigger picture, those single dots are meaningless — what matters is the long-run average.
3. The Trap Visualized
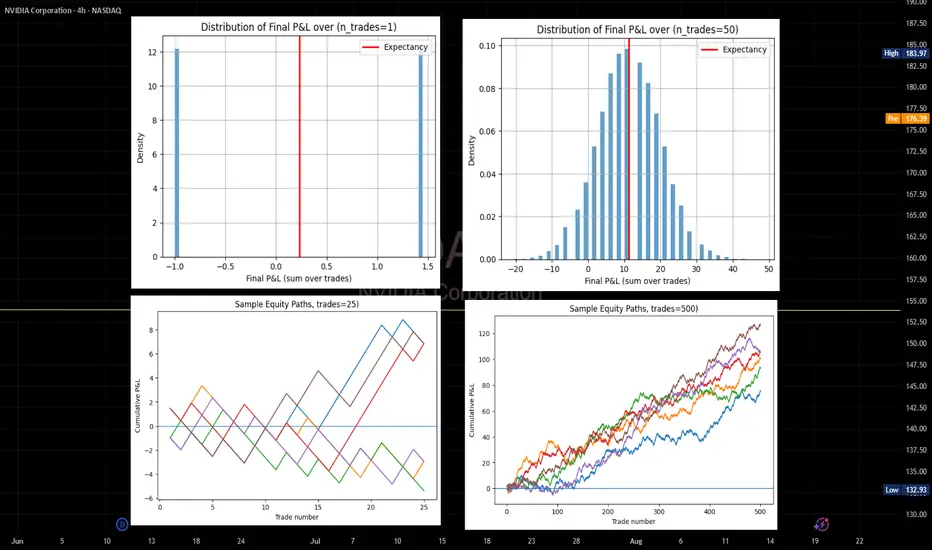
When you look at trades one by one, the picture is chaotic. Some dots are up, some are down, scattered without a clear pattern.
The plot at the top left is exactly what fuels emotional trading. The blue bars are single-trade outcomes — random wins and losses. The red line is expectancy. When you zoom in on just one bar, you’re focusing on noise, whether it’s a big win or a big loss. In reality, that focus is a misleading: a single trade tells you nothing about the true edge of your system.
But when you let your rule-based system play out over time, the story changes. As the top-right plot shows, trades accumulate, those scattered outcomes begin to cluster, and the distribution slowly aligns with the red line. The noise shrinks, the signal emerges, and the expectancy — the true value of your system — takes center stage.
4. From One Trade to Many: The Path of Your Account
Once we shift from a single trade to many trades, the picture changes completely. Instead of scattered dots, we now see full equity paths — different possible journeys of an account following the same rules over time.
The bottom-left plot shows that with just a handful of trades (10 or 20), the paths zigzag wildly. Some end positive, others in losses—here, luck still calls the shots!
The bottom-right plot shows that with hundreds of trades (200, 500, or more), the paths converge around the system’s true average. Luck fades away, and expectancy takes the lead.
5. Expectancy = Realistic Confidence
Together, these lessons are powerful:
A single trade means nothing — it’s just random variance.
Many trades reveal the true destiny of the system — expectancy gradually asserts itself.
This isn’t about promising that losses won’t happen. It’s about accepting that your account’s future is always a range of possible scenarios. The key fact is this: if your system has positive expectancy, mathematics is on your side — but only if you give it enough repetitions for the signal to rise above the noise.
So let me ask you: do you know the expectancy of your system? If you don’t, then trading without it isn’t just risky — it’s irresponsible.
6. Conclusion and What’s Next
So here’s the takeaway:
Expectancy is your compass.
Monte Carlo simulations are the flashlight showing you the different roads that compass might lead you down.
The future of your trading isn’t a black box. It’s a set of possible paths you can explore, measure, and prepare for.
In the next post, we’ll focus on the engine that makes expectancy work in real life: risk management. Because even with a winning system, if you risk too much on each trade, variance can knock you out of the game before expectancy has a chance to do its job.
For Readers Interested in Quantitative Trading
I have prepared a Python repository to accompany this post. You can find it on GitHub by searching for the repository name "How To Lambo." Inside, you’ll find the notebook probabilistic_trading.ipynb, which lets you experiment hands-on with the probabilistic trading concepts discussed here. Think of it as opening the hood of the car and seeing how the engine actually works.
To recreate the plots from this post:
Run monte_carlo_pnl to visualize the dispersion of single-trade outcomes. You’ll see clearly that no single result reflects the true expectancy of the system — it’s all variance.
Run plot_equity_paths with different values of n_trades. At 50 trades, the equity curves look like a jungle of chaotic, diverging paths. At 500 trades, they transform into something resembling a highway of parallel lanes — stable, predictable, and clustered around the system’s mean.
And that’s just the beginning. The notebook follows a clear conceptual line, guiding you interactively through the logic of probabilistic trading. It’s an open invitation to explore, test, and see for yourself the power of expectancy in action.
NVIDIA (NVDA): Fueling Up for Fresh Highs!NVIDIA (NVDA): Fueling Up for Fresh Highs! 🚀
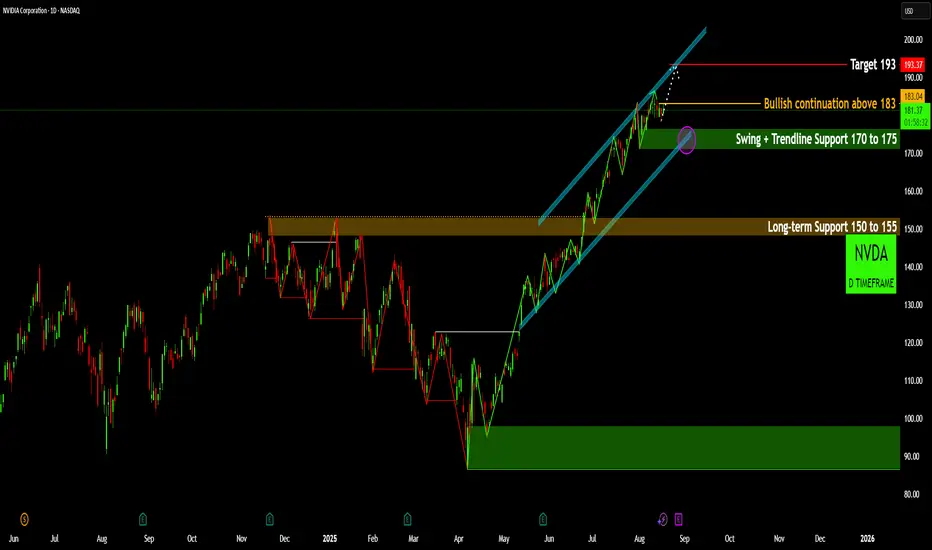
NVIDIA (NVDA) has staged a powerful recovery, turning the tide from its early 2025 lows and now poised for a significant move. A comprehensive look at the daily timeframe reveals crucial levels and a compelling bullish structure.
Robust Trend Reversal & Channel Formation: Following a substantial bottom established near the 85-95 region 🎯 in April, NVDA initiated a textbook uptrend. The price action has since carved out a well-defined bullish channel 📈, consistently printing higher highs and higher lows, indicative of strong buyer conviction.
Pivotal Support Foundations: The long-term 150-155 zone 🟢 now serves as a robust foundational support, having transitioned from a previous resistance level. More immediately, the 170-175 area 🟣 represents a critical confluence of a recent swing low and the lower boundary of the bullish channel. This zone is paramount for sustaining the current upward momentum.
Immediate Resistance Challenge: Currently, NVDA is fiercely contending with the $183 resistance level ⚡. This is a pivotal point; a decisive breach above this mark would confirm strong bullish continuation, signaling that buyers are firmly in control and pushing for new highs.
Path to Target: A confirmed break above $183 opens the gateway for a powerful push towards the $193 objective 🎯. This target aligns seamlessly with the upper boundary of the prevailing bullish channel, signaling the next potential peak for this rally. Traders should monitor the volume accompanying any breakout for confirmation.
Key Levels to Monitor: While the outlook remains bullish, a failure to defend the
170-175 support would warrant caution, potentially ushering in a retest of the stronger
150-155 foundation ⚠️. Vigilance at these key levels will be crucial for navigating NVDA's next moves.
Disclaimer:
The information provided in this chart is for educational and informational purposes only and should not be considered as investment advice. Trading and investing involve substantial risk and are not suitable for every investor. You should carefully consider your financial situation and consult with a financial advisor before making any investment decisions. The creator of this chart does not guarantee any specific outcome or profit and is not responsible for any losses incurred as a result of using this information. Past performance is not indicative of future results. Use this information at your own risk. This chart has been created for my own improvement in Trading and Investment Analysis. Please do your own analysis before any investments.