Wave analysis on SET(Thai stock market)As the global economy is expected to recover from COVID-19 pandemic, Thai stock market has also started to gain its strength.
In this post, I am sharing my wave analysis and Elliot count on SET, Stock Exchange of Thailand, starting with monthly chart to grasp the big picture of the market.
Monthly chart
The following chart illustrates major financial crisis during this 20-25 years.
Looking at the post-Lehman crisis period, 5 wave bullish trend seems to have been finished with the 3 corrective waves; ABC as indicated with black wave and it bounced from black trend line.
Weekly chart
Price plunge due to COVID-19 pandemic ended around 970THB, where the market turned the way upward. Now it seems to form the third wave as indicated with purple waves.
Whether Thai stock market really regains its strength like pre-VIX crisis period depends on if the price can exceed lower high of weekly chart(purple dotted line). If going above the line, the market would have a chance to try record high, which is 2018 peak.
Daily chart
Looking at the daily chart, we can see that the first wave of weekly chart consists of 5 bullish wave of daily chart and it looks like the market has been forming a third wave of weekly third wave.
The next challenge would be if the price can go above the resistance line at 1600THB, which is also capped by 200 week SMA(light purple MA).
According to Bangkok Post, foreign investors in SET turned net buyers in Nov 10,2020 which contributed SET price surge. Foreign investors buy is also a key to break the ceiling.
SET trade ideas

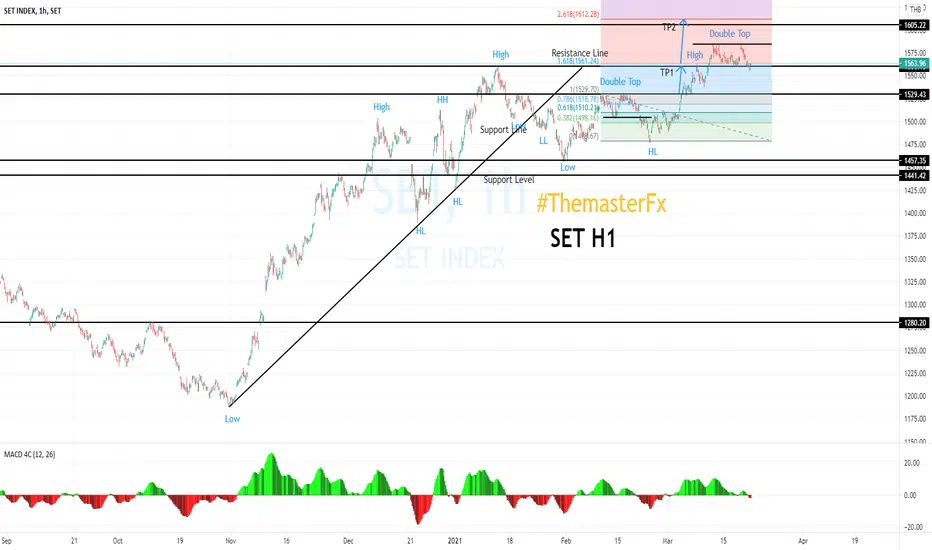
SET on the 1H time-frameSET on the 1H time-frame.
Steps:
1. The price created the higher low and breakout the previous high to confirmed the reversal pattern.
2. TP1: 1561 and TP2: 1612
3. Now the price created double top and divergence is happened by the MACD which is the 1st step of the reversal pattern.
Thailand SET March 2021By using both Elliot Wave theory and Fibonacci Retracement, Thailand SET index is under wave 5 and going to downward tread to set up motive wave1-5 and reactive A-C. Test 1st target at 61.80% or 1542 index


SET index on the 1H time-frame1. Once the price hit the TP at the resistance line at 1560 then throwback to be created the higher low.
2. If the price breakout 1560 and stand on it then an uptrend is working and running to the next target price.


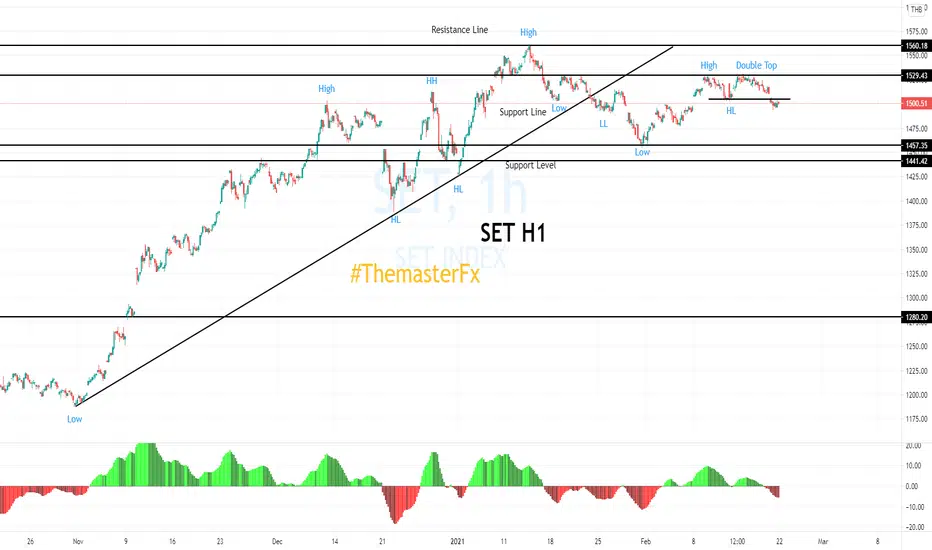
SET on the 1H time-frameSET index on the 1H time-frame.
Steps:
1. The price creating the higher low and to be confirmed an uptrend when breakout the resistance line at 1529.
2. If the price can not breakout then will be a triple top or lower high.

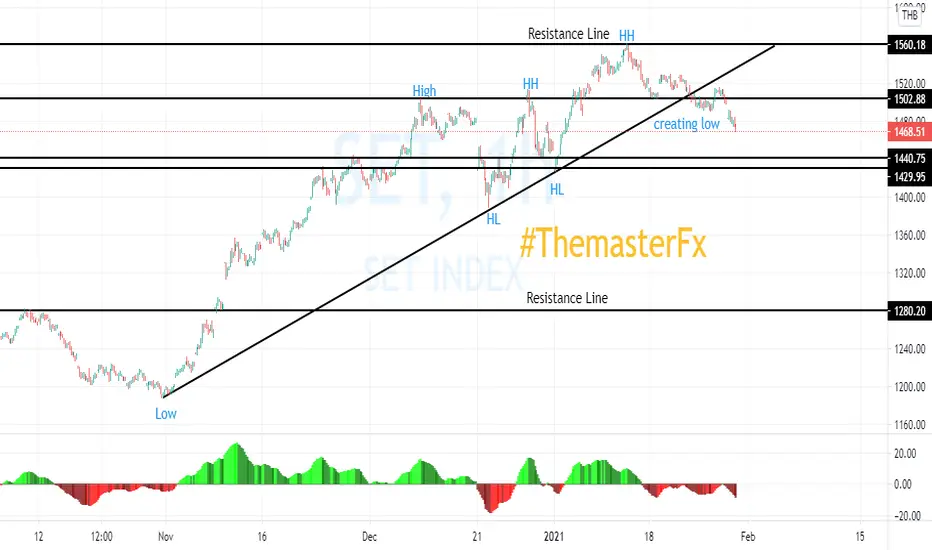
SET index on the 1H time-frameSET index on the 1H time-frame.
Steps:
1. The price created double top at the resistance line and breakout the previous low to confirmed the reversal pattern.
2. If the price create the lower high by the next MACD (+) then the TP of downtrend are 1477 and 1457 accordingly.
Set Zigzag?it supposes to be ZIGZAG.
Now go short for a while.
go long when hit 61.8% (maybe).
then go short again.

Set is going to 1,800 by June?Based on Fibonacci measurements and the trend (Wave 3 after Wave 2 completes)

SET on the 15 min time-frameSET on the 15 min time-frame
1. The price created the higher low and breakout the previous high to confirmed the reversal pattern.
2. The price hit TP1 and it is going to TP2:1536 TP3:1560 at the previous high first and next to 1572 when breakout.
3. On 1H time-frame still creating the higher low and waiting for breakout the previous high at 1560 for higher high.

SET in Running Flat? I try to capture market maker.
i'm not sure whether this correction is Irregular flat or running flat???
finally it looks like running flat (where Strong B-Wave and C failure).
i also noticed some gap in this period and drew a trendline to see what it should be.
Long at this point
then go short.

SET index on the 1H time-frameSET index on the 1H time-frame.
Steps:
1. The price is running downtrend by still creating lower high and lower low.
2. The price hit TP1:1486 and TP2:1460 already.
3. It is running to hit TP3:1429
4. A 15 min time-frame is creating the higher low and waiting for breakout the previous high at 1500

SET - Stock Exchange of Thailand Index - Still Bullish PredictioHumbled, we would like to thanks for your support who has already liked, commented and followed us.
Your support, strengthens us, to help in analyzing the market.
SET - Stock Exchange of Thailand Index - Still Bullish Prediction

SET BearishSET 1H
1. Hit support
2. Rebound then
3. Pullback after hit resistance.
it is the time to go Long Then Short

SET index on the 1H time-frameSET index on the 1H time-frame.
Steps:
1. The price created the lower high and breakout the previous low to confirmed the reversal pattern.
2. The price hit TP1:1486 and TP2:1460
3. It is running to hit TP3:1429

SET index have occurred rsi bullish divergence signalSET index have occurred rsi bullish divergence signal, waiting for the next week.

SET index on the 1H time-frameSET index on the 1H time-frame
1. The price breakout the up-trendline and also breakout the previous low to confirm the reversal pattern.
2. The price is running to the support line level at 1429 to 1440 then will rebound.
3. The price is moving in the MACD (-) which still in the selling momentum.
SET index on the 1H time-frameSET index on the 1H time-frame.
Steps:
1. The price breakout the previous high and hit the target price at Fibonacci level 161.8%.
2. The Price is now creating the higher low at this MACD (-)
3. Uptrend still working.

SET INDEX next stop!!! 1646Buy on dip if any. Next target is 1646, fund flow from FED money coming in all over emerging market. ASEAN including THAILAND still laggard.

SET index on the 15 min time-frameSET index on the 15 min time-frame.
Steps:
1. The price is moving in the triangle pattern and waiting for breakout.
2. Will follow an order position when the price breakout the triangle pattern.

SET index on the 15 min time-frameSET index on the 15 min time-frame.
Steps:
1. If the price will be an uptrend when the price breakout the previous high at 1495 and 1504
2. The next target price is 1543 in 1H time-frame.
3. But if this MACD (+) create the lower high then the price will moving in the sideway.

Has the air ran out from SET?After a strong bullish run, SET managed to close with bearish candle that engulfed the larger indecision candle from the trading day before.
I would have been calmer if SET50 and S50 would have followed its sister, but they have not had a close over the June highs.
So let's ask us the question; is this the end of x-mas / Covid vaccine rally and time for a lager correction?
Well if the 1450 support doesn't hold, the gap support and fib.618 might very well be a good area to find new buyers. Although, I personally, would feel more at ease if SET went all the way down to fib.50, to find new buyers, so investors can get a healthy northern ride, with nice slow higher highs and higher lows.
