TESLA: Bullish Continuation Pattern: Eyes on 482 → 550 → 600TESLA: Bullish Continuation Pattern: Eyes on 482 → 550 → 600
TSLA is forming another bullish continuation pattern after a series of higher-low triangle formations. The structure suggests strong trend continuation potential if buyers reclaim momentum.
A confirmed breakout above the current resistance zone could open the path toward 482 and beyond.
Key Levels & Targets:
• 482 Quick target if resistance breaks
• 550
• 600
• 650
You may find more details in the chart!
Thank you and Good Luck!
❤️PS: Please support with a like or comment if you find this analysis useful for your trading day❤️
Trade ideas

Tesla: Do Converging EMAs Signal a Decisive Moment?Hello everyone, looking at Tesla’s current rebound, my first impression is that the market is entering a rather sensitive “trend-defining zone.” After a strong decline since mid-November, TSLA has finally bounced and climbed above the EMA 34, moving straight into a test of the EMA 89 — where the two moving averages are creating a technically noteworthy confluence area.
In the past few weeks, Tesla consistently stayed below both the EMA 34 and EMA 89 , reflecting a clear and somewhat heavy downtrend. But the current recovery has partially changed the picture: buying momentum has returned strongly enough to push price above the EMA 34 and close in on the EMA 89. This is typically the moment when the market reveals its true intention — either continuing upward to confirm a phase shift, or pausing because buying pressure has not yet matured.
Volume has increased but remains relatively modest, indicating that large capital has not truly stepped in. This makes the 435–440 USD resistance zone a significant challenge: Tesla has been rejected here multiple times, and if buying power lacks depth, price may easily turn downward again.
Wishing everyone effective trading and resilience through every market movement!
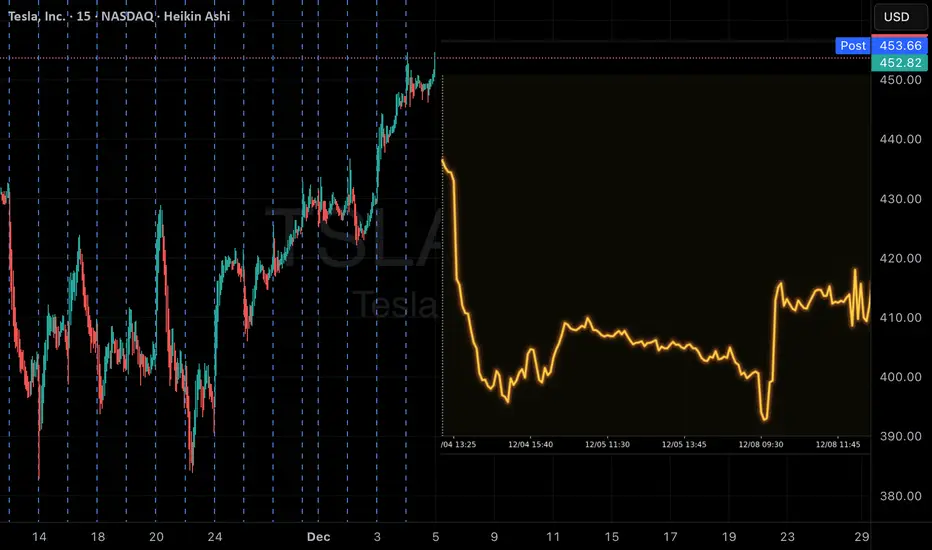
TSLA Weekly Alert: Katy AI Signals Puts Amid Bearish MomentumTSLA Weekly Trade Info – 2025-12-04
Instrument: TSLA
Trade Type: BUY PUTS (Katy AI Predicted)
Strike Focus: $395.00
Entry Range: $0.85
Target 1: $1.27 (≈50% gain)
Stop Loss: $0.63 (≈26% loss)
Expiry: 2025-12-12 (8 days)
Confidence: 58% (Speculative)
Weekly Momentum: NEUTRAL (-0.74% 1W)
Options Flow: Bearish, PCR 1.69 (strong institutional put positioning)
Analysis Summary:
Katy AI Signal: Bearish, predicts $447.54 → $435.96 (-2.59%) over 8 days
Technical: Resistance $454.26, support $422.12; multi-week bearish trend confirmed
News Sentiment: Mixed – EV leadership praised, but sector risks (AI correction, rate uncertainty)
Conflict Note: LLM suggests buy calls, but Katy AI predicts puts; follow Katy AI for direction
Risk: HIGH – low conviction, mixed signals, high PCR, speculative weekly trade.
Recommendation: Small position only due to high uncertainty.
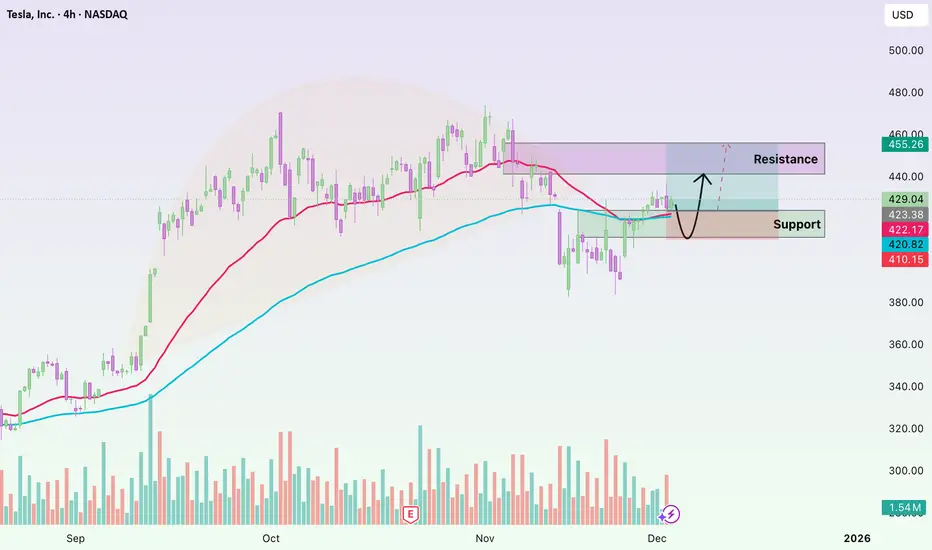
TSLA Market Preview – December 5TSLA is pushing into a major decision zone after a strong multi-day run. The structure is clean: higher highs, higher lows, and a steady grind along the rising trendline. But price is now pressing directly into a heavy supply area that has rejected TSLA multiple times in the past. The next move will be defined by whether buyers can absorb this overhead liquidity.
Structure Overview (1H)
The broader trend remains bullish. Buyers have been in control since reclaiming the $430s, and momentum has carried price straight into the $452–456 supply block — the same zone where sellers previously stepped in aggressively. TSLA is also riding a rising channel, and price is now hovering right at the upper trendline.
This is typically where you see either a breakout continuation… or the start of a pullback.
Below, the key demand sits at $445 → $438, with a deeper pocket near $424. These zones align with strong accumulation footprints and are where institutions previously positioned themselves.
Short-Term View (15M)
The 15M chart shows a clean BOS earlier in the day, followed by a controlled consolidation right under resistance. That’s what you usually see before one more push. But the red SMC sell zone overhead is rejecting each attempt to break through — that is the first sign of exhaustion.
You also have a CHoCH forming underneath, meaning the market is hinting at a shift in short-term momentum. If TSLA loses the 15M trendline, that shift becomes official and sellers will have the upper hand.
GEX Outlook for Tomorrow
Gamma tells a very simple story:
* Major CALL resistance / positive GEX: $455–$460
* Neutral magnet zone: $448–$452
* PUT support: $445 → $438 → $424
Dealers are positioned in a way that limits clean trending movement unless price escapes these ranges. A push above $456 could squeeze toward $460–462, but rejection here would force price back toward the magnet zone at $448–452.
What I Expect for Dec 5
My outlook leans neutral-to-bearish unless TSLA proves it can break and hold above $456. The move has been extended, momentum is slowing, and we’re sitting at the most crowded liquidity layer on the chart.
If buyers want higher, they must show:
* A clean breakout → retest → hold above $456
* Strong volume through the supply block
* A new BOS on lower timeframes to confirm continuation
If sellers take control:
* Losing the rising trendline opens the door to $448
* Below that, $445 becomes the first real bounce zone
* Deeper pullback targets sit at $438 and $424
Trade Thoughts
If bullish:
The only setup worth taking is the break and hold above $456, with room toward $460 → $462.
If bearish:
The best risk-reward is a rejection play from $454–$456, aligning with the SMC sell zone and GEX resistance.
Targets: $448 → $445 → $438 if momentum accelerates.
Avoid taking trades in the middle of the range — that’s where TSLA will chop.
Disclaimer
This outlook is for educational purposes only. It reflects personal analysis and opinions based on price action, structure, and GEX data. Always trade your own plan and manage risk carefully.

TESLA - Long - 528 / 611Tesla is still displaying the potential to fly higher.
As per our technical analysis we can find the stock has the potential to hit the levels of 528 and even to the levels of 611.
611 is a reversal level and hence we can expect some minor correction from that point.
Incase the stock fall from the current level of 430 , the best buying point is 348 /325.
From these levels we can expect a smooth ride towards the 528 levels.

Tsla bullish breakout 2.7:1 risk reward ration Tesla is breaking out to bullish trend. Heading long here at 330, target 430$
$TSLA: $350 Target - $380 Short (Support Breaking)The support for Tesla seems to be breaking, and the oscillators are due for a negative downtrend along with the RSI close being too high. The analysts at the same time are neutral and this has been given a buy over a strong buy target with catalysts like lower earnings in some countries and a lack of competitive advantage over BYD for actual output of vehicles produced and sold. Management is also unsure of Musk who has a huge multitrillion dollar pay package incentive which will make the company even lower on cash. Therefore, the next target for a NASDAQ:TSLA short in my opinion, is $380 or less within Q1 of 2026. As always, none of this is investment or financial advice. Please do your own due diligence and research.

Tesla May Have Charged its BatteriesTesla has chopped sideways for months, but some traders may think the EV maker is ready to start moving again.
The first pattern on today’s chart is the $420 level. TSLA held that price several times between mid-September and mid-November. It briefly became resistance when the stock dipped but now the shares are holding above it again.
Second, prices bounced slightly above $380 in two separate weeks last month. That double bottom could be viewed as a bullish reversal pattern.
Next, the 8-day exponential moving average (EMA) is nearing a potential cross above the 21-day EMA. MACD has also started rising. Those may signal improving short-term trends.
Finally, TSLA is a highly active underlier in the options market. (Its average volume of 2.3 million contracts ranks second in the S&P 500, according to TradeStation data.) That may help traders take positions with calls and puts.
TradeStation has, for decades, advanced the trading industry, providing access to stocks, options and futures. If you're born to trade, we could be for you. See our Overview for more.
Past performance, whether actual or indicated by historical tests of strategies, is no guarantee of future performance or success. There is a possibility that you may sustain a loss equal to or greater than your entire investment regardless of which asset class you trade (equities, options or futures); therefore, you should not invest or risk money that you cannot afford to lose. Online trading is not suitable for all investors. View the document titled Characteristics and Risks of Standardized Options at www.TradeStation.com . Before trading any asset class, customers must read the relevant risk disclosure statements on www.TradeStation.com . System access and trade placement and execution may be delayed or fail due to market volatility and volume, quote delays, system and software errors, Internet traffic, outages and other factors.
Securities and futures trading is offered to self-directed customers by TradeStation Securities, Inc., a broker-dealer registered with the Securities and Exchange Commission and a futures commission merchant licensed with the Commodity Futures Trading Commission). TradeStation Securities is a member of the Financial Industry Regulatory Authority, the National Futures Association, and a number of exchanges.
Options trading is not suitable for all investors. Your TradeStation Securities’ account application to trade options will be considered and approved or disapproved based on all relevant factors, including your trading experience. See www.TradeStation.com . Visit www.TradeStation.com for full details on the costs and fees associated with options.
Margin trading involves risks, and it is important that you fully understand those risks before trading on margin. The Margin Disclosure Statement outlines many of those risks, including that you can lose more funds than you deposit in your margin account; your brokerage firm can force the sale of securities in your account; your brokerage firm can sell your securities without contacting you; and you are not entitled to an extension of time on a margin call. Review the Margin Disclosure Statement at www.TradeStation.com .
TradeStation Securities, Inc. and TradeStation Technologies, Inc. are each wholly owned subsidiaries of TradeStation Group, Inc., both operating, and providing products and services, under the TradeStation brand and trademark. When applying for, or purchasing, accounts, subscriptions, products and services, it is important that you know which company you will be dealing with. Visit www.TradeStation.com for further important information explaining what this means.

Tesla - The triangle is still valid!🎀Tesla ( NASDAQ:TSLA ) can still confirm the breakout:
🔎Analysis summary:
Just two months ago, Tesla perfectly broke out of the major ascending triangle pattern. In the meantime we just witnessed a major consolidation at the all time high. Quite likely that Tesla will soon confirm the breakout, launching another parabolic rally from here.
📝Levels to watch:
$400
SwingTraderPhil
SwingTrading.Simplified. | Investing.Simplified. | #LONGTERMVISION

TSLA daily bullish divergenceNASDAQ:TSLA is consolidating below all-time high resistance, suggesting a breakout is coming.
Wave (2) appears complete at the High Volume Node support and 0.5 Fibonacci retracement with a bullish structre flip.
📈 Daily RSI hit oversold with bullish divergence
👉 Continued downside has a target of the daily 200EMA $362
Safe trading

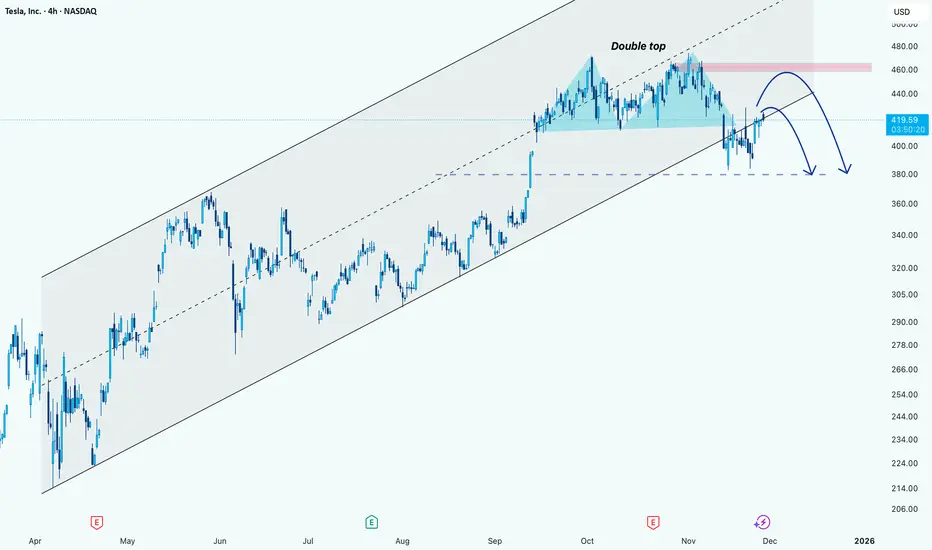
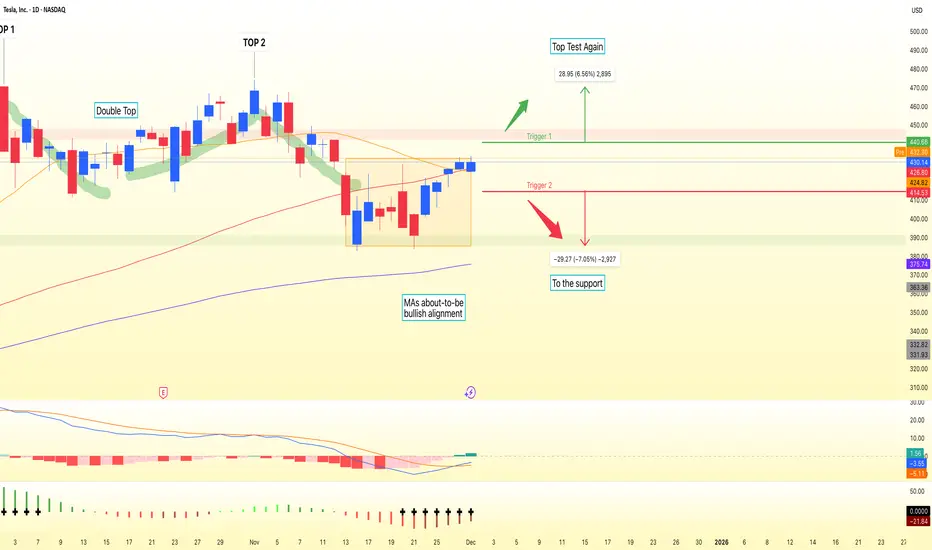
Tesla: A overview of itHi!
Trend Analysis:
TSLA has been trading in an ascending channel for several months, with higher highs and higher lows visible since April.
The recent price action broke above the midline of the channel but is currently consolidating near the $420-$425 area.
Pattern Formation:
A Double Top pattern near the $460 level formed.
This pattern signals a potential reversal if the price fails to break above the resistance zone (marked in pink).
The neckline of this double top appears around $400, which is also a key support zone.
Potential Price Action:
Short-term rebound:
TSLA could retest the resistance zone near $455-$460.
If it fails to break this area convincingly, the double top pattern could trigger a reversal.
Medium-term correction:
If the reversal occurs at the resistance zone, price may fall toward the neckline/support area near $380.
This aligns with the lower boundary of the channel and previous support levels.
TSLA in SELL ZONEMy trading plan is very simple.
I buy or sell when at either of these events happen:
* Price tags the top or bottom of parallel channel zones
* Money flow volume spikes beyond it's Bollinger Bands
So...
Here's why I'm picking this symbol to do the thing.
Price in selling zone at top of channels
Money flow momentum is spiked positive and nearing top of Bollinger Band
Entry at $447
Downside targets are
$370 bottom channel (short time frame)
$390 bottom channel (longer time frame)
$420 moving average
Will be buying NASDAQ:TSLQ

Tesla preparing for all time highs?NASDAQ:TSLA Price is ranging below all all-time high, well above the weekly pivot and 200EMA, which is bullish.
Wave © of C appears to be underway into price discovery with a target of $730, the R2 weekly pivot. This is because it has been printing a series of 3 wave structures. Wave B printed a triangle, which is a pattern found before a terminal move, reinforcing the Elliot wave count.
🎯 Terminal target for the business cycle could see prices as high as $730 based on Fibonaci extensions
📈 Weekly RSI is just below overbought so has room to grow
👉 Analysis is invalidated if we close back below wave (B), $280
Safe trading

Tesla $TSLATesla (TSLA) has launched new, more affordable "Standard" versions of its Model 3 and Model Y vehicles across Europe, a strategic move aimed at countering a sharp decline in sales within the region. This decline is attributed to intensifying competition from rival automakers and the polarizing political commentary of CEO Elon Musk, which has alienated some potential buyers.
Pricing and Product Details
In key European markets like the Netherlands, Tesla has significantly reduced entry prices. The Model 3 Standard is now listed at 36,990 euros ($43,130), a notable discount compared to the 45,990 euros ($53,620) for the Premium Long Range version. Similarly, the Model Y Standard is priced at 39,990 euros ($46,630), versus 50,990 euros ($59,450) for its Premium Long Range counterpart.
These Standard models are "de-contented," meaning they come with reduced specifications to achieve the lower price point. Key omissions and changes include:
The use of cloth seats instead of premium materials.
The removal of the rear passenger infotainment screen.
The absence of a glass roof.
Simplified interior lighting.
Less powerful electric motors and a decreased driving range per charge.
Both the Model 3 and Model Y Standard variants are available for delivery as soon as December. For context, in the United States, the Model 3 Standard starts at $36,990 and the Model Y Standard at $39,990.
European Sales Slump and Contributing Factors
The introduction of these budget-friendly models comes at a critical time for Tesla in Europe. According to data from the European Automobile Manufacturers' Association (ACEA), Tesla's vehicle registrations—a proxy for sales—plummeted by 48.5% year-over-year in October 2024, to just 6,964 units.
This decline starkly contrasts with the broader market trends. In the same period, total electric vehicle registrations across the European Union, UK, and European Free Trade Association surged by 32.9%, while overall vehicle registrations (across all powertrains) grew by 4.9%.
Analysts point to a confluence of factors behind Tesla's regional struggles:
Fierce Competition: The European EV market is becoming increasingly crowded with compelling offerings from both established European brands and new Chinese entrants.
Economic Headwinds: As CEO Elon Musk has noted, higher interest rates and an uncertain economic outlook are dampening consumer demand for big-ticket items.
CEO Polarization: A significant, albeit harder-to-quantify, factor is the backlash from some European consumers against Musk's public embrace of far-right political figures in the region and his contentious relationship with former U.S. President Donald Trump. This has led to a reputational challenge that may be affecting brand consideration.
Market Reaction and Technical Outlook
Tesla's stock (TSLA) showed little immediate movement on the news of the Standard model launch. However, shares are up approximately 6% for the week, largely buoyed by a recovery in the broader technology sector.
From a technical analysis perspective, the stock has identified two key support zones: the first at the 0.236 Fibonacci level (around $406) and a secondary, stronger support at the 0.382 Fibonacci level (around $354.94). On the upside, two primary take-profit targets have been established at $500 and $520 per share.
A Potential Catalyst: Regulatory Progress on Full Self-Driving
In a potentially positive development, the Netherlands' RDW vehicle authority has established a formal schedule for Tesla to demonstrate its Full Self-Driving (FSD) technology in February 2025. The purpose is to assess whether it meets European regulatory requirements. It is crucial to note that FSD has not yet been approved for use in Europe.
Securing approval from even a single European national regulator would represent a monumental step forward for Tesla. It could serve as a powerful differentiator in the market and a significant catalyst to help reverse the company's sales decline on the continent.
Conclusion
The launch of the Standard Range Model 3 and Model Y is Tesla's direct countermeasure to reignite demand in a critical but challenging European market. While the lower price point may attract more budget-conscious buyers, it remains uncertain whether this move alone can overcome the headwinds of competition, economic conditions, and brand perception. The upcoming FSD demonstration to Dutch regulators in February presents a separate, high-stakes opportunity that could substantially alter Tesla's trajectory in the region in the medium to long term.

TSLA Post-Earnings Momentum – Don’t Miss!TSLA QuantSignals V3 – Weekly Trade Alert (2025-12-02)
Trade Direction: BUY CALLS (Bullish)
Confidence: 65% | Conviction: Medium
Recommended Strike: $430.00
Entry Range: $7.35
Target 1: $11.68 | Target 2: $15.43
Stop Loss: $5.11
Expiry: 2025-12-05 (3 days)
Position Size: 2% of portfolio
⚠️ Risk & Conflict Notes
Katy AI shows neutral bias with subtle bearish trend (-0.89% predicted move, 50% confidence), conflicting with bullish weekly momentum.
RSI overbought at 74 → potential pullback risk.
Options flow bearish (PCR 1.60) suggests institutional hedging; size position carefully.
Moderate risk warning: trade requires monitoring due to conflicting signals and short expiry.
💡 Trade Insight
Weekly bullish momentum +1.65% with trending regime supports short-term upside potential.
Technicals: MACD histogram bullish, VWAP support at $428.73, price near 91.6% of weekly range.
Timing advantage: leverage short-term momentum with 3-day expiry options.
Balanced delta (0.515) and tight stop loss help mitigate downside risk.

TSLA: Another Major Pivot — 325 Is Calling..We successfully caught the 3rd November high, and now we expect the current high to form another pivot.
From this area, we anticipate a continuation to the downside, with 325 as the next major target.
Bearish momentum remains in control.


TSLA at a Tipping Point – Dec 1–5 OutlookWeekly – Momentum Still Up, But Cooling
TSLA has been trending cleanly off that long-term bullish structure break from $380s. The weekly candles are still holding higher lows, but last week showed a slowdown — smaller candle body, longer top wick. That usually means buyers are still there, but not as aggressive as earlier in the run.
Important zones:
* $430–432: current reaction zone
* $474–475: next weekly supply
* $368: major weekly demand if things pull back deeper later
Overall weekly tone → still bullish, but losing steam.
Daily – Retesting the Broken Structure
Daily shows the clearest picture: TSLA rejected the supply zone above $450 and came back down to retest the broken structure around $420–425. Buyers stepped in, but it isn’t a full reversal yet. Price is still inside a broad daily supply zone.
Daily key levels:
* Resistance: $440 → $455
* Support: $422 → $412
Until price fully clears above the supply zone, TSLA has limited upside.
1-Hour – Grinding Up, But Inside a Tight Path
The 1H trend is still intact with a rising channel, but the last few candles show exhaustion near $430. Multiple touches on the upper trendline show sellers defending that area. Buyers are still pushing, but they’re losing momentum on each attempt.
The moment $426–427 breaks, downside opens quickly.
Short-term 1H levels:
* Breakout: above $432–433 → next extension $440
* Breakdown: below $426 → fast drop toward $420
15-Minute – Compression Before a Move
The 15m shows price trading sideways after a clean BOS move earlier. That compression usually leads to a quick breakout or breakdown. The fact that price keeps tapping the same resistance near $430 without clearing it shows hesitation.
The 15m favors breakout continuation IF buyers step in with volume.
Otherwise, it slips back to $426–424 easily.
GEX – Where Options Traders Force the Move
This is where TSLA becomes interesting.
On the GEX map:
* Highest positive GEX sits at $432–435 → magnet + resistance
* Second CALL wall around $450 → possible extension point
* Heavy PUT support around $410–400 → strong buyer zone
* Another deep PUT wall at $380 → major support
What GEX is telling:
* As long as TSLA stays under $432–435, market makers lean neutral-to-slightly bearish.
* If price breaks above $435 with force, gamma flow can push it into $445–450 quickly.
* If price breaks below $426, you get negative gamma momentum pushing it straight toward $415–410.
This aligns well with the TA structure — both are pointing at the same “pressure valve.”
Trading Thoughts – Dec 1–5
Bullish Setup
* Needs a clean break + hold above $432–433
* Target 1: $440
* Target 2: $450 (CALL wall)
* Stop zone: below $426
Call idea (short-dated, aggressive)
TSLA 440C or 445C — ONLY if it breaks $433 with volume.
Bearish Setup
* If price loses $426, sellers take control.
* Target 1: $420–422
* Target 2: $410 (strong GEX PUT support)
* Target 3 (bigger move): $400
Put idea (conservative)
TSLA 420P → safest
TSLA 410P → higher risk but bigger payoff
Only valid if breakdown happens, not before.
Overall Outlook for Dec 1–5
TSLA is sitting at a decision level.
Everything lines up:
* Weekly: slowing momentum
* Daily: retesting previous structure
* 1H: exhaustion underneath resistance
* 15m: compression before a move
* GEX: clear walls at $435 (cap) and $410 (floor)
The move will be clean once direction is chosen.
This setup is perfect for option traders who wait for confirmation instead of guessing.
Disclaimer
This analysis is for educational purposes only, not financial advice. Always trade with your own risk management and confirmation.

THIS IS TESLA'S CHANCE TO RALLY! WILL IT HAPPEN NOW OR IN 2027?New evidence on Tesla stock shows that this is Tesla's final chance to rally for this market cycle of 2022-2026. We discuss whether or not this rally can happen now in the next few months
or if it will be delayed until 2027-2028.

TSLA Gamma Structure and Key Reaction ZoneTesla (TSLA) stock has roughly $100 million of positive gamma exposure at the $450 strike, meaning a large concentration of call options is forcing dealers to buy shares as price moves upward toward that level, potentially creating a feedback loop that accelerates upside momentum. This “gamma wall” can act as a short-term magnet where price is drawn higher as hedging intensifies, but the effect is typically strongest only as long as spot price approaches or trades into that strike before options expiration.

Tesla Breakdown Alert: RSI Overbought + Bearish DivergenceTSLA Weekly Put Signal Summary
Direction: BUY PUTS (Short)
Confidence: 55% (Low conviction)
Strike Focus: $430.00
Expiry: 2025-12-12 (8 days)
Entry Range: $1.27–$1.29 (mid: $1.28)
Target 1: $2.54 (≈100% gain)
Target 2: $3.81 (≈200% gain)
Stop Loss: $0.76 (≈40% loss)
Position Size: 2% of portfolio (small due to low confidence)
Technical & Market Analysis
Katy AI Prediction: Downward movement from $453.85 → $435.44 (-4.1% predicted drop)
Weekly Momentum: Neutral (+0.07% 1W)
RSI: Overbought at 74.6 → suggests pullback possible
MACD: Bearish divergence detected → warning for reversal
Support / Resistance:
Resistance: $460.66 (stop loss level)
Support: $435.44 (Katy target)
Options & Flow Intel
Put/Call Ratio: 1.93 → strong bearish institutional positioning
High Volume: Protective $150 put activity noted
Max Pain: $452.50 → slightly below current price, aligns with downside bias
Risk Notes
Moderate risk due to low conviction + neutral composite score
Low volume may lead to whipsaw action
Tight stop recommended at $460.66 (breach invalidates bearish thesis)
💡 Key Takeaway:
This is a speculative bearish put setup based on Katy AI’s consistent short-term downward prediction. Only small position size is advised due to low confidence and moderate risk environment.
TSLA Range Breakout SetupTesla on the daily chart is stuck in a tight battleground between structure and momentum. Price is consolidating below the 20- and 60-day moving averages after a bearish Market Structure Shift in early November, while still holding above the long-term 120-day moving average. The result is a classic Bear Flag look: a sharp downside pole followed by a choppy, upward-sloping consolidation between the $400 demand zone and $440 supply zone.
As long as TSLA trades inside this band, it’s a range game. The primary path is continuation lower if the Bear Flag resolves as expected. A daily close below roughly $415 would put pressure on the $400 support and open the way toward the $385 area, aligning with the flag breakdown logic and recent downside momentum. For this bearish continuation view, a sustained close back above $430–440 would effectively invalidate the pattern and suggest sellers are losing control.
On the flip side, a clean daily close above $440 would flip the script, clearing both key moving averages and turning the zone into support. That breakout could unlock a move toward the prior October swing region around $470, with the idea invalidated if price drops back into the range and especially below $400. This is a study, not financial advice. Manage risk and invalidations.
Thought of the Day 💡: Often the edge is in letting the market show its hand at the extremes of the range, not in guessing the next candle.
-------------------------
Thanks for your support!
If you found this idea helpful or learned something new, drop a like 👍 and leave a comment, I’d love to hear your thoughts!
Long on TeslaThe rapid expansion of Tesla Robotaxi fleet in Austin from 30-60 cars to compete with google's waymo,along with it developing its own in house ai chips for its cars which would reduce operating costs to me that it can hit 600-650 within the next coming months .
