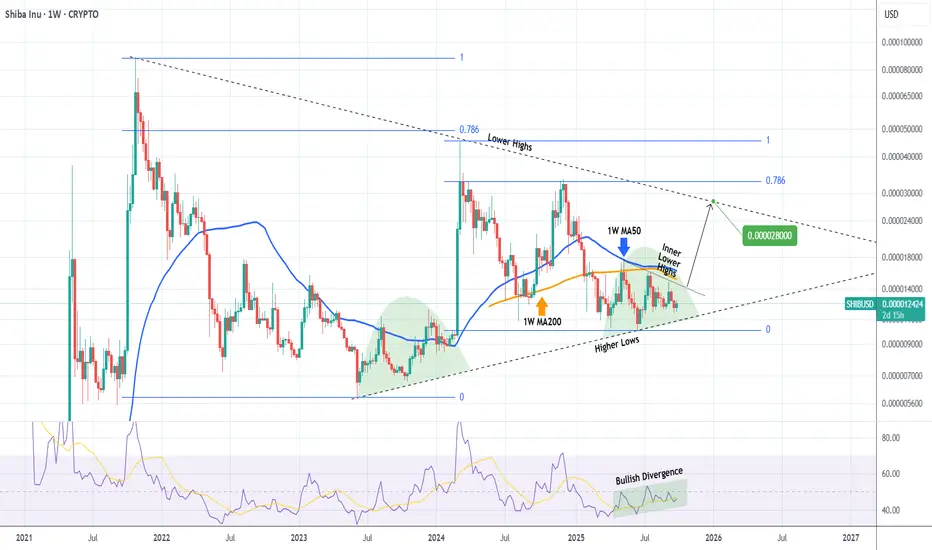
SHIBA Strong break-out expected, targeting 0.000028!Shiba Inu (SHIBUSD) has been trading within a Triangle pattern since the October 25 2021 Top of its previous Bull Cycle. The successive Lower Highs of the current Cycle have failed to make a new All Time High (ATH) and have 'trapped' the price action below its 1W MA50 (blue trend-line), is a similar Accumulation Phase on the Higher Lows like June 2023 - January 2024.
However, the 1W RSI has been rising within a Channel Up, showcasing a technical Bullish Divergence. If the price breaks above the Inner Lower Highs trend-line, it will be a first Buy Signal with confirmation coming above the 1W MA50. In that case, we expect at least a 0.000028 test of the Triangle's top (Lower Highs), still a conservative target given that the 2024 rally almost hit its 0.786 Fibonacci retracement level.
-------------------------------------------------------------------------------
** Please LIKE 👍, FOLLOW ✅, SHARE 🙌 and COMMENT ✍ if you enjoy this idea! Also share your ideas and charts in the comments section below! This is best way to keep it relevant, support us, keep the content here free and allow the idea to reach as many people as possible. **
-------------------------------------------------------------------------------
💸💸💸💸💸💸
👇 👇 👇 👇 👇 👇
SHIBUSD.P trade ideas
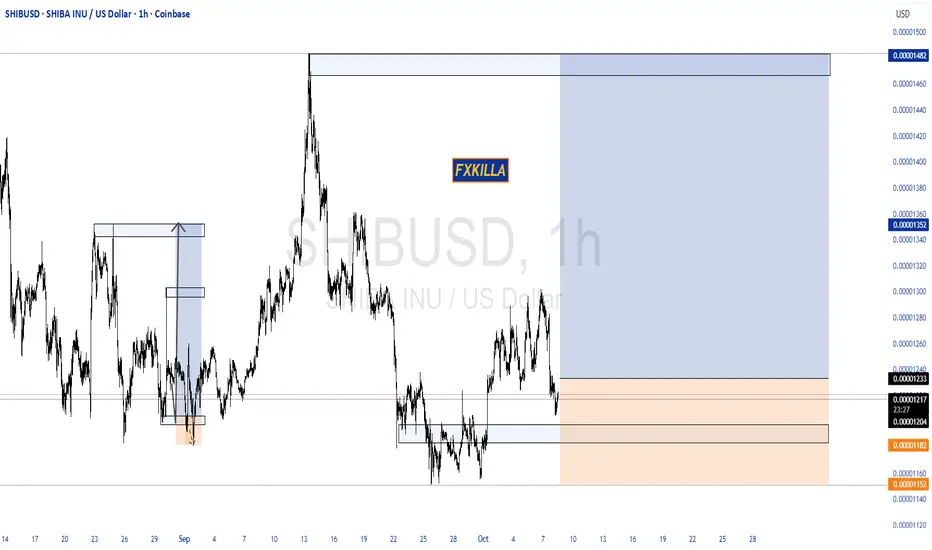
SHIBA INU HIGH PROBABILITY SETUP SOON!!!🚨 SHIBUSD HIGH PROBABILITY BUY SETUP 🚨
* Here We Can See Clearly The Next Potential Move For SHIBA Coming Hours/Days.
* Keep Your Eyes Close On Your Trading Positions.
* Happy PIP Hunting Traders.
FXKILLA.
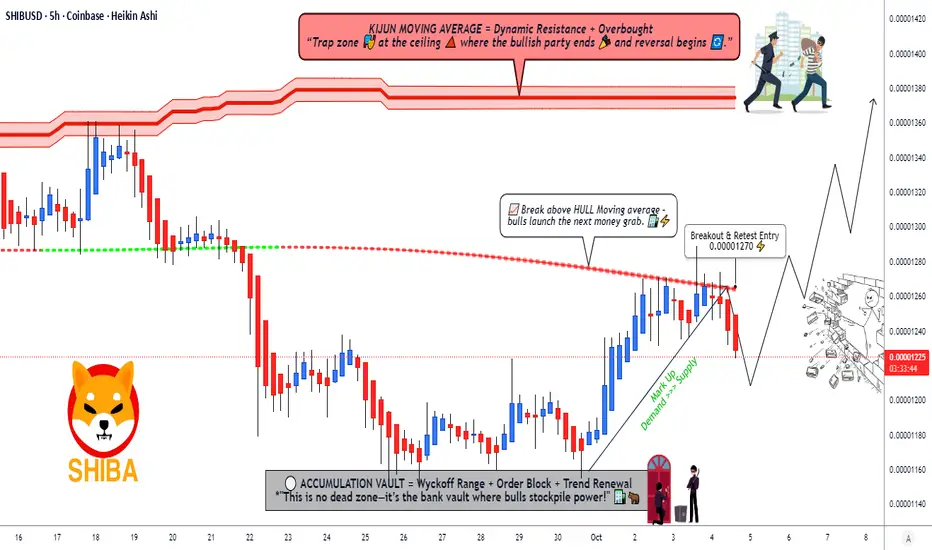
SHIBA INU Strategy Plan | Breakout Entry & Profit Zone🚀 SHIB/USD: Shiba Inu’s Moon Mission! 🌙 Swing/Day Trade Wealth Map 🗺️
🔥 Asset: SHIB/USD (Shiba Inu vs. U.S. Dollar)
🎯 Strategy: Bullish Pending Order – Ready to Ride the Crypto Rocket! 🚀
💡 Vibe: Thief-style, high-energy, fun, and professional – let’s steal some profits (legally, of course)! 😎
📈 Trade Setup: Shiba’s Breakout Bonanza! 🐶💥
Plan: Bullish Pending Order 📡We’re waiting for Shiba Inu to break out like a dog off the leash! 🐕 Once the price smashes through our key level, it’s time to pounce!
Entry: 🏁 0.00001270Set your traps after the breakout at 0.00001270. This is where the Shiba rocket ignites! 🚀 Enter at any price post-breakout, but confirm the move with volume and momentum to avoid fakeouts.
Stop Loss: 🛡️ 0.00001220The "Thief’s SL" is your safety net! Place it below key support to dodge those sneaky market traps. ⚠️ Note: Dear OG Thieves, this SL is my suggestion, but it’s your heist! Adjust based on your risk tolerance and don’t let the market pickpocket you! 💸
Target: 🎯 0.00001370–0.00001380The "Police Barricade" at 0.00001380 is a strong resistance zone, with overbought signals and potential traps waiting! 🛑 Lock in profits around 0.00001370 to stay one step ahead of the market cops. Note: OG Thieves, this TP is my call, but you decide when to cash out! Take profits at your own risk and keep those bags secure! 💰
🔍 Key Points & Correlations
Why SHIB/USD? Shiba Inu is the meme coin with a cult following, driven by community hype and crypto market sentiment. 📣 Breakouts in SHIB often align with broader altcoin pumps, so keep an eye on Bitcoin (BTC/USD) and Ethereum (ETH/USD) for market direction.
Related Pairs to Watch (in USD):
COINBASE:DOGEUSD (Dogecoin): The OG meme coin often moves in tandem with SHIB. If Doge is barking, Shiba might howl! 🐶
BITSTAMP:BTCUSD (Bitcoin): The crypto king sets the tone. A bullish BTC often lifts altcoins like SHIB. 👑
BITSTAMP:ETHUSD (Ethereum): As the backbone of DeFi, ETH’s strength can fuel meme coin rallies. 🛠️
Correlation Note: SHIB tends to follow DOGE’s momentum with a slight lag. Watch DOGE/USD for early signals, and confirm with BTC/USD’s trend to avoid chasing false breakouts.
Technical Nuggets:
The breakout at 0.00001270 is backed by a key support/resistance flip zone. 📊
RSI is nearing overbought at the target zone (0.00001380), signaling a potential pullback. Watch for divergence! ⚡
Volume spikes post-breakout will confirm the move. No volume, no party! 🎉
🕵️♂️ Thief-Style Notes for the Crew
Dear Ladies & Gentlemen (Thief OG’s), this is a high-risk, high-reward heist! 🕵️♂️ I’m sharing my setup, but the market is a wild beast. My SL and TP are suggestions – you’re the master of your own vault! 💼 Trade at your own risk, and always protect your capital like it’s the crown jewels. 👑
✨ “If you find value in my analysis, a 👍 and 🚀 boost is much appreciated — it helps me share more setups with the community!”
Disclaimer: This is a thief-style trading strategy just for fun. Trading involves risks, and past performance is not indicative of future results. Always conduct your own research and trade responsibly. 🕵️♂️
#SHIBUSD #CryptoTrading #ShibaInu #SwingTrading #DayTrading #MemeCoins #BullishBreakout #ThiefStyle #TradingView

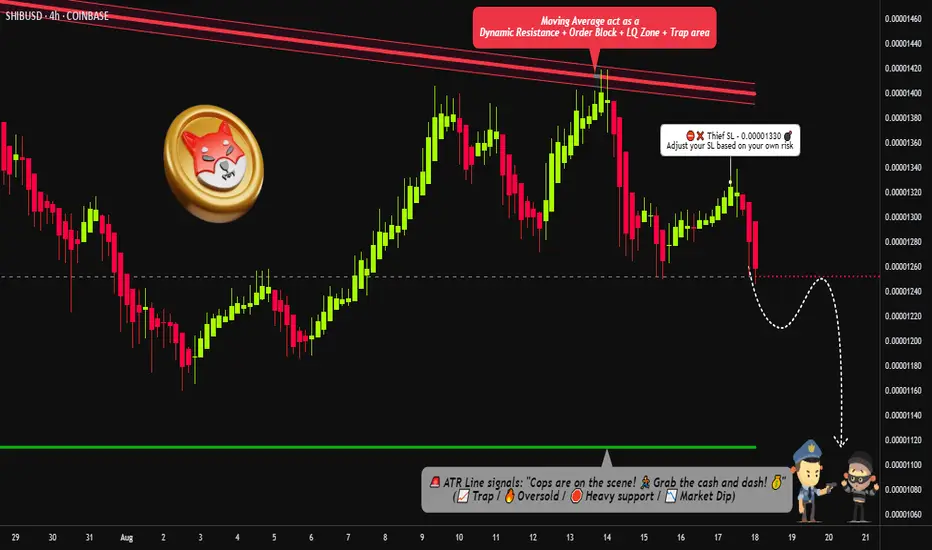
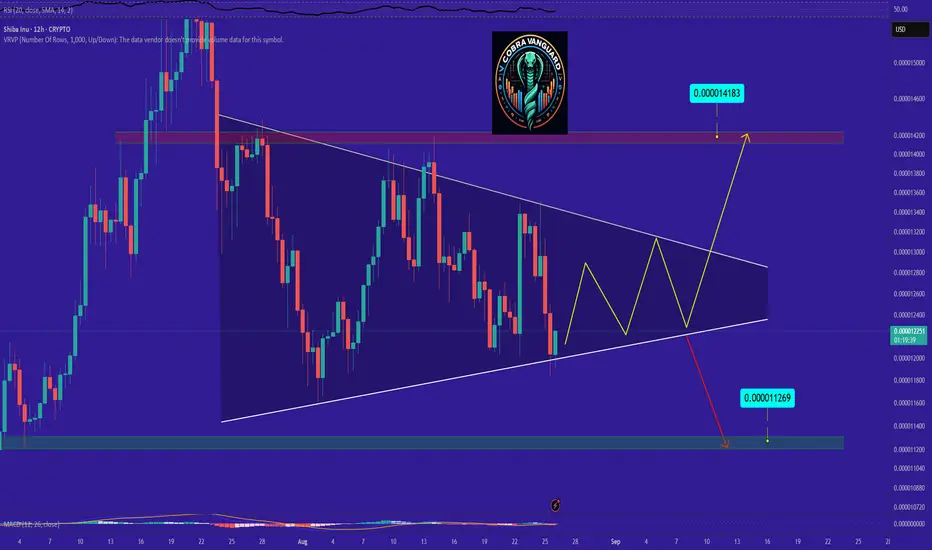
"SHIB Short Opportunity – Quick Heist, Faster Exit!"🔥🦊 SHIB/USD CRYPTO HEIST PLAN – THIEF TRADER STYLE 🚨💰
🔥 Thief OG’s Assemble – Tonight we Rob the SHIBA Vaults 🔥
👑 Dear Ladies & Gentlemen, Fellow Money Thieves, & OG Robbers 🏴☠️💸
Welcome to the Bearish Robbery Plan for SHIB/USD. Strap in, we’re going in with Thief Layering Strategy™ – multiple limit orders to maximize the loot.
📉 ENTRY PLAN – LAYERING STYLE
We don’t enter once… we layer the robbery. Multiple sell-limit orders stacked like a real thief’s toolkit:
💎 (0.00001250)
💎 (0.00001260)
💎 (0.00001270)
💎 (0.00001280)
👉 Add more layers if you want to spread your robbery wide. Remember: thieves don’t knock once, they pick every lock. 🔐
🛑 STOP LOSS (SL) – THIEF ESCAPE HATCH
Our Thief SL is parked at 0.00001330 🚨
But hey, every OG knows – adjust your SL based on your risk appetite & robbery style. 🏃♂️💨
🎯 TARGET – POLICE BARRICADE AHEAD 🚔
There’s heavy police resistance around 0.00001400… so don’t get greedy!
🎯 Our loot target is 0.00001120 💰 – grab it, stash it, and disappear before the cops surround the vault.
📜 MASTER HEIST PLAN
❌ Trend: Bearish (Shiba vault is weak & exposed)
🧨 Method: Layered Sell Orders (Limit Entries)
🏴☠️ Risk: Controlled by Thief SL
💰 Reward: Escape with stolen profit @0.00001120
⚠️ Trading Alert: Police patrol = market volatility (news, events). Avoid fresh robberies during major announcements. Use trailing SL to protect your stash.
💖 If you vibe with this Thief Trading Style™, hit that BOOST 🚀 & LIKE ❤️ to power up the robbery crew.
Together, we rob the market, escape clean, and celebrate with champagne & profits. 🥂💵
📌 Disclaimer: This is a Thief-Style Robbery Plan, not financial advice. Rob responsibly.
SHIB - Give me anything and everything under 1200Ichimoku formed a green cloud through October, accumulating under 1200 slow and steady. Momentum was going well until the hack which through off longs. They've made adjustments and are repaying affected. 84T token left on exchanges, so in theory less selling pressure. Good luck!
SHIBUSD: looks bullishCOINBASE:SHIBUSD
This chart shows SHIB is going to explode higher very soon.
We are at almost end of the cycle, November or December is going to be the peak for BTC.
Alts can run a little longer after BTC peak.
Happy trading

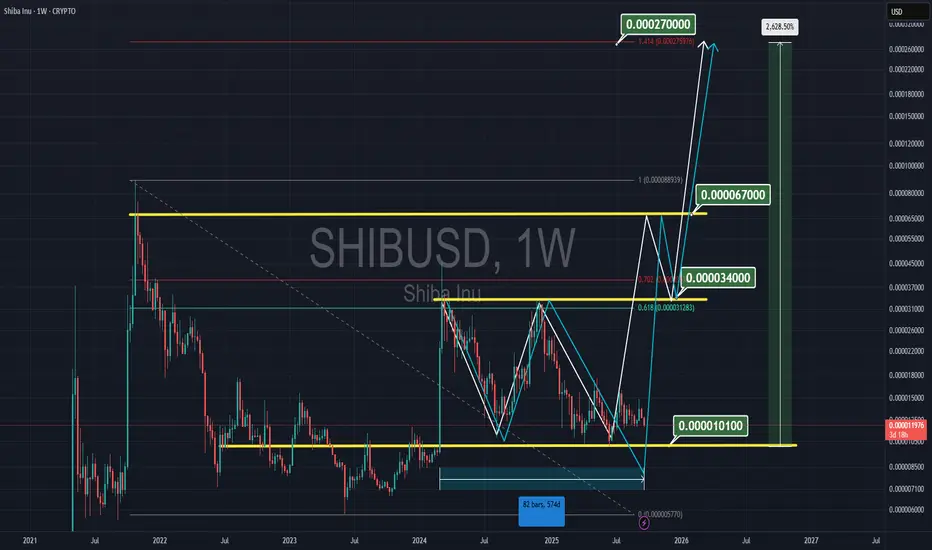
SHIBA TO $0.00027It's been 574 days; Shiba is trading between the 101 support and 34 resistance lines. I believe it's an accumulation zone, with a breakthrough imminent. My target is approximately 0.00027, at 1.4 of the Fibonacci.
SHIB/USD – Deep Sell-Off, Oversold Risks🔴 SHORT rallies under 0.0000128 – target 0.0000120
Shiba Inu trades at 0.00001208, far below SMA200 (0.00001279). Resistance: 0.00001304, support: 0.00001200. RSI at 28, oversold — risk of dead-cat bounce, but trend stays bearish below SMA200.
📖 Keywords: #SHIBUSD #ShibaInu #MemeCoins #CryptoDump

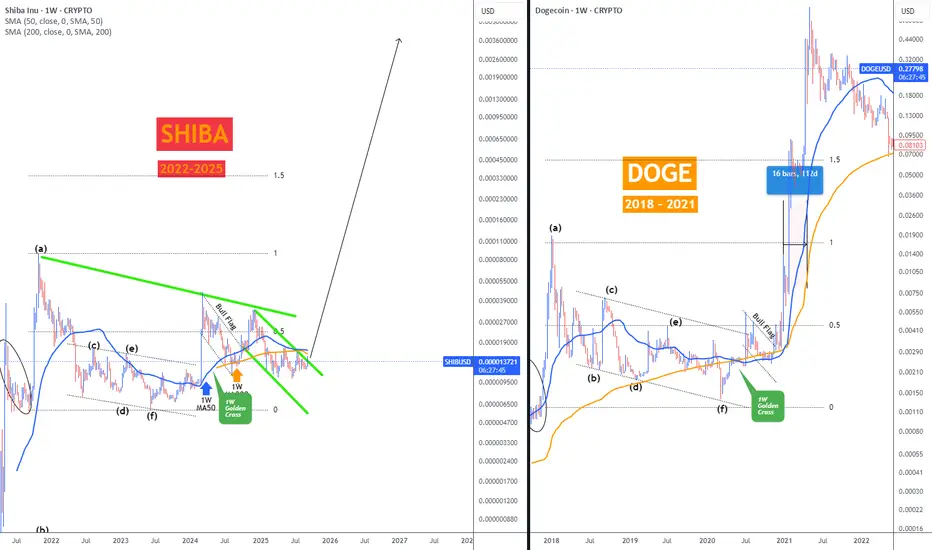
SHIBA following Doge FractalSHIBA following Doge Fractal and is in a descending channel. When it breaks SMA 200 a significant bounce will occur.
SHIB Q4 OutlookCRYPTOCAP:SHIB being an CRYPTOCAP:ETH ecosystem meme can benefit from gains in an ETH related rally in Q4, though mild returns are expected.
Blow-off fractal pattern expected finalizing some time in Q4.

SHIBUSD about to launch. Shiba Inu is showing signs of a price explosion! The weekly chart reveals strong support near 0.00001100, steady higher lows, and tightening consolidation. Once the price breaks above resistance and the long-term downtrend, bulls may send SHIB soaring.

(SHIB) shiba inu "array -> YTDs" fib-no-chiShiba Inu through the years based on concurrent array measures that act as a pseudo fibonacci kind of doodle. Nothing else to say. The price is not necessary to analyze so much as look at the picture and look at it. The price of Shiba Inu is still so very low, so low. Not enough three zeroes after the decimal.
Could the logo image of Shiba Inu ever become a different background color? Is the company locked in on always using red as the background color for Shiba Inu?

(SHIB) shiba inu "boxes" yearlyWhat's the deal with shiba inu? There is so much talk about it, yet the chart looks less than the comparison to what XRP looks like, for instance. XRP has a huge following, but so does Shiba Inu. Shiba Inu even has haters due to so many people talking about the revelation that Shiba Inu will win in the end. This year, Shiba Inu did not do much of anything unless you count all that has gone on with the website and the company. As for the chart graphs pictures, the look is one that feels like there could be a predictable end to the year brewing. Or is there?

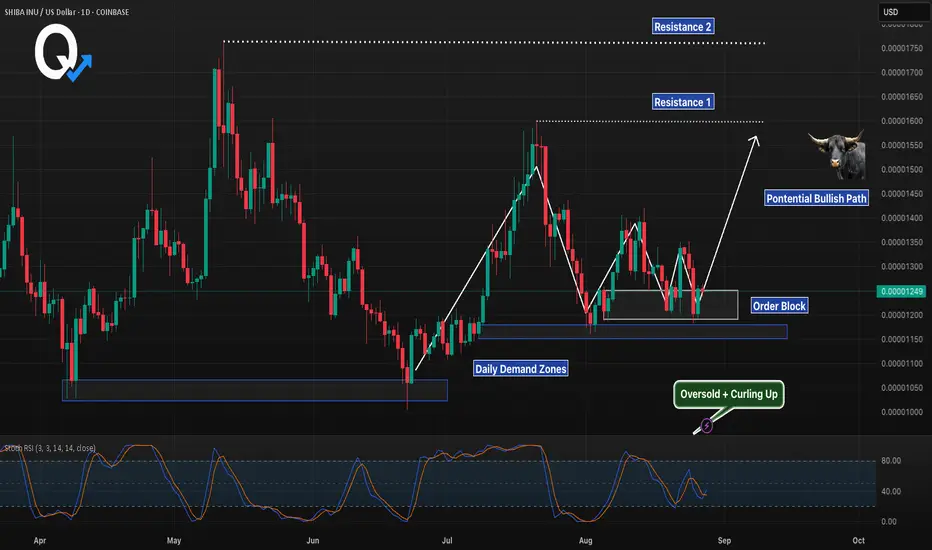
SHIB 1D – Demand Zone + Order Block SupportSHIB is consolidating around a key daily order block, sitting just above prior demand zones. This area has acted as a strong base for previous rallies, making it a critical support to watch.
Stoch RSI is oversold and beginning to curl upward, hinting at possible bullish momentum if buyers step in here. The immediate upside levels are marked by Resistance 1 and Resistance 2 — a breakout could open the path for continuation higher.
Key Levels:
Support: 0.00001200 (Order Block / Daily Demand)
Resistance 1: ~0.00001600
Resistance 2: ~0.00001750
The path is clear: hold demand and the order block for a potential bullish move, or lose it and risk another leg down.

SHIB Ready for PUMP or what ?The triangle pattern will break in the direction it is breached, and the price will move in that direction.
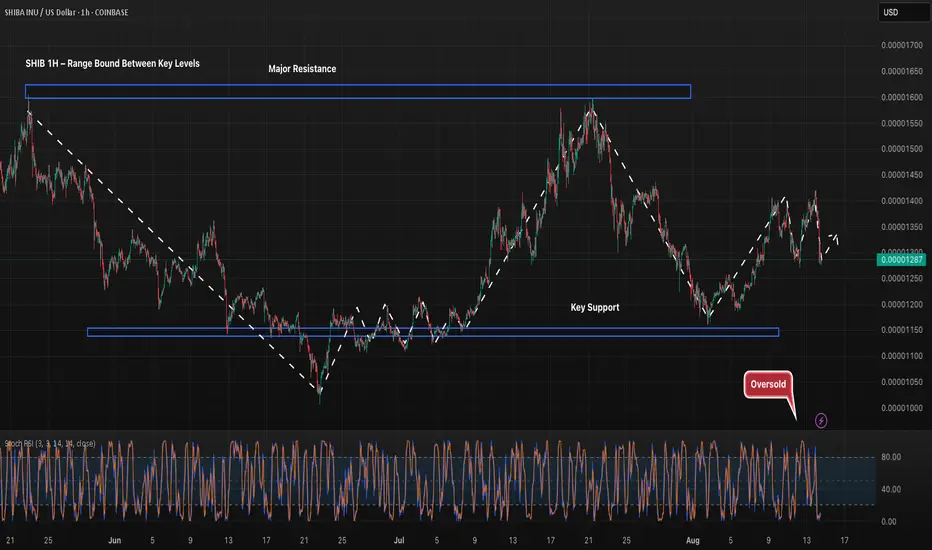
SHIB 1H – Range Bound Between Key LevelsShiba Inu’s 1H chart remains range-bound between the 0.00001600 resistance and 0.00001150 support. Price is currently sitting near 0.00001286 with Stoch RSI in oversold territory, suggesting a possible short-term bounce. A break above 0.00001350 could shift momentum toward the upper range, while a breakdown risks retesting the key support.
SHIB 4H – Approaching Apex Between Resistance and SupportSHIB is trading in a tightening range between its long-term descending trendline and the $0.0000100–$0.0000108 support zone. Price is nearing the apex, which could trigger a decisive move in the coming days. Momentum is neutral on the Stoch RSI, leaving both breakout and breakdown scenarios in play. A close above the trendline could target $0.000016+, while losing support risks a drop toward $0.0000085.

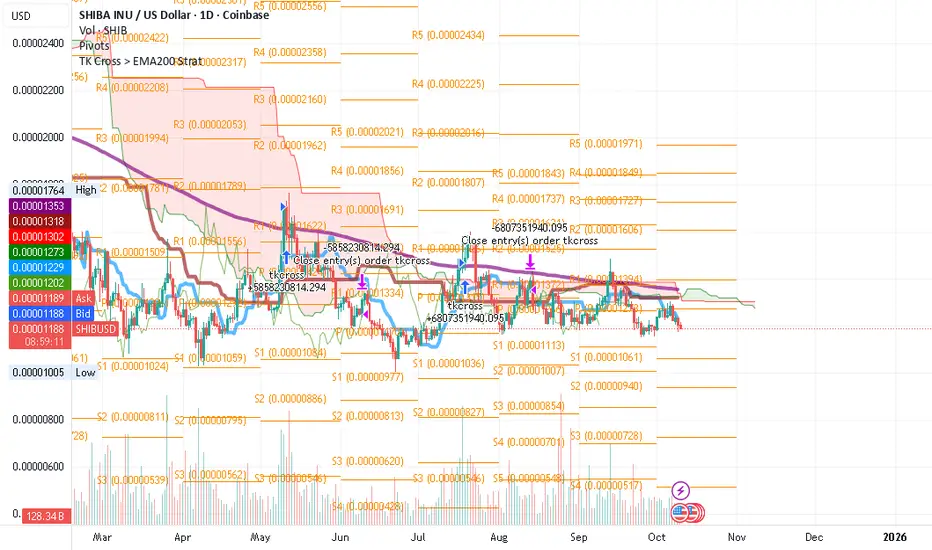
Trendline**SHIBA INU Price Action: Analyzing Support, Resistance, Trendlines & Moving Averages**
The chart for SHIBA INU/US Dollar reveals a fascinating technical landscape, packed with actionable insights for both short-term traders and longer-term followers of the meme token. Let’s break down the key takeaways and highlight why the trendline and the 50 EMA deserve your close attention right now.
### Key Technical Features from the Chart
- **Support & Resistance**: Current price action is navigating a well-defined value zone, with strong support at 0.00001190 and a dual resistance band between 0.00001240 and 0.00001252. These levels mark the boundaries where supply and demand have shown their influence in recent sessions.
- **Moving Averages (EMAs)**: Three exponential moving averages are at the forefront:
- **21 EMA** (yellow): Closely tracks the short-term price momentum.
- **50 EMA** (blue): Serves as a pivotal medium-term trend signal.
- **200 EMA** (orange): Represents the longer-term market sentiment.
- **Trendline**: An ascending trendline has captured the ongoing bullish momentum, connecting recent higher lows and acting as a tactical guide for potential pullbacks and rebounds.
### The Significance of the Trendline
Trendlines in technical analysis are not just lines—they are psychological levels. The current trendline on your chart is particularly notable because:
- It **visually confirms the market’s bullish intent** by consistently supporting higher lows.
- Each bounce from this trendline reflects renewed buying interest.
- If price were to break and close below this line, it would signal a weakening of ongoing bullish pressure, often preceding steeper pullbacks.
### Why the 50 EMA Is a “Line in the Sand”
The 50 EMA (blue line) is a classic barometer for shifting momentum:
- **If price holds above the 50 EMA:** It signals that the market is comfortable with higher prices and buyers remain in control. In a rising trend, this EMA repeatedly acts as dynamic support during pullbacks.
- **If the 50 EMA fails:** A firm break below the 50 EMA usually denotes a loss of medium-term bullish momentum. Historically, this leads to sharper corrections, with traders expecting tests of lower value zones or even the main support at 0.00001190.
### Bullish Breakout Potential—Watching Resistance
The resistance band (0.00001240–0.00001252) is where sellers have previously stepped in. This region is critical to monitor because:
- **A breakout above resistance**—especially on high volume—would confirm renewed bullish strength and could set the stage for a larger upside rally.
- This would signal that buyers have overwhelmed sellers, and in technical terms, “confirm” the bullish structure outlined by the trendline and rising EMAs.
### Conclusion
This technical setup offers a clear trading playbook:
- **Bullish Bias:** As long as price stays above the trendline and the 50 EMA, SHIBA INU maintains a strong bullish footing.
- **Bearish Risk:** Should the 50 EMA fail, expect deeper retreats—potentially towards the key support.
- **Breakout Signal:** Watch for a decisive daily close above resistance as a bullish confirmation.
By anchoring your analysis to these critical levels and indicators, you ensure that your trading decisions are grounded in objective technical evidence, maximizing your chances of success in SHIBA’s volatile market. (Some help from Perplexity AI)

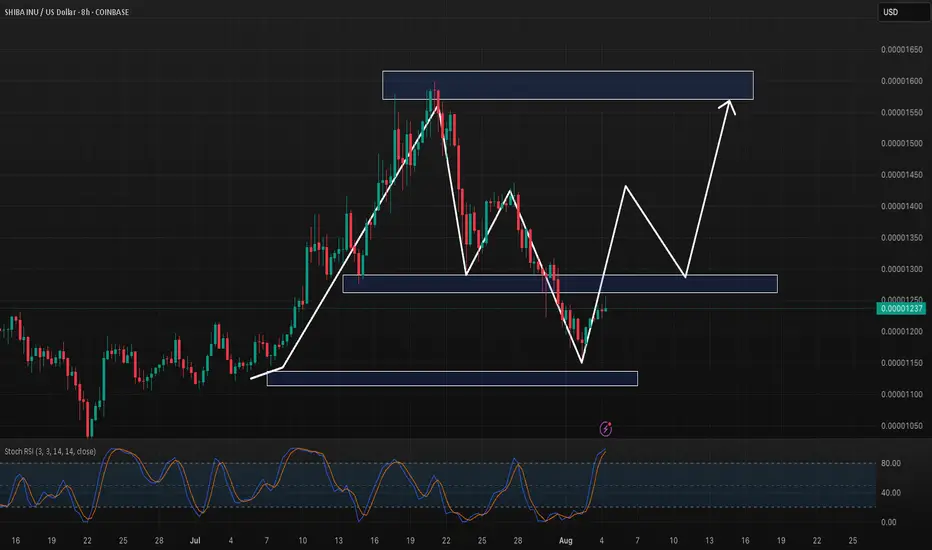
SHIB 8H – Double Bottom at Support, Breakout Structure Loading?HIB has just completed a clean double bottom off a major demand zone on the 8H timeframe, following a textbook impulse → correction → potential reversal sequence. Price structure shows clear symmetry, and the recent bounce aligns with a Stoch RSI reversal from oversold — building a strong case for bullish continuation.
With the key support at ~0.00001200 holding, the white projection shows a potential stair-step return to the upper resistance zone near 0.00001600.
🧠 Key Technicals:
– Major demand zone held strong (previous base of July breakout)
– Double bottom structure forming at support
– Stoch RSI flipped from oversold → confirms short-term momentum
– Clean risk-reward setup toward range high
If SHIB breaks above 0.00001350 with volume, it may trigger the second leg up in this recovery sequence.
Simple structure. Clear reaction. Now price just has to follow the plan.
👇 Comment if you’re in from the bottom, or waiting for confirmation.
Demand ZoneSHIB needs to break out of the downward parallel channel but right now it is below the midpoint of the channel and could be heading to the support of the channel; however the good news it has paused at a Demand Zone. The Bulls need SHIB to clear 0.00001241 and then 0.00001311(which is the midpoint of the parallel channel) SHIB needs to clear the Fibonacci Golden Zone for bullish activity.

SHIBUSD – Sneaky ReclaimerSHIB is mirroring DOGE, now breaking slightly above the 200 SMA at $0.000012056. RSI is above 56 and climbing — strength is building, though not explosive. Key test ahead at prior resistance levels.
