SHIB Long Entry Heist Plan – Bullish Setup in Trap Zone🦹♂️💸 SHIB INU Market: The Silent Heist Plan Is Live! 🚨💰
Thief Trading Style | Swing & Scalping Blueprint | High-Risk Zone Masterplan
🌍 Hello Global Robbers & Market Raiders! 🤑💥
Welcome to another secret mission straight from the vault of Thief Trading Style. We're eyeing the SHIB INU Crypto Market, and the time has come for a stealthy bullish strike!
🧠 The Blueprint – Operation SHIB-INU Break-In
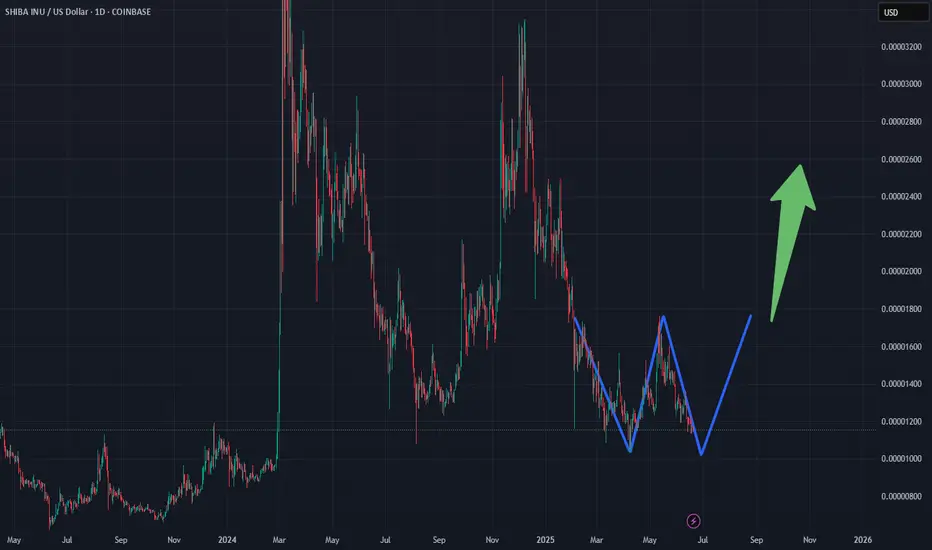
We’re executing a bullish move towards the Yellow MA Zone, a high-risk territory filled with consolidations, trap setups, and a potential reversal. The battlefield is tight, but the rewards are sweet for those who play it smart. 🎯💸
🔑 ENTRY STRATEGY – “Vault Access Granted” 🚪📈
💥 Entry Type: Buy/swing
💡 Zone: Pullback entries near swing lows (within 15–30m timeframes)
🕵️♂️ Stealth Entry – Wait for candle signals or limit orders near key liquidity zones.
🛡️ STOP LOSS – “Secure the Exit” 🛑🔐
📌 Placed just below recent swing low at 0.00001050 (30m TF)
🎯 SL adapts to your lot size, trade size, and number of entries.
🏴☠️ TARGET – “Escape Before Alarms Go Off” 🎯💨
💰 Target: 0.00001350
⏳ Optional: Trail your SL and exit on signs of exhaustion.
💼 Scalpers’ Side Mission – “Quick Loot Runs” 🧲⚡
Scalp only on the Long side; use trailing SLs and follow the robbers’ path.
Big wallets? Enter now. Small bags? Wait and follow the swing wave. 🕶️🚀
🧠 Strategic View
Market sentiment remains bullish, but the zone is volatile.
Use macro analysis, COT data, on-chain insights, and sentimental clues for confirmation. 🧠📊
⚠️ Important Notice – Market Hazards Ahead 📉📰
🔔 Watch out for major news releases!
✔️ Avoid new trades during high-impact events.
✔️ Use trailing SLs to guard profits.
✔️ Monitor market developments regularly – stay one step ahead.
💖 Support the Mission
If you love this robbery blueprint, 💥Hit the Boost Button💥 and join the Thief Trading crew for more profitable adventures! Every click fuels our next plan. 🏆💪❤️
📢 See You in the Next Raid!
Stay tuned for more high-stakes missions and daily loot setups!
📲 Follow for the next crypto break-in.
🐱👤🚨 Thief Traders never sleep... we scan, we strike, we secure the bag.
SHIBUSD trade ideas

SHIB - Meme Dogs On The MarchI made a video already today with 2 coin setups in great areas.
But here's a nice and simple high rank bone for TV'ers.
Nice contraction pattern.
Nice breakout.
Can go up and up from here 👍
Check my crypto video if you enjoy depth TA - linked to this thread.
Not advice.

Breach If SHIB closes below 0.00001038 on the weekly, that means the bears breached the value zone and the Bulls could lose a zero and if the bears march on the next stop would be 0.00000830.

WATCH SHIBThis could be setting up for a
nice rounded double bottom
pattern. Keep watch on SHIB
and I would strongly DCA in at
this key level. We could be
forming a very powerful W pattern
long term...So stay vigilant and
watch for the dips. Even if we went
to all time LOWS you would only be
down 48%...so suck it up and DCA
in at these levels. Trust me...you'll
thank me later when SHIB does an
800x buy end of this bull cycle. BAM!
********** HAPPY SHIB HUNTING **********
I am practicing so please dont judge me lolBut I truly believe this will occur, so I hope you have cash waiting on the sidelines because its almost time to jump back in

Stacking Shib and some other crap ERC20 tokens.It is time IMO to start stacking for the alt coin pumps.
here are a couple targets I have to sell 25% of my stack.
This is a risky play and could still take another year to work out????
NOT FINANCIAL ADVICE!!!!

Demand ZoneShib is consolidating in demand zone and near a key level.
Bulls need price to break out of the Demand Zone above 0.00001300 to hopefully 0.00001427.
If the Demand Zone fails bears can push price down to the 0.00001100 levels.
Be careful and have a nice day

SHIB Breaks Out – Time to Ride the Wave! 🔍 Chart Analysis Summary:
🔼 Trade Direction: Long (Buy)
⏱️ Timeframe: 30-Minute
🔔 Breakout Zone: Triangle breakout just confirmed
🟡 Entry Zone: Around 0.000012805 (shown with yellow circle)
🟥 Stop Loss: Below 0.00001214
🟩 Target Zone (TP):
TP1: 0.000013620
TP2: 0.000014205
TP3: 0.000015037
📊 Risk-to-Reward Estimate:
Risk: ~11.74% (clearly shown)
Reward Potential: Up to 2x or more based on targets

Shiba INU - Bottom Buy confirmed istorical Pattern Repetition (2024 & 2025):
The chart suggests that SHIB is following a repeated pattern cycle:
Stage 1 – Falling Wedge (Completed)
Stage 2 – Cup and Handle (Completed)
Stage 3 – W Pattern (Recently Completed)
Stage 4 – Inverted Head and Shoulders (Pending Formation)
Key Highlights:
✅ Buying Zone Identified between 0.00001167 – 0.00001271 USD.
🎯 New Target: 0.00002431 USD, representing a potential 90% return from the buying zone.
⚠️ Breakout Awaited: Stage 4 pattern (Inverted Head and Shoulders) is pending confirmation, which could trigger a major upward move.
🔄 Emphasis on pattern repetition to project future price action.
Conclusion:
The chart analysis suggests that SHIBA INU is mirroring its previous bullish cycle. With three bullish stages already complete and the fourth (inverted head and shoulders) pending, a breakout could lead to a significant price rally targeting 0.00002431 USD.

"Shiba Inu (SHIBUSD) – 4H Triangle Formation and Price StructureSHIBUSD – 4H Technical Chart Analysis
Price recently broke down from a triangle pattern after consolidating near key resistance. A potential retest of the breakdown zone around 0.00001396 is possible before continuing toward the support level near 0.00001041.
Major levels:
🔹 Resistance: 0.00001396
🔹 Support/Target Zone: 0.00001041
The chart highlights structure zones, support/resistance, and triangle pattern behavior on the 4-hour timeframe.
🟡 This content is for educational and informational purposes only. It does not constitute financial advice or a trading recommendation. Always DYOR (Do Your Own Research).

Shiba break outShiba Inu has been in a sideways trend for a year or so. That is about to end.
Technical analysis shows the linear regression downward trend is coming to an end, and we are in the bottom 25% of the Fibonacci Bollinger bands, indicating trade entry here is low risk. The moving average is heading toward the 3-year pivot highlighted in thick yellow. This will be the catalyst to move the price significantly upward. Target is 0.00006

Trend line and Consolidation SHIB at this time is forming a double bottom in a parallel channel on the daily. It's also on an upward trend line and recently made Higher Highs and Higher Lows. However, it is still under the 200 EMA 0.00001602(in orange). If SHIB falls below 0.00001410 and makes a clear break of the downward trendline we might test the Demand Zone around the 0.00001260- 0.00001290 range. Please be careful of fakeouts and liquidation in either direction. Have a nice day.

TightSHIB is moving in a tight channel between 0.00001414 and 0.00001498 on the bottom of a parallel structure on the day chart, and a bearish breakout can possibly take it out of the channel to the 0.00001290 price range but a bullish breakout can possibly take it to the 0.00001700 price range. Please be careful and watch out for fakeouts.

SHIB/USD (Shiba Inu vs US Dollar)!🟢 Trade Type: Long (Buy Setup)
Pair:
Timeframe: 30-Minute Chart
Current Price: 0.000015069
🔍 Technical Setup
Pattern: Ascending triangle breakout (bullish pattern)
Entry Zone: Right after breakout and retest of the triangle top (highlighted yellow circle)
Momentum: Strong bullish move from lower support, clean higher lows
🎯 Targets & Stop-Loss
Take-Profit (TP):
TP1: 0.000015300 (minor resistance)
TP2: 0.000015530 (major resistance / range top)
Stop-Loss (SL):
Below trendline / triangle bottom: ~0.000014650
⚖️ Risk-to-Reward (R:R):
R:R Ratio: ~2:1
Well-balanced setup with tight stop and breakout confirmation
🧠 Trade Logic
Breakout of ascending triangle confirms bullish momentum
Strong demand zone below (0.00001465) acts as support
If price holds above 0.00001500, further upside likely

2 Day 21 EMAThe candle completes printing Sunday night.
If we get a bullish candle on the 21 EMA, SHIB holders have hope, if price does not claim 0.00001402 region we can see prices go below to 0.00001300. But so far as of this time, we have price forming a hammer at the 21 EMA and at the support of an upward parallel channel and on the 0.00001414 key level. Be careful and watch out for a reversal or a drop or fluctuation.

ConfluencesSHIB needs to break out of the parallel channel and cleanly reject the 200 EMA(orange) to not go bearish on the 4 HR TF. If it fails 200 EMA it can possibly go to .00001300 area

SHIB New Update/Roadmap (3D)The correction for this coin started from the point where we placed the red arrow on the chart.
The price appears to be inside a Triangle or Diametric, nearing the end of wave D.
The green zone is a low-risk rebuy area.
There is a liquidity pool on the chart, which we expect to be swept soon.
Targets are marked on the chart.
A weekly candle close below the invalidation level will invalidate this analysis
For risk management, please don't forget stop loss and capital management
When we reach the first target, save some profit and then change the stop to entry
Comment if you have any questions
Thank You

"SHIBUSD Long Setup – Falling Wedge Breakout in Play!" Trade Analysis:
Chart Pattern: Falling wedge breakout (bullish reversal)
Entry: Around 0.00015111 (at or near breakout zone)
Stop-Loss: Just below recent swing low (~0.00014500 zone)
Target Zones:
📌 TP1: ~0.00015500 (local resistance)
📌 TP2: ~0.00015682 (next key level)
📌 TP3: ~0.00015993 or higher
📊 Confirmation Factors:
Breakout candle with volume
Previous support zone respected
Clean risk-to-reward ratio (clearly marked in chart with green & red boxes)

SHIB to pop 400% very soon.SHIB appears poised for a potential breakout, mirroring XRP's historical price action. After consolidating for approximately 1,000 days, SHIB has reached a key Fibonacci time extension (1.618), a significant technical milestone often associated with trend reversals. The chart structure shows similarities to XRP before its major rally to previous highs, suggesting a possible repeat scenario.
On the daily timeframe, SHIB is forming an inverse head-and-shoulders pattern, a bullish reversal setup indicating potential upward momentum.
As a "forgotten" meme coin, SHIB could see renewed interest, especially with positive ecosystem developments like Shibarium upgrades, token burns, and new token launches (TREAT and SHI), which may act as fundamental triggers. The diminishing exchange supply and broader market sentiment (e.g., a Bitcoin super-cycle) could further support a rally, similar to XRP’s unexpected surge on positive news.

Long Trade Setup – SHIBUSD!📈
🔹 Asset: Shiba Inu (SHIB/USD)
🔹 Timeframe: 30-Minute Chart
🔹 Setup Type: Falling Wedge Breakout (Bullish Reversal)
📌 Trade Plan (Long Position)
✅ Entry Zone: Around 0.00001543 (Potential breakout + trendline support)
✅ Stop-Loss (SL): Below 0.00001500 (Support zone & wedge invalidation)
🎯 Take Profit Targets
📌 TP1: 0.00001599 – Recent consolidation resistance
📌 TP2: 0.00001648 – Trendline resistance breakout target
📌 TP3: 0.00001705 – Swing high
📊 Risk-Reward Calculation
📉 Risk: 0.00001543 - 0.00001500 = 0.00000043
📈 Reward to TP2: 0.00001648 - 0.00001543 = 0.00000105 → R:R = 1:2.44
📈 Reward to TP3: 0.00001705 - 0.00001543 = 0.00000162 → R:R = 1:3.76 ✅
🔍 Technical Highlights
📌 Falling wedge pattern signaling possible bullish reversal
📌 Price bouncing from trendline and minor horizontal support
📌 Confluence of wedge apex and demand zone = strong entry point
📌 Breakout potential increases if candle closes above wedge
📈 Execution Strategy
📊 Enter near 0.00001543 after bullish candle confirmation
📉 SL below 0.00001500 to limit downside risk
💰 Book profits partially at TP1, trail rest to TP2/TP3
🚨 Invalidation Risk
❌ Clean break below 0.00001500 = Exit trade
❌ Sharp rejection from 0.00001599 zone = Reassess
🚀 Final Take
✔ Oversold bounce + wedge = smart long setup
✔ High R:R with tight risk window
✔ Watch volume + close for entry confirmation

Long Trade Setup – SHIBUSD (Shiba Inu / USD)!📈
Timeframe: 30-Minute Chart
Pattern: Symmetrical triangle breakout (bullish continuation)
📌 Trade Plan
📍 Entry: Around 0.00001602 (Confirmed breakout zone)
🛑 Stop-Loss (SL): Below 0.00001566 (structure invalidation)
🎯 Take Profits:
TP1: 0.00001649 – Minor resistance
TP2: 0.00001705 – Measured move target
🔍 Technical Highlights
Price respecting uptrend support line
Formed a tight triangle, broke upward with bullish candle
Higher lows show buying strength
Clean risk-reward:
🔻 Risk: 0.00001602 – 0.00001566 = 0.00000036
🔺 Reward to TP2: 0.00001705 – 0.00001602 = 0.00000103 → R:R ≈ 1:2.86
🚨 Trade Notes
Wait for candle close above yellow resistance zone
Avoid chasing if breakout fails with low volume
Let position run partial to TP2 if momentum holds

A break and a consolidatonSHIB broke it's upward trendline, but did not commit to a change of character to say it is in a downward trend; however it is delicately balanced between an Anchored VWAP below and 10 EMA on top. If it breaks this consolidaton downward we could possibly have price action towards 0.00001162 area, but if we break the 10 EMA we could have price action towards to 0.00001358.
10 EMA 0.00001300.
Anchored VWAP 0.00001254.

SHIBUSD – Long Setup with 3.6R and Momentum ShiftSHIB just broke out of consolidation with bullish MACD momentum and support from the Ichimoku cloud. I’m long with a 3.6 risk/reward, targeting a move back toward 0.00002129 and above. Entry at 0.00001327, stop at 0.00001032, targeting 0.00002406. RSI is recovering from oversold, and the chart structure shows higher lows—early signs of trend reversal.
Follow for updates as this unfolds—SHIB could be waking up.
