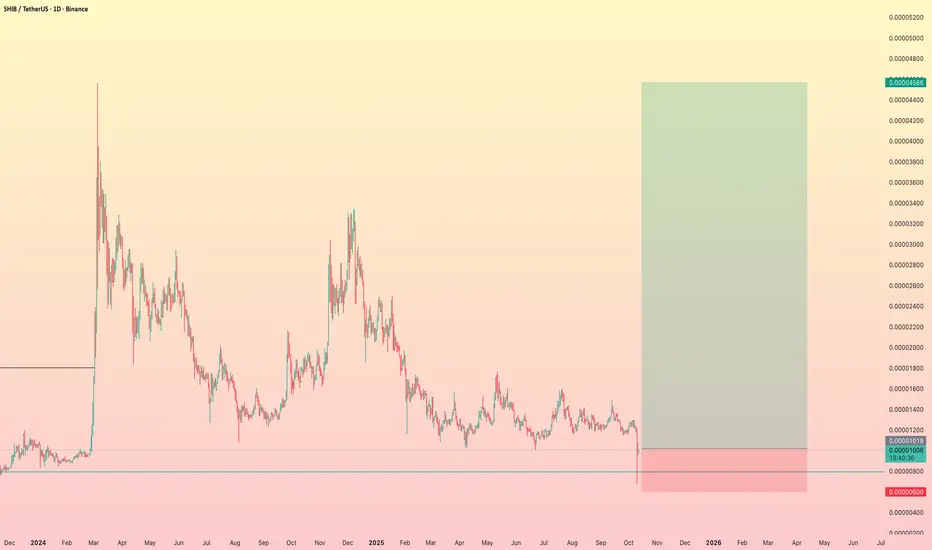
Lingrid | SHIBUSDT Sideways Break Lower ExpectedBINANCE:SHIBUSDT is trading below the confluence of the descending trendline and the former support, following a clear rejection and sell-off from the 0.0000148–0.0000136 resistance band. Structurally, price remains in a downward channel with a sequence of lower highs/lows after failing out of a short upward channel. If price stays capped beneath ~0.00001100, I favor continuation lower toward the channel base and 0.00000865 support; a decisive reclaim above 0.00001136 would soften the bearish view. Broader momentum is still negative, with repeated rejections and lower lows confirming downside pressure consistent.
⚠️ Risks:
A sustained break back above 0.00001108–0.00001136 could flip the near-term structure and force a squeeze toward 0.0000125–0.0000136.
Broad crypto strength or a sharp BTC rebound can invalidate downside continuation and lift CRYPTOCAP:SHIB with beta.
Headlines or liquidity spikes around memecoins may trigger erratic wicks that pierce the channel before direction resumes.
If this idea resonates with you or you have your own opinion, traders, hit the comments. I’m excited to read your thoughts!
Trade ideas

SHIBUSDT this dead and sleep coin always move lateThe asset has been consolidating within a well-defined, prolonged trading range for an extended period, exhibiting low volatility and diminished trading volume. While this can test a trader's patience, such periods of compression are often the precursor to a significant directional move, as energy accumulates within the range.
Our technical analysis suggests a growing probability of an eventual resolution to the upside. The critical technical level that will confirm this bias is a decisive breakout and sustained close above the upper boundary of this multi-year range.
Upon a confirmed breakout, the initial objective would be a retest and subsequent breach of the key descending trendline (marked in red). A successful break above this dynamic resistance would serve as a powerful secondary confirmation of a major trend reversal. This sequence of events—range breakout followed by trendline breakout—would likely catalyze a strong bullish impulse, generating the momentum required to propel the asset toward our primary technical targets as outlined on the higher timeframes.
DISCLAIMER: ((trade based on your own decision))
<<press like👍 if you enjoy💚

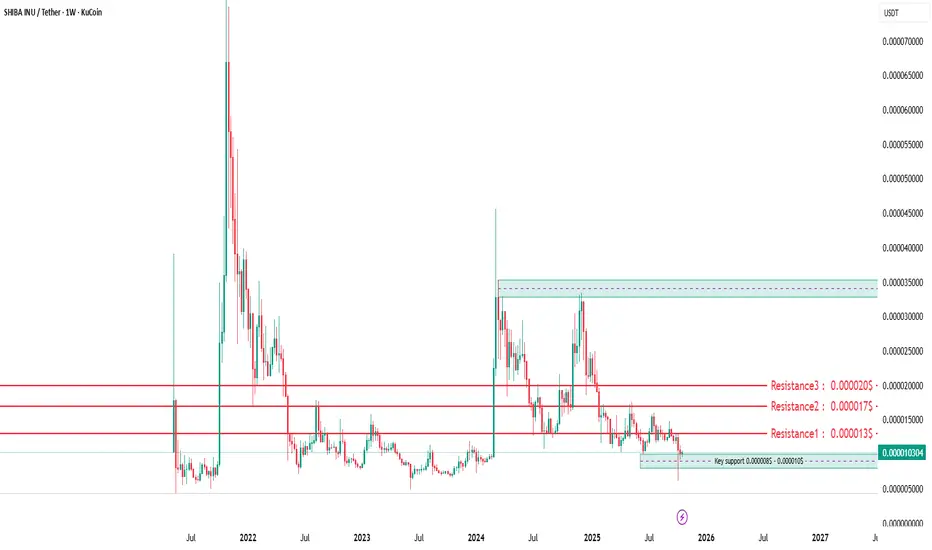
Shiba Inu (SHIB/USDT) Technical Overview (Weekly Timeframe)Shiba Inu is still in a long-term accumulation phase, moving sideways after its huge 2021 spike. The price has been consolidating between 0.000006 and 0.000018 for almost two years.
Key Observations:
Major Support Zone: 0.000008–0.000009 — this is the area where long-term buyers usually step in.
Resistance Zone: 0.000017–0.000020 — strong selling pressure every time price touches this zone.
The chart shows multiple “mini-rallies” that failed to hold above resistance — a typical pattern before a breakout.
Volume is relatively low but steady, indicating smart money accumulation at the bottom.
If SHIB breaks and holds above 0.000012, the next key target zone is 0.000017–0.000020, followed by 0.000028 in a strong bullish wave.
📊 Short-Term (Daily Timeframe)
Currently, SHIB is hovering around 0.000010, very close to a historical support level.
Technical Insights:
The market has printed several long wicks to the downside, showing buyers defending the support zone.
A descending triangle seems to be forming — which can break either way, but considering the low volatility, the probability of a false breakdown then a sharp recovery is high.
RSI is near oversold territory, and momentum is flat → potential energy buildup for a move.
Important Levels:
Support: 0.0000095 – 0.0000100
Immediate Resistance: 0.0000125
Breakout Confirmation: Above 0.0000130 (strong volume required)
🚀 Possible Scenarios
Scenario Description Targets
🟢 Bullish Reversal Bounce from 0.000010 + breakout above 0.000013 0.000017 → 0.000020 → 0.000028
🔴 Bearish Continuation Break below 0.000009 0.000007 → 0.000006
⚪ Neutral Range Sideways between 0.000009–0.000012 Accumulation phase continues
💬 Summary (for showing off 😏)
“SHIB is sitting on a long-term accumulation zone around 0.000010. Price compression and flat momentum suggest a big move is coming — a breakout above 0.000013 could start a new rally toward 0.00002 and beyond.”
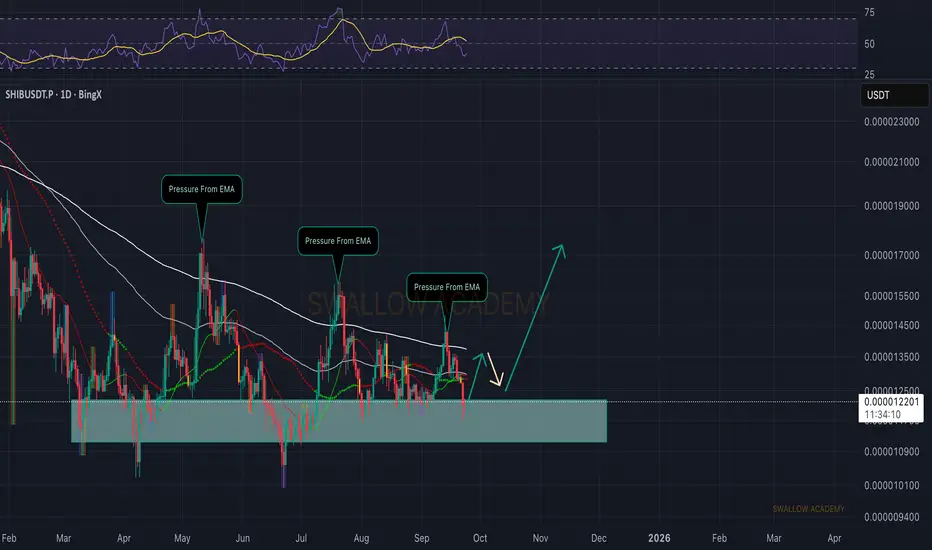
Shiba Inu (SHIB): Expecting Bounce Towards The EMAsAfter that sharp dip, SHIB has now created a visible gap that would be an ideal area to get filled. We’re sitting right at a strong demand zone, so a bounce from here looks likely.
The expectation remains for price to push back up for a re-test of EMAs — that would both fill the unfilled gap and give us a clear view on whether buyers are ready to regain short-term control.
Swallow Academy
Shiba still lives !!!As I mentioned in our previous analysis, Shiba could seek this strong buying region
It is a very strong zone, but it has a very large supply, it needs a lot of demand to break the zones above, but if this happens, an upward movement can begin.
Be alert in areas marked for possible high climbing
Become a part of our Forex Dream community

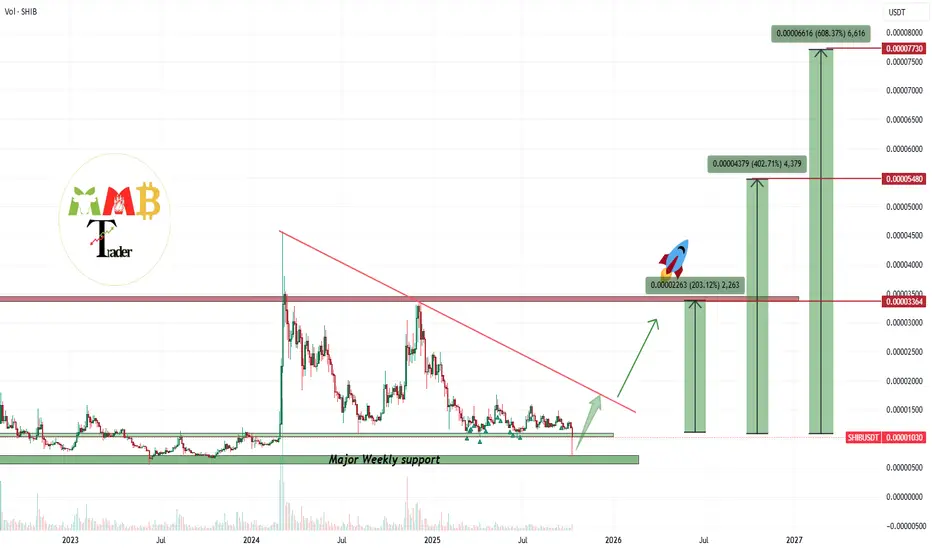
SHIBUSDT best buy zone did touch and it is time for pumpAs we can see on the chart too major weekly support did touch after a months of range and price which was actually dead and i think this is one of the best sign of bull future for market and also for token like CRYPTOCAP:SHIB which now gain enough power to pump easy 2-3X.
Notice: my personal view about that red reject candle in market the news did dump price but now one expect dump like that and i think this was market manipulation before something big which is coming and was cooking and this liquidation was needed to hunt and kick all traders with leverage even those smart one with low leverage on alts.
DISCLAIMER: ((trade based on your own decision))
<<press like👍 if you enjoy💚
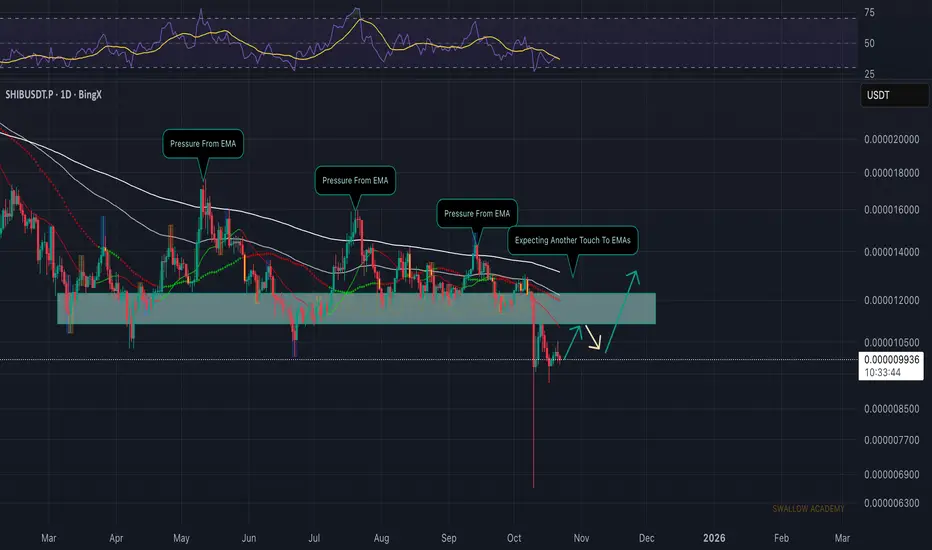
Shiba inu (SHIB): Still Looking For Breakout | Bullish AFSHIB moved exactly like we expected—bounced from the support zone and found pressure again from the 200 EMA. Price is still stuck in between the two, showing how this range keeps controlling the short-term movement.
As long as buyers keep defending this support, we’ll be watching for a clean reclaim above the EMAs to confirm a momentum shift and open the way for a stronger push up. The game plan remains the same.
Swallow Academy

SHIB Faces Sell Pressure On the daily chart, Shiba Inu (SHIB) shows continued weakness as the Chaikin Money Flow (CMF) indicator stays below the zero line.
This reflects sustained capital outflows and strong selling pressure, suggesting that sellers continue to dominate the market.
Such negative momentum readings typically hint at fading bullish strength and raise the risk of a breakdown below key support levels if buy-side demand doesn’t return soon.

Shiba Possible discharge soon!!!Shiba is coming from a long-term consolidation period, it should test the top and seek liquidity below to gain momentum to rise.
It depends a lot on the Crypto Scenario, Bitcoin is on a significant rise that can drive this movement, it will not be an easy breakout that has a lot of selling pressure above it
But be aware of the regions where it can seek this liquidity in the buying zone.

#SHIBUSDTDate: 06-010-2025
#SHIBUSDT
Current Price: $0.25614
Pivot Point: $0.25016 Support: $0.22952 Resistance: $0.27100
Upside Targets:
--------------------------------
| Target | Price |
---------------------------------
| 🎯 Target 1 | $0.29956 |
| 🎯 Target 2 | $0.32812 |
| 🎯 Target 3 | $0.35736 |
| 🎯 Target 4 | $0.38659 |
Downside Targets:
| 🎯 Target 1 | $0.20086 |
| 🎯 Target 2 | $0.17220 |
| 🎯 Target 3 | $0.14297 |
| 🎯 Target 4 | $0.11373 |
#Tradingview #BTC #Crypto #Sol

Shiba Strong Consolidation Region Shiba has been consolidating since February in this price range, it is tapering towards a possible structural break
There is a strong buy zone below tapering to test an LTB
Breaking this region has the possibility of testing this upper part of the accumulation zone. Bitcoin can boost this movement by breaking new ATHs.

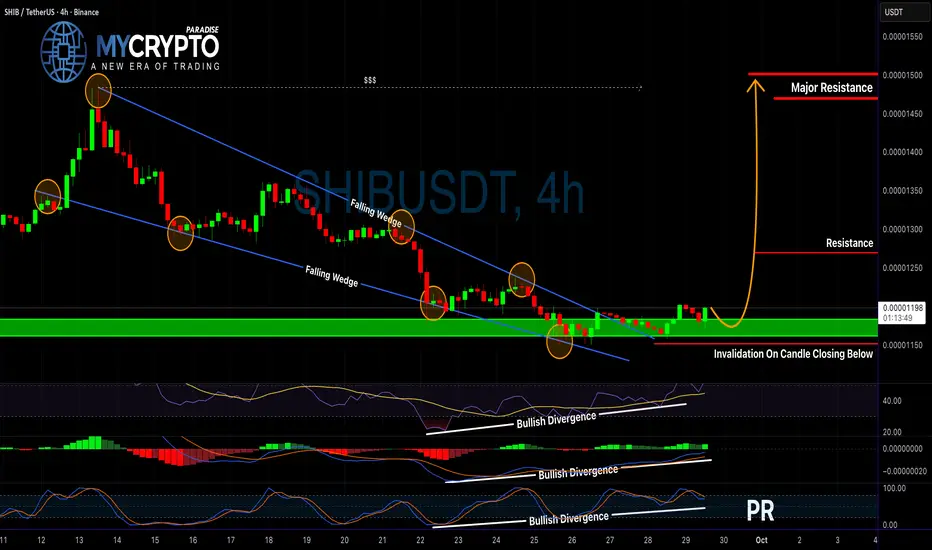
Is SHIB About to Explode or Collapse? Read Before It’s Too LateYello Paradisers! Are you paying attention to SHIB right now? Because this could either be the start of a massive bullish breakout — or the trap that wipes out impatient traders.
💎SHIBUSDT is showing strong potential after breaking out of a falling wedge pattern, which is a classic bullish reversal setup. What makes this move even more convincing is the presence of bullish divergence on the RSI, MACD, and Stochastic RSI — all of which are aligning to support a potential move to the upside.
💎From the current price level, after a proper retest of the support, the setup is still offering a favorable 1:2 risk-to-reward ratio, which is solid for short-term traders.
💎If you’re aiming for even larger risk-to-reward opportunities, you could wait for a more defined retest to enter with tighter risk parameters. However, this comes with the risk of missing the move entirely if the market doesn’t offer that second chance.
💎But here's the key — if the price breaks down and closes below the invalidation level, this entire bullish idea becomes invalid. In that case, it’s much smarter to step back and wait for cleaner price action and a higher-probability setup to form.
💎Discipline always beats impatience.
🎖Strive for consistency, not quick profits. Treat the market as a businessman, not as a gambler. That’s the only way to make it far in your crypto trading journey. Be a PRO.
MyCryptoParadise
iFeel the success🌴
SHIBUSDTBINANCE:SHIBUSDT is now in first reaction to uptrend. I wait for pullback to breakout.
Please control risk management.⚠️

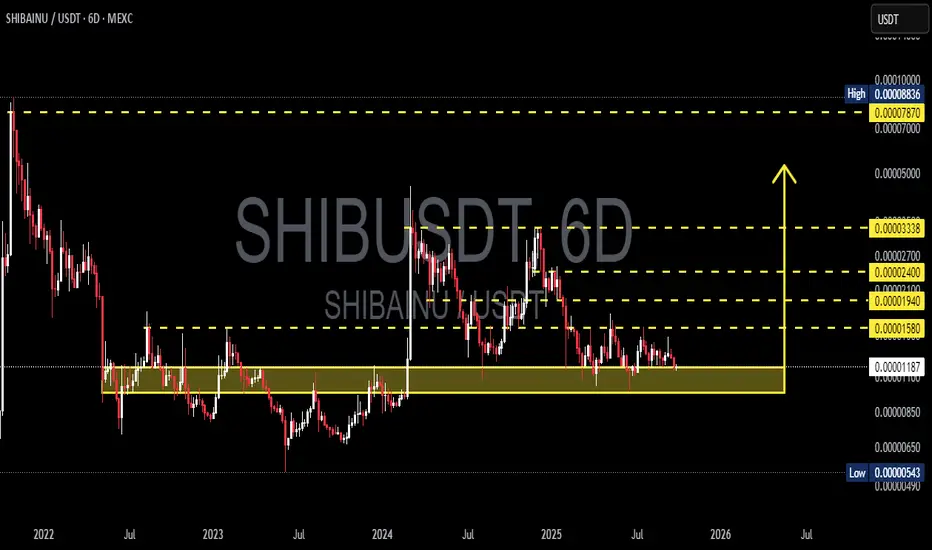
SHIBUSDT — A Major Move Will Be Decided From This Critical Zone!Overview
The 6D chart of SHIB/USDT shows a long-term consolidation that has been developing since 2022. Price is once again testing the key demand zone (0.00000850 – 0.00001183), an area that has acted as a strong support multiple times.
This zone is now a true “make or break level” — either SHIB rebounds for a major bullish wave, or it breaks down to much lower levels.
---
Structure & Price Pattern
1. Macro Downtrend
Since the ATH, SHIB has been printing lower highs, showing long-term seller dominance.
Yet, despite selling pressure, the demand zone has held — a sign that large buyers still exist here.
2. Extended Accumulation Zone
The yellow area (0.00000850 – 0.00001183) has acted as a base of accumulation since 2022.
Such prolonged consolidation often precedes explosive moves.
3. Clear Supply Levels
Resistance levels above price:
0.00001580 (initial breakout trigger)
0.00001940 → 0.00002400 → 0.00003338 (progressive bullish targets)
Major supply cluster at 0.00007870 – 0.00008836, which could be a magnet in case of a macro bullish reversal.
4. Volatility Contraction → Imminent Big Move
The 6D candles show a tightening range.
Classic signal of volatility compression, usually followed by a strong breakout or breakdown.
---
Bullish Scenario
Confirmation:
A breakout and 6D close above 0.00001580 with strong volume.
Targets:
0.00001940 → 0.00002400 → 0.00003338.
Ideal sequence:
Accumulation at support → breakout above resistance → retest as new support → rally continuation.
Reward potential: High risk-to-reward setup if the demand zone holds.
---
Bearish Scenario
Confirmation:
A breakdown below 0.00000850 with high volume.
Targets:
First: 0.00000543,
Then: potential new lows if liquidity is drained.
Risk:
If support fails, SHIB could enter a capitulation phase with accelerated downside.
---
Market Interpretation
Optimistic Buyers: See this as a long-term accumulation opportunity.
Cautious Sellers: A breakdown could trigger a steep sell-off.
Neutral Traders: Waiting for confirmed breakout/breakdown before committing larger positions.
---
Conclusion
SHIB is sitting at a critical zone that will define its macro direction into 2025–2026.
Holding support → opens path for multi-level rally.
Losing support → risk of deeper correction.
For long-term investors, this is the area to watch closely.
For swing traders, waiting for clear confirmation is the safer strategy.
---
#SHIB #SHIBUSDT #CryptoAnalysis #TechnicalAnalysis #SupportResistance #CryptoTrading #PriceAction #Accumulation #BreakoutSetup
SHIB/USDT — Burn & Exchange Reserves Hit Record LowShiba Inu burned 8.8M SHIB last week, while exchange reserves fell to their lowest since 2023. This suggests accumulation, reducing sell pressure. Price is testing support at 0.00001168.
Key Levels
• Resistance: 0.00001269, 0.00001278 (100MA), 0.00001295 (200MA)
• Support: 0.00001168, 0.00001129
Indicators
MACD still negative but shows narrowing gap → seller pressure weakening.
Trading Scenarios
📈 Long above 0.00001269 → 0.00001295 (SL: 0.00001150)
📉 Short below 0.00001168 → 0.00001129 (SL: 0.00001220)
⸻

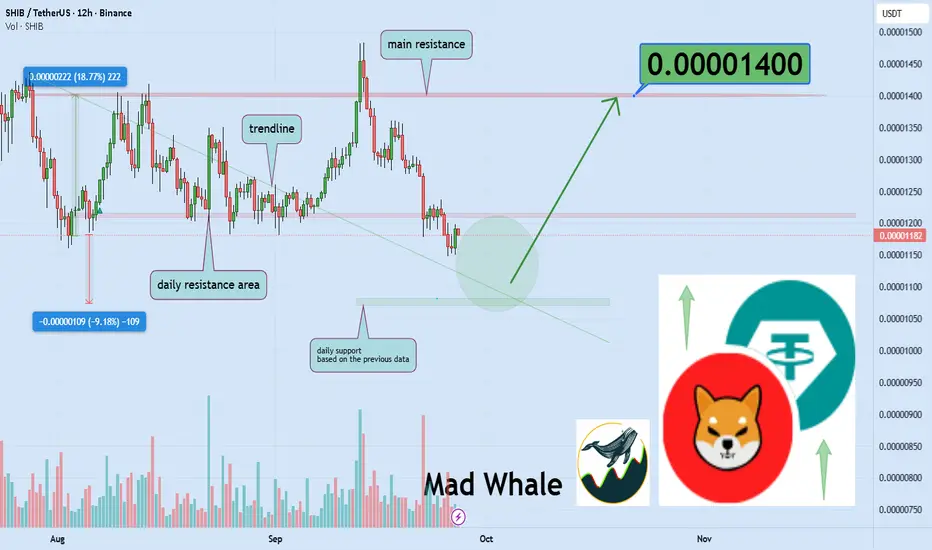
Will Shiba Inu bounce 18% from this key support level? Hello✌️
Let’s analyze Shiba Inu’s price action both technically and fundamentally 📈.
🔍Fundamental analysis:
Shiba Inu plans AI features and a new Layer-3 in July 2025 to cut costs and scale better.
If users adopt fast, SHIB could see demand grow like past upgrades.
📊Technical analysis:
BINANCE:SHIBUSDT is approaching a critical daily support level along a solid trendline; if this zone holds, a potential upside of 18% toward $0.000014 could unfold. 📈🚀
📈Using My Analysis to Open Your Position:
You can use my fundamental and technical insights along with the chart. The red and green arrows on the left help you set entry, take-profit, and stop-loss levels, serving as clear signals for your trades.⚡️ Also, please review the TradingView disclaimer carefully.🛡
✨We put love into every post!
Your support inspires us 💛 Drop a comment we’d love to hear from you! Thanks, Mad Whale
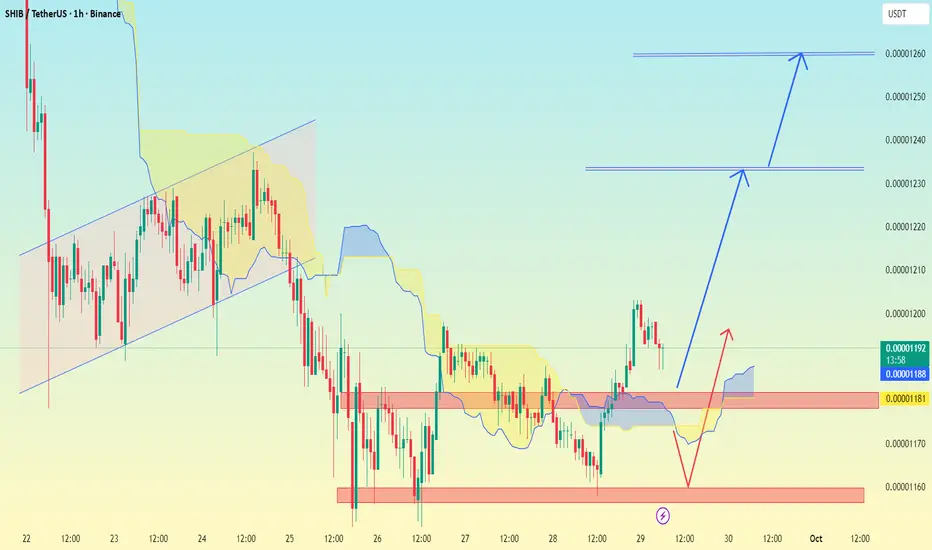
SHIB/USDT 1H chart Pattern.SHIB/USDT 1H chart, I see already marked possible targets with blue arrows. Based on the chart structure:
Immediate support zone: around 0.00001180 – 0.00001188 (red box).
Upside potential:
First target (short-term): 0.00001230
Second target (next level): 0.00001260
So the expected move is:
If SHIB holds above 0.00001180, bullish momentum can push it first to 0.00001230, and if that breaks, then toward 0.00001260.
If it breaks below 0.00001180, price could retest the lower support zone near 0.00001160.
📌 Summary:
Bullish target 1 → 0.00001230
Bullish target 2 → 0.00001260
Support to watch → 0.00001180 / 0.00001160
24% Profit A trendline has been broken and now targets 0.00001460, indicating a 25% profit for long positions.

SHIB/USDT: Bearish Momentum Builds Below Key ResistanceSHIB/USDT has rejected resistance at 0.00001361, extending its bearish momentum back into the 0.00001230 support zone. Price action is developing a corrective structure within the channel, following a failed breakout attempt.
If the 0.00001230 support level breaks, the next downside target is around 0.00001100, where a potential buying area sits. Broader momentum remains bearish, with sellers in control as long as resistance continues to cap rallies.

SHIBUSDT DEAD MARKET here do not bring profit for holders YetPrevious time i remember we had dead market like this but suddenly it start panic pump and every one bought SHIB on their wallets or regrets not having it before pump so this boring market remind me of 2021 crazy 10x and soon it may repeat now and this time i would say 3x is also would be fine and price now is near weekly supports and one of the best places to add some long in this dead market.
DISCLAIMER: ((trade based on your own decision))
<<press like👍 if you enjoy💚

Lingrid | SHIBUSDT Possible Monthly Support RetestBINANCE:SHIBUSDT rejected resistance at 0.00001361 and extended its bearish momentum back into the 0.00001230 support zone. Price action is forming a corrective structure inside the channel after a failed breakout attempt. If the 0.00001230 level gives way, downside targets align with the 0.00001100 where there is buying area below. The broader momentum shows sellers in control as long as resistance caps rallies.
⚠️ Risks:
A sudden bounce above 0.00001231 could trigger a squeeze toward 0.00001360.
Broader crypto market recovery could reduce bearish pressure.
Increased whale accumulation near 0.00001100 may limit downside extension.
If this idea resonates with you or you have your own opinion, traders, hit the comments. I’m excited to read your thoughts!

Shiba Inu (SHIB): Expecting For Breakout From EMAsSHIB is once again holding inside the support block, even after repeated pressure from the EMAs that keep pushing the price lower. What stands out is how buyers have defended this zone multiple times, leaving long wicks that show clear absorption of sell-side attempts.
The current compression between EMAs and support makes this zone critical—either buyers finally secure it for a bigger push up, or another liquidity sweep happens before continuation.
Swallow Academy