$SIGN looking ready for a breakout, should push above resistanceSIX:SIGN looking ready for a breakout, should push above resistance soon and head toward higher levels. 🚀
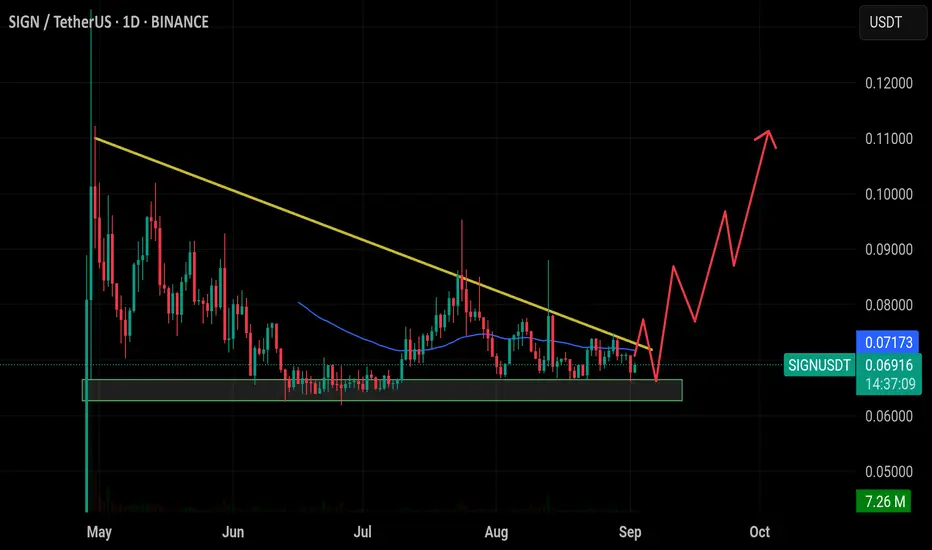
SIGN/USDT – Critical Accumulation Zone Before the Next Big Move!📊 Detailed Analysis of SIGN/USDT
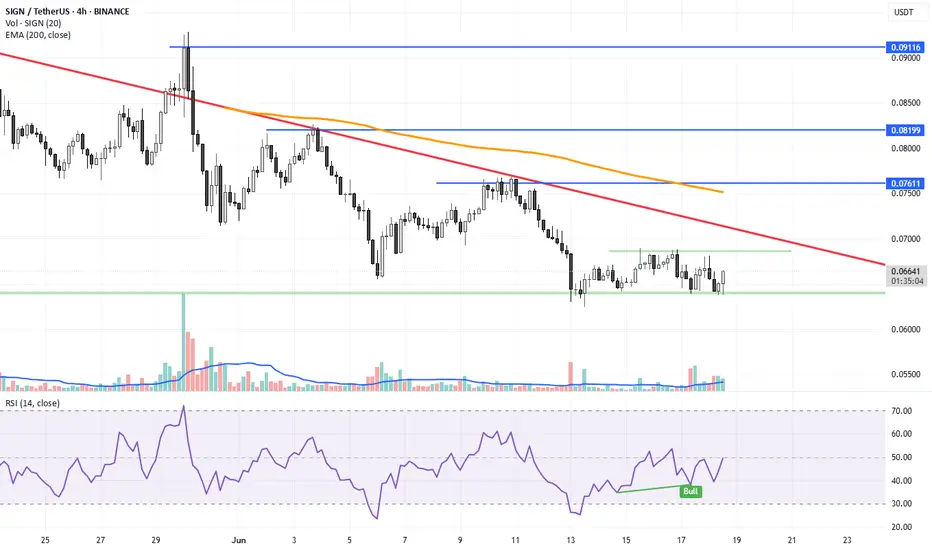
Currently, SIGN/USDT is moving within a prolonged consolidation phase, with the key demand zone at 0.06700 – 0.07000 USDT (highlighted in yellow). This zone has acted as a strong base since mid-June, repeatedly rejecting downside pressure, and can be considered a ma

SIGNUSDT Forming Bullish PennantSIGNUSDT is displaying a bullish pennant pattern, a continuation setup that typically follows a strong upward move and signals the potential for another rally. After a recent surge in price, the market has entered a brief consolidation phase, forming converging trendlines that point toward an impend

SIGN · 200%+ Potential in Less Than 90 DaysSIGN is recovering from support while producing the highest volume since May. We have only a small amount of data on this chart but it is easy to see first the action being sideways and also at bottom prices.
From this we can start to guide ourselves. SIGNUSDT is moving above EMA55 and EMA89 after

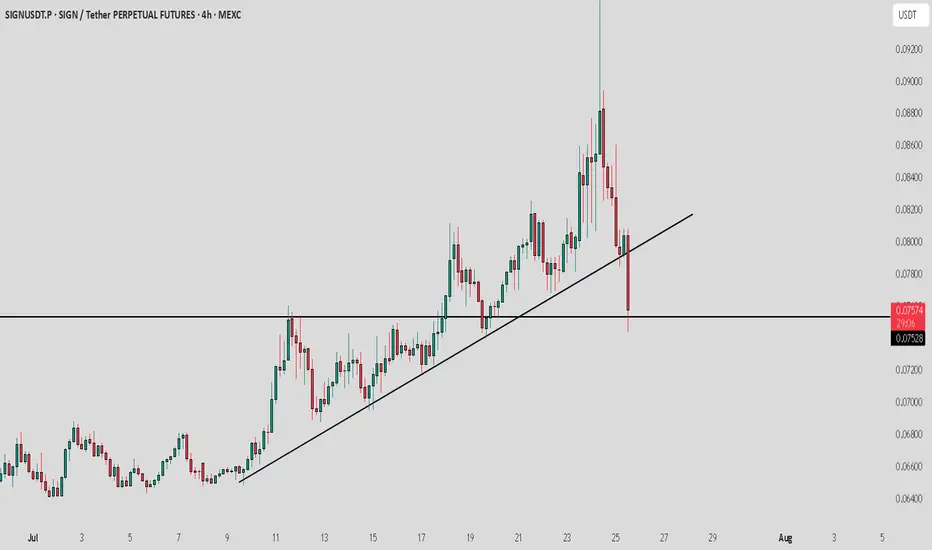
SIGN buy/long setup (4H)A tight consolidation range has been broken to the upside, and price has not yet pulled back to it.
On the chart, we have a trigger line breakout and the formation of a bullish change of character (CH).
When the price reaches the green zone, we can look for buy/long positions.
Targets are marked

Sign / USDT : Huge breakdown and currently sitting on supportSIGN/USDT Analysis:
SIGN is testing a crucial support level. The price has pulled back from its recent highs and is now sitting on a key Horizontal line. How the market reacts here will determine the next move.
Bullish Scenario:
Horizontal line Support: If the price holds above the Horizontal lin
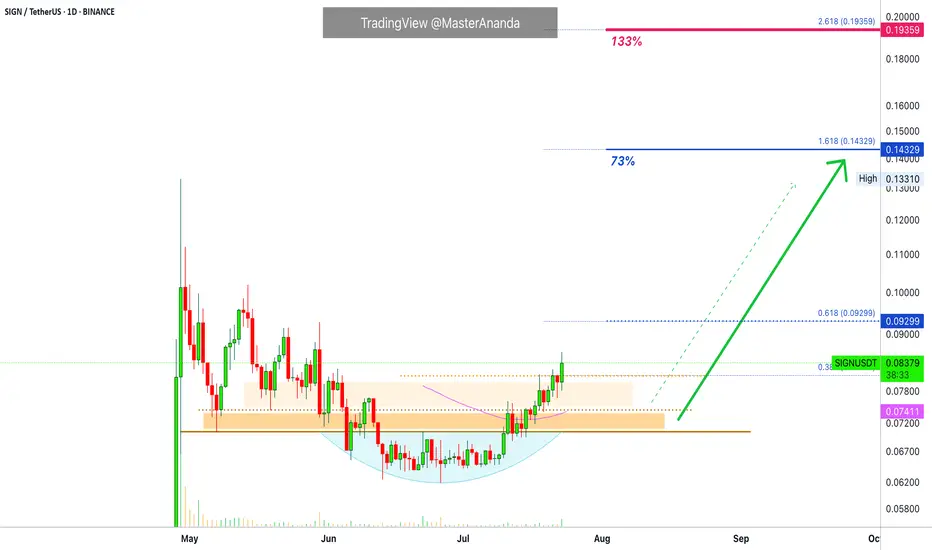
Sign · Same Chart, Same Pattern, Easy Profits · 133% PotentialThe same chart, the same dynamics and the same highly profitable easy to win trading opportunity.
The main low happens 7-May. There are lower prices after this but this is the stop-loss hunt event. We know this based on the rounded bottom pattern.
SIGNUSDT is back above its 7-May low and also trad
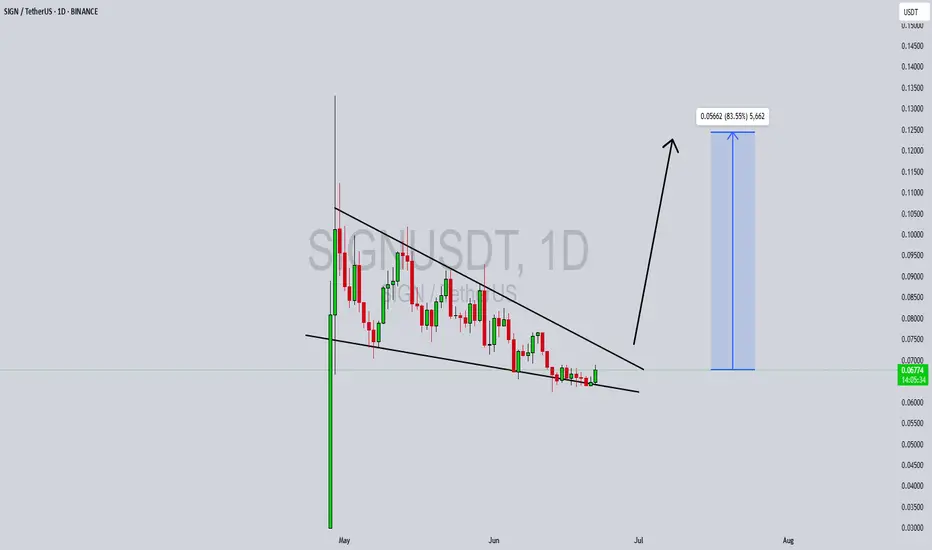
SIGNUSDT 12H#SIGN has formed a Falling Wedge pattern on the 12H chart — a bullish setup.
📍 Entry Idea: Consider buying a small bag near the support level of $0.06395.
If the price breaks out above the wedge resistance, the potential targets are:
🎯 $0.07142
🎯 $0.07604
🎯 $0.07978
🎯 $0.08351
🎯 $0.08883
🎯 $0.0956

SIGNUSDT Forming Falling Wedge SIGNUSDT is currently forming a textbook Falling Wedge Pattern, a bullish chart formation that often signals the end of a downtrend and the start of a breakout rally. This pattern is becoming increasingly visible on the daily chart, with price action narrowing and volatility decreasing—setting the s
See all ideas
Summarizing what the indicators are suggesting.
Oscillators
Neutral
SellBuy
Strong sellStrong buy
Strong sellSellNeutralBuyStrong buy
Oscillators
Neutral
SellBuy
Strong sellStrong buy
Strong sellSellNeutralBuyStrong buy
Summary
Neutral
SellBuy
Strong sellStrong buy
Strong sellSellNeutralBuyStrong buy
Summary
Neutral
SellBuy
Strong sellStrong buy
Strong sellSellNeutralBuyStrong buy
Summary
Neutral
SellBuy
Strong sellStrong buy
Strong sellSellNeutralBuyStrong buy
Moving Averages
Neutral
SellBuy
Strong sellStrong buy
Strong sellSellNeutralBuyStrong buy
Moving Averages
Neutral
SellBuy
Strong sellStrong buy
Strong sellSellNeutralBuyStrong buy