New price ceiling in silverThe new price ceiling in silver is $54 and we can expect the price to continue this upward trend.
Trade ideas

Silver's Road Map to $100.Silver's Road Map to $100.
All bets are off if that lower rising support line fails.

Silver corrective pullback supported at 5130The Silver remains in a bullish trend, with recent price action showing signs of a corrective pullback within the broader uptrend.
Support Zone: 5130 – a key level from previous consolidation. Price is currently testing or approaching this level.
A bullish rebound from 5130 would confirm ongoing upside momentum, with potential targets at:
5360 – initial resistance
5445 – psychological and structural level
5500 – extended resistance on the longer-term chart
Bearish Scenario:
A confirmed break and daily close below 5130 would weaken the bullish outlook and suggest deeper downside risk toward:
5065 – minor support
4980 – stronger support and potential demand zone
Outlook:
Bullish bias remains intact while the silver holds above 5130. A sustained break below this level could shift momentum to the downside in the short term.
This communication is for informational purposes only and should not be viewed as any form of recommendation as to a particular course of action or as investment advice. It is not intended as an offer or solicitation for the purchase or sale of any financial instrument or as an official confirmation of any transaction. Opinions, estimates and assumptions expressed herein are made as of the date of this communication and are subject to change without notice. This communication has been prepared based upon information, including market prices, data and other information, believed to be reliable; however, Trade Nation does not warrant its completeness or accuracy. All market prices and market data contained in or attached to this communication are indicative and subject to change without notice.

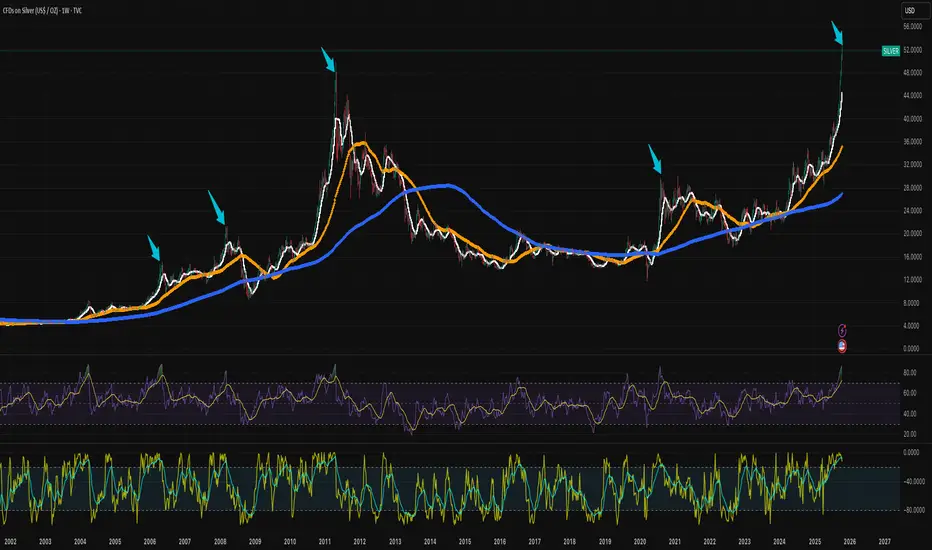
Grand Silver SupercycleI present the Grand Silver Supercycle. Silver has followed Elliott Wave Theory nicely through the years. The price hit a century low during The Great Depression, beginning what I believe to be the first wave of a supercycle. There is a clear five wave pattern up from this low, peaking in 1980. This is supercycle wave 1. Then, we see a five wave corrective pattern down, bottoming out in the early 90s. Alternatively, a three wave ABC pattern could be drawn. This is where supercycle wave 3 begins. Wave 3 is typically much more prominent than wave 1 in Elliott Wave Theory. For this reason, it makes sense that the next five wave pattern ending in 2011 is only the first subwave of supercycle wave 3. The second subwave corrected to the 2020 low, and we are currently on the third subwave. Within this subwave, we could either be starting a third wave (as shown in the chart) or still be on the corrective second wave. I believe the former is much more likely due to fundamentals.
Price targets within the current subwave were estimated as follows:
wave 3 length = 1.618 X wave 1
wave 3 target = $48
wave 4 length = 38.2% retracement of wave 3
wave 5 length = 1.618 X (wave 3 end - wave 1 start)
I'm more confident on wave 3 ending near $48 than I am of wave 5 ending near $95. There is strong resistance at $50, which coincides with the Elliott target zone. Wave 5 length can vary significantly. For silver at least, fifth waves have traditionally been long ones.
Fundamentals
Elliott Wave Theory is only a tool. It needs to be backed up by fundamentals when forecasting on long time frames. Silver is undervalued due to many years of supply outstripping demand, creating cheap prices. That is in the early stages of changing as now demand outpaces supply. Global silver demand was expected to hit an all time high of 1.21 billion ounces in 2022 (www.silverinstitute.org). This is largely due to increases in demand in both industry (Green Revolution) and personal investment (stackers hedging against inflation). Silver reserves currently stand at 530,000 metric tons (www.statista.com). The current demand is 38,000 metric tons per year. A simple calculation shows existing reserves could be depleted in 14 years. However, this calculation doesn't take into account new discoveries and recycling, which have so far kept pace with demand. Estimates of time to depletion of reserves vary wildly from a couple decades to a few centuries. At the moment, the prime driver of price (in addition to inflation) will be the deficit, not depletion of reserves.
Inflation is a totally different animal that is much harder to forecast long term due to its close relationship to government and Federal Reserve policy. It is more likely that when presented the choice, our leaders choose high inflation over debt default and depression. How this all is going to play out is anyone's guess. It seems for now our leaders are trying to kick the can down the road for as long as possible. If hyperinflation hits, the silver price will reach extraordinary heights.

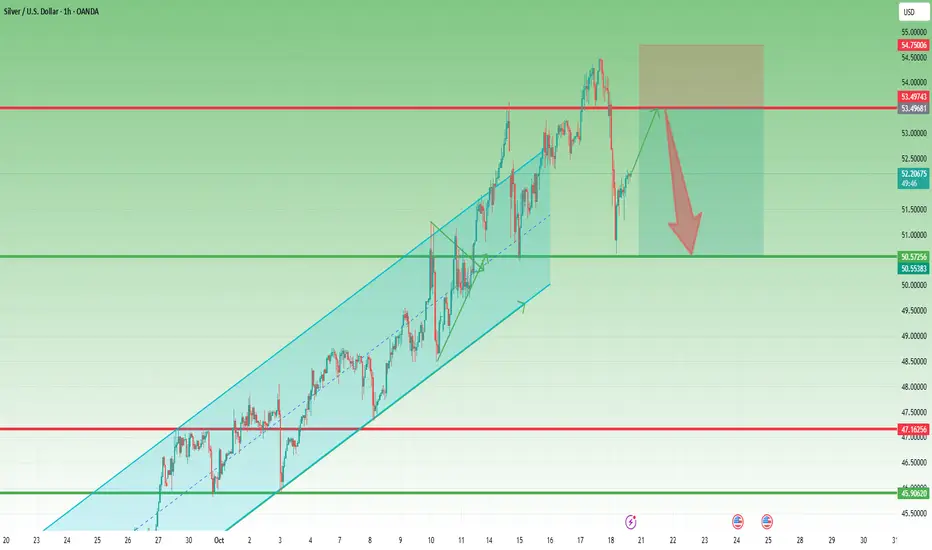
Silver: After New All-Time Highs, a Sharp CorrectionLast week, Silver reached a new all-time high, almost touching my $55 target.
However, on Friday, the market delivered a powerful sell-off, with the price dropping by around 4,000 pips — from the $54.50 ATH down to the $50.50 support zone.
At this stage, I expect the price to stabilize and form a temporary base of consolidation.
My focus now shifts to the $53.50 resistance zone, which could act as a short-term decision point.
If I observe signs of weakness or rejection in that area, I’ll consider short positions, targeting a potential retest of the $50 support zone.
The start of silver's MULTI-DECADE breakout! $XAGUSDUsing spyfrat trading system's to judge the parabolic move of silver.
Based on this system Silver has been on parabola since Sept 25 when both the daily and weekly RSI(30) went above 70. Since then, it went on several instances of Parabolic high risk(PHR) when the Daily RSI > Weekly RSI which is followed by a red day, the last one being last Thursday which I think is a healthy pullback to try to establish 50 as the new support. However, a bigger retracement is still a possibility especially because it just blew past the Fib target 1 (0.886) like it was nothing but got rejected at fib target 2 (1.13). So, i think there will be a consolidation between these prices until we stabilize above 50 then reach for higher targets in the coming months.
search spyfrat trading strategy online


SILVER $70.00My silver 5 year / 1 Week Chart!
Silver will rise to the resistance line at $35
If it breaks it resistance line at $35
The next resistance trendline is around $37.50
If it breaks the resistance trendline around $37.50
It could blast around $70.00 lol
I am making monthly videos on YouTube
I called this move 2 months ago!
I forgot to upload my idea on tradingview :(
Tradingview blocked my last silver idea 6 days ago for putting my youtube links! lol

XAG/USD UpdateNext move on the way, focus on proper risk management & stay disciplined. Wishing you successful trades..!
Key Reason:
1. Structure was bullish.
2. price grab sell side liquidity.
3. Fresh strong low + demand zone formation.
4. Possible Bullish move expected from this zone.
This is not a financial advise. Let's see how it will work.

SILVER Strong Rejection! Buy!
Hello,Traders!
SILVER Price just reacted from a horizontal demand area after a deep liquidity sweep below the previous low. Buyers stepped in strongly, hinting at a possible continuation higher toward the target zone near $52.80 where unfilled orders remain. Expect bullish momentum to extend if the demand zone holds.
Time Frame 5H.
Buy!
Comment and subscribe to help us grow!
Check out other forecasts below too!
Disclosure: I am part of Trade Nation's Influencer program and receive a monthly fee for using their TradingView charts in my analysis.

Potential Double Bottom at Key Structure on XAGUSDRecently, Silver has made headlines by pushing into new all-time highs, marking another impressive milestone in what has been a strong bullish run. However, as with any extended move, what followed was a period of relief to the downside. This healthy pullback gives the market a chance to reset before potentially continuing higher.
Reaction at a Key Level of Structure
During this pullback, price has reacted around a previous area of structure, a zone that acted as both resistance in the past and now may serve as support. This is exactly where we often look for the market to find balance — and possibly, the beginning of a new leg to the upside.
A Potential Double Bottom Formation
What’s particularly interesting right now is that Silver appears to be halfway through forming a potential double bottom pattern. This classic price pattern is one of the most recognizable reversal setups in trading, often signaling that selling pressure is weakening and buyers are beginning to step back in.
If the second bottom completes it could serve as a strong confirmation that the market is ready to resume its bullish trend — offering an excellent opportunity for traders with a bullish bias to rejoin the move.
The Takeaway
For Silver bulls, this is a key moment to pay attention to. The market has pulled back into structure, reacted positively, and is forming a recognizable reversal pattern, all while still sitting within a broader uptrend.
While patience is required for the pattern to fully confirm, the potential double bottom setup represents a textbook example of how structure and price action work together to reveal high-quality trading opportunities.
Please leave any questions, comments or trading ideas below and I wish you guys a safe & profitable week of trading ahead.
Akil

Silver is in the Down TrendHello Traders
In This Chart XAGUSD HOURLY Forex Forecast By FOREX PLANET
today XAGUSD analysis 👆
🟢This Chart includes_ (XAGUSD market update)
🟢What is The Next Opportunity on XAGUSD Market
🟢how to Enter to the Valid Entry With Assurance Profit
This CHART is For Trader's that Want to Improve Their Technical Analysis Skills and Their Trading By Understanding How To Analyze The Market Using Multiple Timeframes and Understanding The Bigger Picture on the Charts

SILVER Expected Growth! BUY!
My dear friends,
SILVER looks like it will make a good move, and here are the details:
The market is trading on 51.814 pivot level.
Bias - Bullish
Technical Indicators: Supper Trend generates a clear long signal while Pivot Point HL is currently determining the overall Bullish trend of the market.
Goal - 52.913
Recommended Stop Loss - 51.290
About Used Indicators:
Pivot points are a great way to identify areas of support and resistance, but they work best when combined with other kinds of technical analysis
Disclosure: I am part of Trade Nation's Influencer program and receive a monthly fee for using their TradingView charts in my analysis.
———————————
WISH YOU ALL LUCK

Add Silver to your ALERTSHave been watching Silver recently and while I hear some of the bullish feelings around it, I do want to caution that it is very volatile esp. at these levels. The issue is not whether you think it's a good hedge or not, but that there are a number of speculators that simply profit once their asset reaches a certain level. Also, the world generates around 800M"ish" of ounces in a given year and we're at 1 billion demand. What does that mean? There will be trust issues when the supply chain breaks, and it will break esp. when future contracts expire and delivery is expected within 72 hours and cannot be met. I could be way off here, or not :) I follow macros, trends, and call out BS all the time when I see it.
Add ZSL (inverse of Silver) to your alerts asap. It will spike very soon!
Best of luck!
#XAGUSD(SILVER): Price is likely to drop at $41 area. The current trading price of XAGUSD (SILVER) is at an all-time high. This is attributed to global uncertainty and the decline of the US Dollar. However, the lack of significant volume to support this level suggests a potential rapid decline. This decline could facilitate the price reaching a key level of $41.
There are two potential benefits from this drop. Firstly, it would allow for maximisation of trading by selling. Secondly, when the price reaches this level, we can purchase at the discounted price.
We wish you the best of luck and trade safely.
Team Setupsfx_

Grok Analysis of Gold/Silver Ratio - 4 month Price TargetsI asked Grok: Gold and silver 4 months price targets using Gold-silver ratio analysis of m2.
Grok: Gold Target $4,800 +13%
Grok: Silver Target: $70 +35%
Grok 4 month Summary
Thought for: 4m 33s
These targets align with a distribution of expert forecasts, which range from $4,000-5,500 for gold and $45-100 for silver in early 2026, but are specifically adjusted using the M2 and ratio framework. Risks include faster-than-expected M2 contraction (e.g., due to Fed policy) or geopolitical events accelerating precious metals demand. Not financial Advice

Silver. Trend downtrend on 1 hr tf.
But still looking for some upward turning to supply
Before a real bearish come

That's exactly what happened.If we measure the percentage from the bottom of the cup to the rim, we get ~1200%.
We now plot the same value from the rim line to get an idea of the possible movement.
You might say that at this price, silver would be disproportionately expensive relative to gold.
Take a look at 1980 (the year when this “cup with a handle” began to form).
Silver was worth 49% of the total capitalization of gold.

Silver on the Verge !!!Short-Term View:
Silver (XAGUSD) is approaching a major long-term resistance zone near $50–$52, a level that historically marked two major peaks — in 1980 and 2011. The price has rallied strongly and is currently testing the upper limit of this psychological and technical barrier.
If silver fails to close above $52, a short-term correction toward $42 → $36 is likely as traders take profits. A sustained daily or weekly close above $52.5 would invalidate the correction scenario and signal a breakout continuation.
Long-Term View:
From a macro perspective, silver has formed a massive multi-decade ascending structure and is attempting to break out of it.
A confirmed breakout above $52–$56 could open the path toward $65 → $75, levels unseen since the early 1980s.
However, if rejection occurs and price closes below $35, the long-term bullish structure would weaken, exposing supports around $28 → $24.
Summary:
Silver is testing one of the most critical resistance zones in its history. A clean breakout could mark the start of a new secular bull market, while a rejection would likely lead to a deep corrective phase.

Gold & Silver long-term viewSimple log chart and trendline shows gold around $30K and silver around $900 by 2030. Each candle = 1 year
Cheers,
Keops

Silver: seeking support Multiple liquidity raids last Friday, with possible support. Higher low created at 51.400, which it it holds, should see a BOS of 52.000 shortly after. If so, Silver could push higher in the week.
- Watch the support area at 50.600 - a break may invalidate this projection.

SILVER XAGUSD SILVER WILL correct on tyhe retest of the broken neckline of the double top structure 54.0158-53.98 zone .
correction on that structure will be on risk management.
#silver #xagusd #dollar #us10y

SILVER XAGUSD SILVER will on break and retest sell from the retest zone ,on technical the ema+sma are set for bearish continuation from friday correction.
NOTE CORRECTION IS COMING DONT CALL IT MANIPULATION.
#XAGUSD #SILVER #DOLLAR #US10Y
