Silver – Record Highs and Increased Volatility to Contend WithSilver has literally jumped to the forefront of commodity market traders’ screens in October as it has soared to record highs, followed by an increased period of volatility, before then moving to even higher levels again this morning. The main reasons seem to be Silver’s attraction as an alternative to Gold as a safe haven/debasement asset in this current period of uncertainty.
Traders are concerned about increased trade tensions, a prolonged US government shutdown, weaker global growth, excessive levels of government debt, inflation, a war in Ukraine and what the Federal Reserve may do next regarding interest rates. It is quite an extensive list!
Add to this a historic physical shortage of Silver, soaring borrowing costs and reduced liquidity in a market that is much smaller than its big brother, Gold, and you have a recipe for a volatile asset that is not to be entered without strong risk management, a good understanding of the fundamentals and a serious consideration of important technical levels.
Silver started the month at 46.647, dipped to a low of 45.903 on October 2nd and then hasn’t looked back, posting a series of new multi-year and then record highs all the way to a peak this morning at 53.50. However, it hasn’t been plain sailing, with an average 5% trading range over the last three days alone. An important risk factor to consider.
Looking forward across this week, Silver prices could be influenced by the next headlines outlining where the direction of trade tensions between the US and China are moving, including updates on whether President’s Trump and Xi will meet later this month as had been originally planned. Their first meeting for 6 years.
Progress updates on the stalemate between Democrats and Republicans that has forced the US government into a 2 week shutdown may also be relevant, alongside any easing in the current supply issues in the physical Silver market.
Technical Update: The Push Higher Continues:
It should always be remembered that traditional overbought signals are sometimes ignored while trending and sentiment measures remain strong. It’s a reminder that indicators like RSI or stochastics may flash caution, but price can continue to move higher if broader conditions support it.
Silver has defied overbought readings of late with a near-uninterrupted rally since the August lows. Despite repeated calls from some for a correction, price action has remained resilient, underscoring how strong trend and sentiment can override traditional ‘overbought’ conditions.
So, what are the tools that might be used to gauge the trending and sentiment condition of Silver’s recent moves?
From a sentiment standpoint, the chart above shows a bias toward larger, more frequent green positive candles, indicating consistent buying interest. Traders appear willing to pay higher prices despite the extended rally, which reflects positive sentiment. This pattern suggests confidence in the trend, with dips being viewed as opportunities rather than warnings.
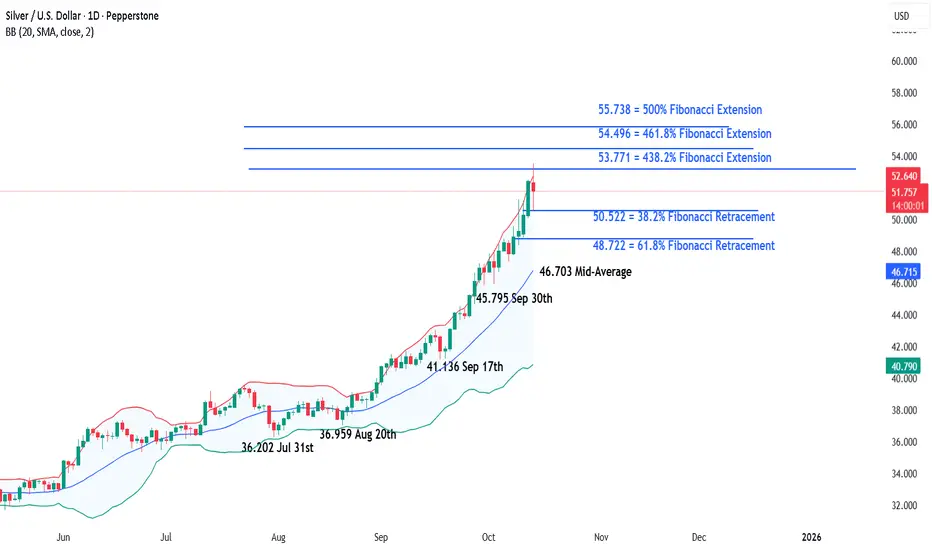
From a trending perspective, Bollinger Bands have shown price remains above the rising mid-average, frequently touching the upper band, while the bands themselves are widening. This combination reflects upward momentum and positive price volatility, maintaining a constructive backdrop.
Silver’s current setup might suggest attempts at further price strength, but it’s no guarantee of continuation. Positive candles and price action above the rising mid-average, alongside widening Bollinger Bands may point to momentum behind the current move, but traders must also stay alert, watching candlestick signals and Bollinger band activity to assess the current trends sustainability.
This backdrop can of course shift quickly, so tracking key support and resistance levels is also vital to help spot possible emerging directional themes.
Possible Resistance Levels: .
The 53.771 level, marking the 438.2% Fibonacci extension, may now act as a key resistance point. So far, Tuesday’s push into new highs has stayed below this level on a closing basis, suggesting it might slow further upside and potentially ease the prevailing bullish trend and sentiment.
Monitoring how this 53.771 resistance level is defended on a closing basis may prove important this week. A sustained break above it could result in further attempts at upside toward 54.496, the 461.8% extension, even potentially 55.738, a level equal to the 500% extension.
Possible Support Levels:
Throughout the August to October advance, pullbacks have been shallow, typically lasting just one or two sessions, before buyers reasserted control. This pattern currently suggests that near-term weakness may continue to prove limited.
To suggest potential of a possible shift in trend, closing breaks below support levels would likely be required, marking a possible transition from short-term dips to the potential of a corrective phase in price.
The first support may be at 50.522, which is the 38.2% retracement. A close below this level could suggest a deeper correction risk, shifting trader focus toward 48.722, the 61.8% Fibonacci retracement and potentially even 46.703, which is equal to the rising Bollinger mid-average.
The material provided here has not been prepared accordance with legal requirements designed to promote the independence of investment research and as such is considered to be a marketing communication. Whilst it is not subject to any prohibition on dealing ahead of the dissemination of investment research, we will not seek to take any advantage before providing it to our clients.
Pepperstone doesn’t represent that the material provided here is accurate, current or complete, and therefore shouldn’t be relied upon as such. The information, whether from a third party or not, isn’t to be considered as a recommendation; or an offer to buy or sell; or the solicitation of an offer to buy or sell any security, financial product or instrument; or to participate in any particular trading strategy. It does not take into account readers’ financial situation or investment objectives. We advise any readers of this content to seek their own advice. Without the approval of Pepperstone, reproduction or redistribution of this information isn’t permitted.
Trade ideas
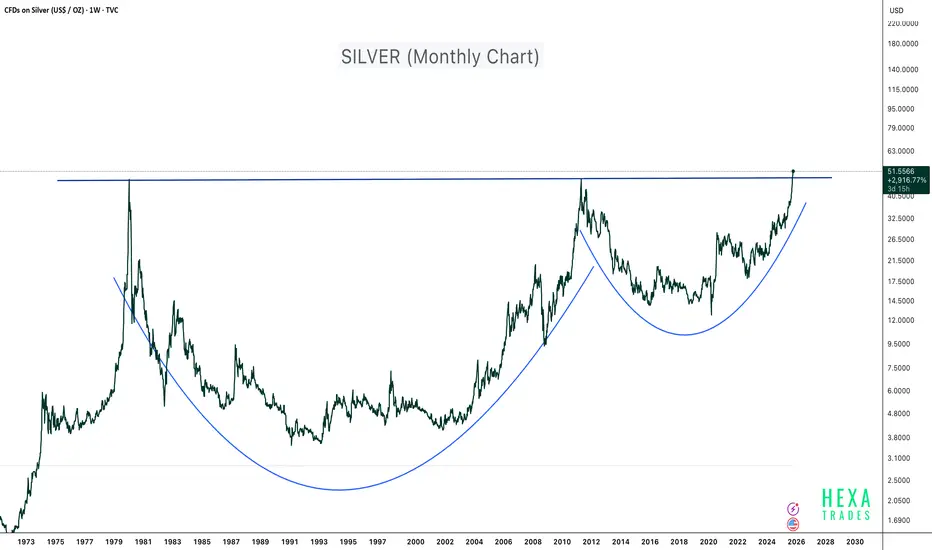
Silver - 45 Years of Breakout!Silver has just completed one of the largest and longest cup and handle patterns in financial history, spanning more than four decades. The metal has officially broken above the 1980 and 2011 highs, signaling a potential supercycle breakout on the monthly timeframe.
This type of long-term technical structure typically marks the beginning of a massive secular bull run, often driven by macroeconomic shifts such as inflation cycles, fiat currency debasement, and rising demand for hard assets.
Technical Highlights:
- Pattern: 45-year Cup and Handle formation
- Breakout Zone: Above $50 confirmed (Weekly chart)
- Structure: Deep base formation showing multiple accumulation phases (1981–2001 and 2012–2023)
Macro Perspective:
Silver is benefiting from:
- Increased industrial demand (especially in solar, EV, and electronics sectors)
- Inflationary monetary policies and growing global money supply
- Renewed investor interest in tangible and real assets
This breakout could mark the start of a multi-year bull run for silver. Long-term investors may view this as an opportunity to accumulate and hold for 10–15 years, aligning with the magnitude and duration of the pattern.
If the price experiences short-term pullbacks in the coming months, use DCA (Dollar-Cost Averaging) to build long-term exposure.
Conclusion:
After 45 years of consolidation, silver is finally breaking free. The chart points toward a historic structural breakout, potentially setting the stage for the next precious metals supercycle.
Cheers
Hexa
Disclaimer:
This analysis is for educational purposes only and does not constitute financial advice. Always conduct your own research and manage risk responsibly.
Silvers reached a fresh record high due to the short squeezeSilver prices reached an all-time high of over 53 USD/ounce, driven by a significant short squeeze in London. This rally was further fueled by safe-haven demand following the resumption of US-China trade tensions.
US President Trump expressed openness to negotiations after announcing an additional 100% tariff on Chinese goods, but China has not responded. Meanwhile, China's Sep exports surprisingly increased by 8.3% YoY, the fastest pace in six months, driven by demand from countries other than the US. Exports to the US fell 27% YoY due to tariff pressures. This indicates that the additional threat from Trump may not significantly impact China, especially given its crucial role in the AI value chain and its dominance in rare earth production. These elevated tensions could continue to drive markets toward safe-haven assets amid global instability.
On the supply side, the London Bullion Market Association, as reported by Bloomberg, confirmed that it is “aware of tightness in the silver market and is actively monitoring the situation.” Mine production has remained below demand since 2021, primarily due to electrical and electricity demand, especially from photovoltaics, where China is a dominant force. The ongoing supply shortage could continue to support silver prices.
Technically, XAGUSD is showing strong bullish momentum after breaking its previous record high, with both EMAs diverging and extending.
XAGUSD could continue to rise and test the 227.2% Fibonacci extension at 60.
Conversely, price could face take profit pressure after a long rally with the RSI indicates the overbought level (over 88). If the bullish momentum weakens, XAGUSD could test the resistance level at 47.88.
By Van Ha Trinh - Financial Market Strategist at Exness

Silver has reached the launchpad.Not only did Silver finally hit a new all time high but even more impressive is that it finally closed a candle above the rimline of the 40 year old cup and handle pattern it has been forming since before I was even born. Considering how long it took to accomplish this I can not in good faith let one daily candle close trick me into thinking that it has validated the breakout but this is definitely a giant leap closer to validating an eventual breakout. I get the feeling people are going to be absolutely mindblown by what silver does when the breakout is validated. We are currently on our way to the dotted red trendline’s target but on the way they we should definitely validate the cup and handle breakout hitch will then has us heading to the exponentially higher dotted green lines target at around $722. Buckle up people and prepare for blastoff in the not so distant future. Also be aware that they could have multiple dips back below then back above and below and above the rimline of the cup (horizontal green line) before the actual breakout. Or it could just send a random moonshot candle up to the target as well n the very first try. Best to be prepared for both possibilities. *not financial advice*

My Thoughts On Investing in SilverVery slow investment and might not be worth it for the everyday millennial... 100% gain for sure this decade though... I do like the consolidation though but GOLD's chart looks better!

Silver Wave Analysis – 13 October 2025
- Silver broke round resistance level 50.00
- Likely to rise to resistance level 54.00.
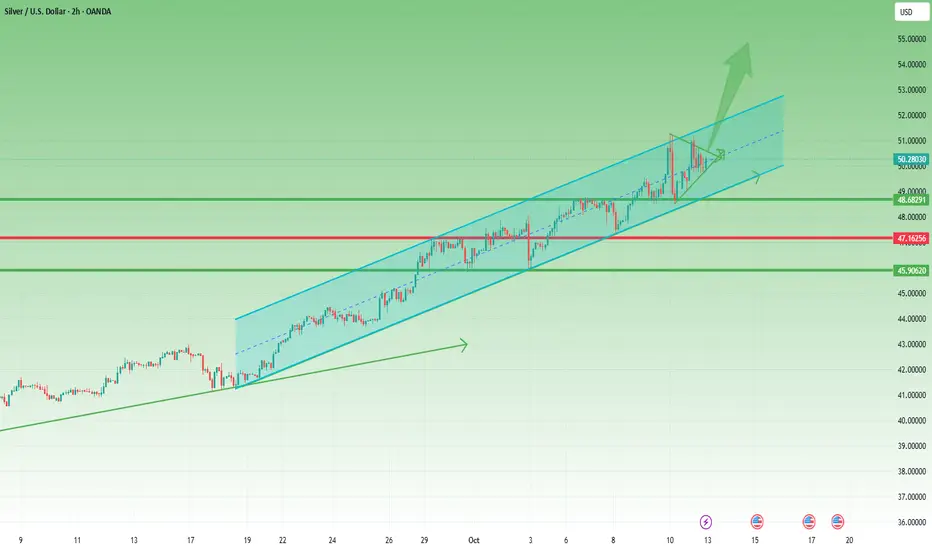
Silver continues to rise strongly after the price broke the round resistance level 50.00 intersecting with the resistance trendline of the sharp daily up channel from September.
The price has been breaking through 3 progressively steeper upward channels – which signals the acceleration of the upward momentum.
Given the strong daily uptrend, Silver can be expected to rise to the next resistance level 54.00 (target price for the completion of the active impulse wave 5).

#XAGUSD Silver – Monthly Chart (Higher Time Frame Analysis Updat📈 #XAGUSD Silver – Monthly Chart (Higher Time Frame Analysis Update)
On the monthly COMEX chart, Silver has reached a historically critical zone — a level it has touched only three times since its inception on the forex market ⚡️
### 🕰 Historical Context
1️⃣ 1980:
Silver made its first-ever major peak around $48, followed by a massive correction all the way down to $5.
2️⃣ April 2011:
The metal created another lifetime high at $49.80, but history repeated itself — price crashed sharply, touching lows near $11.50 in subsequent years.
3️⃣ October 2025 (Current Scenario):
Silver has now printed a new high at $51.20, marking its third attempt in history to sustain above the psychological barrier of $50.
---
### 🔍 Key Technical Outlook
Both previous times, Silver failed to sustain above $50, leading to deep corrections.
Hence, this time, we need to see at least 1–2 consecutive weekly candle closings above the $50–$51 zone to confirm a strong breakout and trend continuation.
Once that confirmation comes in, we could confidently plan fresh long entries, as this would signal a potential super-cycle rally in Silver 🔥
---
### 🎯 Upside Projections
If Silver manages to hold above $50 convincingly, the next major targets on a higher timeframe would be:
* First Target: $60
* Extended Target: $68
This move could potentially open the doors for a massive long-term bullish phase, supported by both technical breakout and global precious metal demand fundamentals 💎

SILVER USDHI GUYS,
We are so bullish on silver . still holding on to buy entries that we made last 3 months, last month and last week.
Take profit GRAND FINAL HS H4 (56.59109 HEAD)
Take profit MID TERM HS H4 ( 53.23641 SHOULDER).
I will post entries only when we reach mid term area of interest soon.
we can adjust our trailing stop loss to secure profits on every break and retest moves the market presents.
WISH U LUCK AND SAFE HOLDING, TILL TAKE PROFIT AREAS

Silver Shines — But Caution Ahead?Silver Shines — But Caution Ahead?
- Silver has just hit a fresh all-time high of $51.70, breaking past its 2011 record.
- However, the monthly RSI is racing toward the extreme 85.00 zone, a level that previously marked major tops in 2006, 2008, and 2011.
Momentum remains strong, but history suggests (as shown in the monthly Silver Chart) that when RSI enters this zone, sharp pullbacks tend to follow.
I don't mean, the the rally is over — but it's just a reminder that every time a steep vertical move is often followed by high volatility (volatility might invite pullbacks).

How much longer can it sustain this velocity?If silver reaches $53.50, then it would have reproduced a similar move done back in 2010-2011.
How much longer can it sustain this velocity?

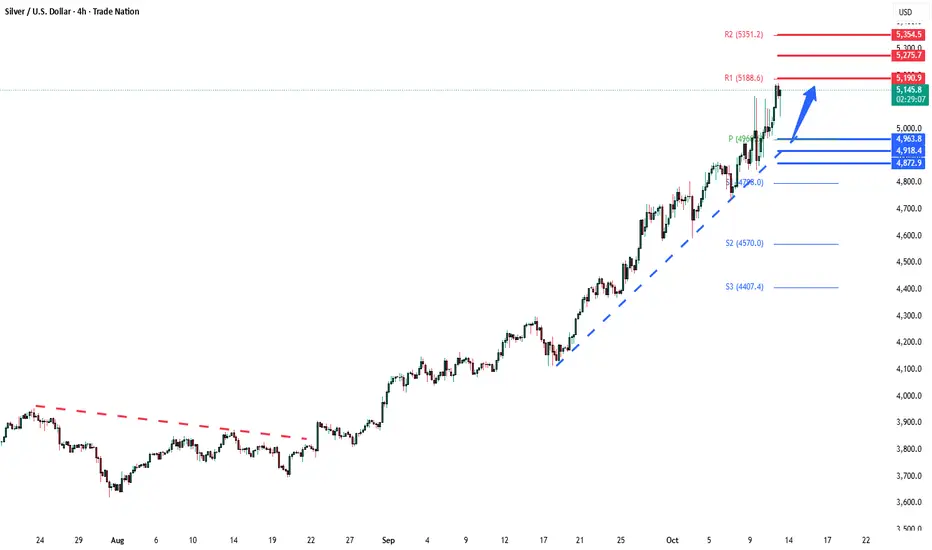
Silver bullish breakout supported at 4964The Silver remains in a bullish trend, with recent price action showing signs of a continuation breakout within the broader uptrend.
Support Zone: 4964 – a key level from previous consolidation. Price is currently testing or approaching this level.
A bullish rebound from 4964 would confirm ongoing upside momentum, with potential targets at:
5190 – initial resistance
5275 – psychological and structural level
5355 – extended resistance on the longer-term chart
Bearish Scenario:
A confirmed break and daily close below 4964 would weaken the bullish outlook and suggest deeper downside risk toward:
4920 – minor support
4870 – stronger support and potential demand zone
Outlook:
Bullish bias remains intact while the silver holds above 4964. A sustained break below this level could shift momentum to the downside in the short term.
This communication is for informational purposes only and should not be viewed as any form of recommendation as to a particular course of action or as investment advice. It is not intended as an offer or solicitation for the purchase or sale of any financial instrument or as an official confirmation of any transaction. Opinions, estimates and assumptions expressed herein are made as of the date of this communication and are subject to change without notice. This communication has been prepared based upon information, including market prices, data and other information, believed to be reliable; however, Trade Nation does not warrant its completeness or accuracy. All market prices and market data contained in or attached to this communication are indicative and subject to change without notice.
SILVER SELLERS WILL DOMINATE THE MARKET|SHORT
SILVER SIGNAL
Trade Direction: short
Entry Level: 5,140.8
Target Level: 5,029.5
Stop Loss: 5,214.4
RISK PROFILE
Risk level: medium
Suggested risk: 1%
Timeframe: 1h
Disclosure: I am part of Trade Nation's Influencer program and receive a monthly fee for using their TradingView charts in my analysis.
✅LIKE AND COMMENT MY IDEAS✅

$XAGUSD Silver3 targets based on Fibonacci and the giant cup and handle formation.
Target 1 = 45.47 has already been hit. Bat pattern.
Target 2 = 54.79 Alternate bat at fibonacci level 1.13
Target 3 = 73.43 crab pattern fibonacci level 1.618
Target 4 = 96.26 for cup and handle pattern.

Silver: New ATH, Sharp Pullback, and What Comes NextLast week, something traders had been waiting for finally happened — Silver reached a new all-time high, touching 51.30 before a strong 3,000-pip selloff followed.
However, looking closely at the chart, we can see that this decline stopped precisely at the confluence of horizontal support and the ascending channel’s lower boundary — a technical level that often attracts renewed buying interest.
In my Friday’s analysis, I mentioned that although Silver looked very strong, traders should watch the ATH zone and the channel’s upper resistance for potential pullbacks. Indeed, XAGUSD reacted exactly from that area and corrected lower.
Now, things get very interesting:
1. Strong demand near $50 – Despite the initial drop on Friday, Silver built a solid floor just under the 50 level, suggesting that buyers remain in control and the recent ATH might just be a prelude to new highs.
2. Holding above the median line – The price is hovering around the channel’s midline without testing the lower boundary, a clear sign of underlying strength.
3. Potential pennant formation – Although not perfectly shaped, the price action since Thursday resembles a small pennant, which is typically a continuation pattern in bullish trends.
Putting these clues together, the technical picture still favors the upside, with confirmation coming if price sustains above the 50.50–50.70 zone.
If that happens, considering Silver’s recent momentum, we could easily see $55 as the next target in the coming week.
As long as $49 remains intact, my plan stays simple — buy the dips. 🚀
SILVER (XAGUSD) 15M – Bearish Rejection Setup Ahead TVC:SILVER
Structure | Trend | Key Reaction Zones
Price reached the accumulation + resistance zone, facing repeated rejections.
Structure is forming a lower-high pattern beneath the descending trendline.
If the rejection confirms, a sharp drop toward the next liquidity pool (49.00 area) can follow.
Market Overview
Silver has been ranging within a broad accumulation zone after rejecting the upper resistance region around 50.8–51.2. The market shows weakness near the top of the channel, hinting at a bearish continuation phase. If momentum fails to break above the diagonal resistance, a downside move toward 49.5–49.0 becomes highly probable before a possible reaction from the strong demand box.
Key Scenarios
✅ Bearish Case 📉 → 🎯 Target 1: 49.52 | 🎯 Target 2: 49.03 | 🎯 Target 3: 48.70
❌ Bullish Case 🚀 → 🎯 Target 1: 50.80 | 🎯 Target 2: 51.20 (if resistance breaks cleanly)
Current Levels to Watch
Resistance 🔴 : 50.80 – 51.20
Support 🟢 : 49.50 – 49.00 – 48.70
⚠️ Disclaimer: For educational purposes only. Not financial advice.

xagusdHave we seen high for year? deffo a cup there. Supports drop for gold to hard to say but i see weakness and possible correction in metals i cannot ignore

Silver LongWanting to long silver on pullback. Expecting pullback after many long wicks rejections, pulling back into area of support, confluence is the rising par. chan. and fib below 0.5, also market uncertainty after Friday's crazy drop

Gold’s Playbook Repeating in Silver?HI GUYS!
History doesn’t repeat, but in the markets, it often rhymes, and silver’s chart looks eerily familiar.
Gold’s long-term cup-and-handle pattern between 2013–2023 led to a massive breakout above $4,000. Now, silver appears to be tracing the same formation, just a few years behind.
Silver’s cup (2011–2024) has completed, and its handle (a descending channel) is forming right where gold’s did before it launched.
The measured target? Around $200+ USD, a level that would mark a historic revaluation of the metal.
With industrial demand rising and monetary uncertainty persisting, silver could soon follow gold’s lead, turning this technical Deja vu into a full-blown breakout.
History’s playbook is open. Silver might be next.

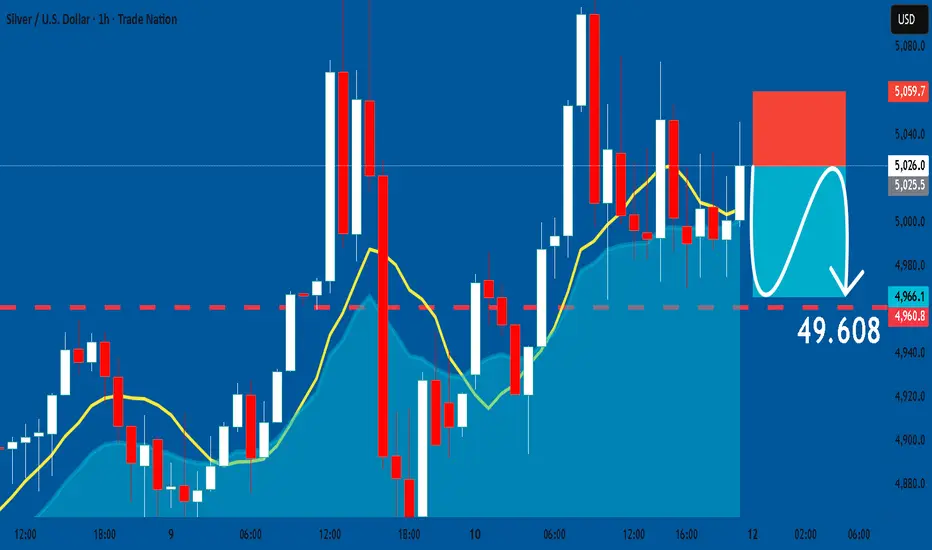
SILVER: Short Trade Explained
SILVER
- Classic bearish pattern
- Our team expects retracement
SUGGESTED TRADE:
Swing Trade
Sell SILVER
Entry - 50.260
Stop - 50.597
Take - 49.608
Our Risk - 1%
Start protection of your profits from lower levels
Disclosure: I am part of Trade Nation's Influencer program and receive a monthly fee for using their TradingView charts in my analysis.
❤️ Please, support our work with like & comment! ❤️
Silver Near Its All-Time High — Time to Secure Profits or Hold ?Hello Traders 🐺
Many of you have been asking for my thoughts on Silver’s price, so let’s break it down together.
To be honest, it’s not an easy call right now — we’re in a situation where several strong bullish and bearish factors are mixed together, making decision-making a bit tricky.
But don’t worry, let’s take a look at the chart first, then we’ll go over the current global and U.S. economic conditions, and finally come up with a solid strategy 👇
As you can see on the chart, Silver is getting very close to its all-time high around $50. Naturally, many traders start taking profits when we approach such major resistance levels — and honestly, that’s totally reasonable since psychological levels always matter.
However, when you take a closer look at the candles, you can still see a strong bullish momentum holding the trend.
Now, considering the upcoming tariff wars, geopolitical tensions in the Middle East, and the ongoing Russia conflict, things are getting pretty interesting.
Yes, in wartime, both Gold and Silver tend to rise because national currencies lose value — but we also need to remember that wars often bring recessions, and that can lower industrial demand, especially from electronics and tech industries, which are big silver consumers.
When people start prioritizing essentials and hold onto cash, non-essential spending drops, leading to lower demand for silver.
On the other hand, both Gold and Silver have already been in a long-term bullish rally, and prices are no longer ideal for large fresh entries.
As you know, the trend is our friend — until it ends.
From my personal point of view, a partial profit-taking around current levels, followed by re-accumulation during a possible pullback toward the support area I marked on the chart, seems like a smart play.
For example, you could sell half of your position here and buy it back if price dips to that key zone — while keeping the rest for a potential continuation to the upside.
As always, stay disciplined — because:
Discipline is rarely enjoyable, but almost always profitable.
🐺 KIU_COIN 🐺

Silver will Make a New All Time HighHello Traders
In This Chart XAGUSD HOURLY Forex Forecast By FOREX PLANET
today XAGUSD analysis 👆
🟢This Chart includes_ (XAGUSD market update)
🟢What is The Next Opportunity on XAGUSD Market
🟢how to Enter to the Valid Entry With Assurance Profit
This CHART is For Trader's that Want to Improve Their Technical Analysis Skills and Their Trading By Understanding How To Analyze The Market Using Multiple Timeframes and Understanding The Bigger Picture on the Charts

Uptrend in silverAccording to previous analysis, this historical ceiling was broken and we can now enter a buy trade at the specified price if the demand range is not penetrated.

Silver Long-Term Outlook: Wyckoff, Fibonacci & Volunacci in PlayOn the monthly chart, Silver is showing a strong setup for long-term investors. We can clearly identify two adjacent Wyckoff accumulation patterns, signaling institutional accumulation phases.
Price action is following an ascending Fibonacci channel, reflecting a steady bullish structure. After breaking out of the second Wyckoff pattern, a Volunacci projection has formed—pointing toward a potential move to retest its historical high near $48.
This alignment of classic technical patterns with volume-based projection tools strengthens the long-term bullish case for Silver.
