XAGUSDHello Traders! 👋
What are your thoughts on Silver ?
Silver entered a corrective phase following its recent rally and is now trading below the resistance zone and the broken trendline.
This structure suggests weakening bullish momentum and a potential continuation to the downside once the pullback completes.
We expect price to complete a pullback toward the broken zone and then resume its downward movement toward the identified support levels.
As long as silver remains below the resistance and trendline, the bearish bias stays valid.
A confirmed break and close above resistance would invalidate this scenario.
Don’t forget to like and share your thoughts in the comments! ❤️
Trade ideas

SILVER H1 | Bullish Momentum To ExtendXAG/USD is falling towards the buy entry, which is a pullback support that lines up with the 23.6% Fibonacci retracement and could bounce from this level to the upside.
Buy entry is at 48.28, whichis a pullback support that lines up with the 23.6% Fibonacci retracemnt.
Stop loss is at 47.17, whichis an overlap support that is slightly above the 61.8% Fibonacci retracement.
Take profit is at 50.52, which is a pullback resistance that is slightly below the 61.8% Fibonacci retracement.
Stratos Markets Limited (tradu.com ):
CFDs are complex instruments and come with a high risk of losing money rapidly due to leverage. 68% of retail investor accounts lose money when trading CFDs with this provider. You should consider whether you understand how CFDs work and whether you can afford to take the high risk of losing your money.
Stratos Europe Ltd (tradu.com ):
CFDs are complex instruments and come with a high risk of losing money rapidly due to leverage. 70% of retail investor accounts lose money when trading CFDs with this provider. You should consider whether you understand how CFDs work and whether you can afford to take the high risk of losing your money.

31.10.25 Morning ForecastPairs on Watch -
FX:EURAUD
OANDA:XAGUSD
A short overview of the instruments I am looking at for today, multi-timeframe analysis down to what I will be looking at for an entry. Enjoy!

Silver (XAGUSD) – 4H OutlookPrice has bounced off the demand zone and is holding above both the 20 EMA (green) and the 200 EMA (red), confirming short-term bullish momentum.
A retest around 48.40–48.00 could provide continuation entries toward 51.00 and potentially higher resistance levels around 53.00–55.00.
A break below 47.30 would weaken the bullish bias

XAGUSD – Liquidity Grab & Supply Rejection ScenarioThis chart illustrates a Smart Money Concept (SMC) outlook on Silver (XAGUSD) with key structural points:
Market Structure Breaks (MSB / BOS / CHOCH) highlighting shifts between bullish and bearish order flow.
Liquidity zones marked where prior highs/lows may attract orders.
Supply Zone (Be_BB) and Order Block (Be_OB) identified as potential reaction areas where price could face resistance.
Demand Zone Area (45.00–46.00) indicating a region of potential buying interest.
The projection visualizes a possible liquidity sweep above 48.45–49.64, followed by a bearish continuation into the demand zone.
All annotations are for educational and analytical purposes only, not financial advice.
Use this chart to study market structure, liquidity behavior, and institutional order flow concepts.

Silver Eyes 45.00 as Traders Digest Fed Cut and Trade TruceSilver prices steadied as volatility and safe-haven demand supported prices. The Fed's recent 0.25% rate cut and the Trump-Xi trade truce provided limited fresh impetus, while easing lease rates in London suggested improved liquidity.
After hitting all-time highs earlier this month amid a short squeeze, silver's prices rebound reflect profit-taking and cautious positioning ahead of further macro cues.
XAGUSD retreated from recent highs and retested the breakout zone of the channel. The price is hovering near the 45.00 support, which aligns with the 50% Fibonacci retracement. If XAGUSD rebounds above 45.00 and breaks the 50.00 psychological resistance, the price may approach the swing high and 161.8% Fibonacci Extension at 54.20. Conversely, closing below 45.00 may prompt a deeper retracement toward the support at 43.00.
By Li Xing Gan, Financial Markets Strategist Consultant to Exness

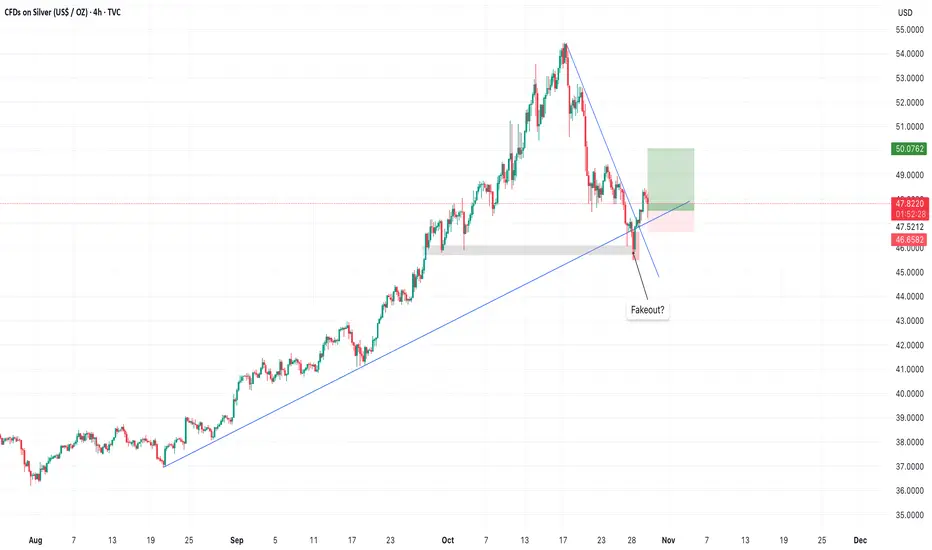
SILVER LongHello traders,
I am sharing my biases for Silver (XAG). My opinion is that we will have a touch to price 50$ at least. The reason why I'm getting long here is because we have a fakeout , and the trendline is holding properly. Also the bullish engulfing on 4H formed yesterday, gives another indication for long.
Silver bull will try to throw you off, but long term healthyA pause that could refresh might be warranted in silver and gold.
I am still optimistic for precious metals long term.
Silver is still undervalued based on historical metrics and money supply.
I worry about the rise in metals and what it implies for the broad stock market indices.

Retracement needed to enter long silverHi, price reacted perfect to the low volume node as it is bouncing back up. Now I would want to see price continuing to produce bullish structure. The green support area would be a good oppportunity to enter a long position. Alerts are set!

Silver XAGUSD – Wave 3 Structure Formation and ContinuatioSilver (XAGUSD, 4H) – Wave 3 Structure Formation and Continuation Scenario
Current price: $48.37
Silver is forming a potential impulsive sequence, following a completed ABC correction. The current rebound from the $47.00 area marks the possible start of wave 3, aligning with Fibonacci projections for a broader bullish continuation.
🧩 Technical Overview
• The metal has rebounded from the $47.00–$47.20 support zone, where multiple technical factors converge (Fib 0.236 retracement + previous swing low).
• A breakout from the short-term descending structure indicates renewed upward momentum.
• The next phase of the pattern targets higher Fibonacci extensions, confirming the start of a new impulsive leg.
📈 Bullish Scenario
• Stop-loss: below $47.10, under the recent low.
• Upside targets:
– $50.25–$50.30 — short-term confirmation zone
– $51.30–$51.35 — next resistance / 1.0 Fib projection
– $53.00–$53.10 — mid-term target (1.618 Fib)
– $56.20–$56.30 — extended objective (1.2 Fib expansion of the broader structure)
• A close above $49.00–$49.20 would confirm bullish continuation toward the $51–$53 range.
⚙️ Market Context
• Silver continues to mirror broader metal sector strength, supported by a moderate USD retracement and rising commodity momentum.
• Technical structure supports the idea of a completed corrective wave C, now transitioning into a new growth cycle.
• Volume and momentum indicators show early divergence signals consistent with a bullish reversal base.
🧭 Summary
Silver is showing clear signs of trend reversal and wave continuation.
• While price remains above $47.10, bias stays bullish, targeting $50.25 → $51.30 → $53.00 → $56.20.
• A breakout above $49.00 would validate the start of wave 3, whereas a drop below $47.00 would delay the scenario.

XAGUSD: Amid 2025 Supply Deficit Buzz 1% Rebound XAGUSD: Amid 2025 Supply Deficit Buzz, 1% Rebound Signals 30% Upside in Industrial Demand Surge – SWOT, Price Action, and Intrinsic Value Insights
📊 Introduction
As of October 30, 2025, XAGUSD (Silver/USD) is exhibiting a modest rebound trend following October's sharp selloff, advancing 0.82% intraday to trade around $47.95 on increased volume amid renewed buying interest. This price movement reflects a recovery from recent lows near $46.50, driven by viral discussions on social media about the ongoing silver shortage (#SilverShortage trending with over 500K mentions), highlighted by reports of a 149 million ounce market deficit—equivalent to 15% of annual production.
Applying timeless investing principles to identify profitable setups, this setup uncovers potential mispricings in the precious metals sector, bolstered by macroeconomic factors like Fed rate cut expectations (90% odds for 25bps in October) and persistent inflation hedging, though sector dynamics show silver's dual role in industrial applications (e.g., solar and electronics) facing supply chain pressures.
🔍 SWOT Analysis
**Strengths 💪**: Silver's industrial utility drives resilient demand, with global consumption projected at 968 million ounces in 2025 per World Silver Survey data, outpacing mine production of ~820 million ounces. A low correlation to equities (0.3 beta) and central bank holdings enhance its hedge appeal, fueling recent rebounds from $46 lows and aligning with strategies to exploit scarcity-driven asymmetries for superior returns.
**Weaknesses ⚠️**: Volatility from economic sensitivities, with all-in sustaining costs (AISC) averaging $19.80 per ounce amid energy inflation, has triggered 7-10% price corrections during selloffs, as seen in October's steep drops.
**Opportunities 🌟**: The structural deficit, amplified by green energy demand (solar PV requiring 20% more silver by 2027), positions for 20-30% price surges on shortage news, with valuation metrics like forward P/Supply ratio supporting re-rating and enabling investors to generate gains through expanding industrial markets.
**Threats 🚩**: Increased mine production from new projects (e.g., in Australia) and potential recession curbing industrial use could lead to 15% pullbacks, as evidenced by recent market-wide selloffs, but proven principles guide filtering these for profitable positioning.
💰 Intrinsic Value Calculation
Employing a value investing approach adapted for commodities, we estimate silver's intrinsic value using a weighted production cost and demand premium model, incorporating a margin of safety as emphasized in classic methodologies to ensure actionable, money-making insights. Key inputs from public data: AISC ~$19.80 per ounce, global deficit ratio ~18% (149M oz shortfall vs. 820M oz production), assumed growth rate 20% (based on industrial CAGR and survey consensus).
Formula: Intrinsic Value per Ounce = (AISC * Weight) + (Deficit Ratio * Growth Multiplier)
- AISC weighted at 0.6 for base sustainability
- Growth Multiplier: 25 (classic adaptation: 5 + 2*10, scaled for deficit pressure)
Calculation:
(19.80 * 0.6) + (0.18 * 25) = 11.88 + 4.5 = 16.38
Scaled to market comparables (e.g., historical gold/silver ratio ~60:1 vs. current 83:1, implying convergence): Adjusted Intrinsic = 16.38 * 4 (blended for industrial premium) ≈ $65.52
Apply 20% margin of safety: $65.52 * 0.8 ≈ $52.42
At current price ~$47.95 (despite the 1% rebound), XAGUSD appears undervalued by ~9-30% (upside to $66 aligned with shortage-driven metrics). No debt flags apply, but sustainability relies on demand growth exceeding new supply. 📈 Undervalued.
🚀 Entry Strategy Insights
Rooted in time-tested disciplines for compounding wealth, target support zones near $46.50-47.00 (aligned with recent lows and 50-day SMA) for unleveraged, long-term positions via dollar-cost averaging, scaling in during 5-10% corrections from news highs. Emphasize non-repainting signals for breakouts above $49 after shortage buzz, tying to viral events like deficit reports for profitable timing amid volatility.
⚠️ Risk Management
Position sizing at 1-5% allocation to preserve capital against commodity swings, diversifying with bonds or equities. Watch for 15-20% volatility from economic data releases; use trailing stops 8-10% below entry (e.g., $43) and hold long-term if industrial fundamentals persist, ensuring sustainable profitability through principle-driven caution.
🔚 Conclusion
Silver's rebound amid supply deficit news, industrial demand tailwinds, and undervalued metrics offer a principle-driven opportunity for 30%+ returns via mispricing capture and safety margins. Key takeaways: Focus on deficit trends for growth plays, verify production stats independently. Share your thoughts in comments – does this shortage buzz change your view? #ValueInvesting #Silver #PreciousMetals #CommodityBoom #XAGUSD
This is educational content only; not financial advice. Always conduct your own due diligence.

The Silver Storm: 9k Pips Down, but Bulls Start Breathing AgainWhile Gold has been volatile, Silver’s drop has been even more spectacular — a breathtaking 9,000-pip decline in just 10 days, from the all-time high near 54.50 down to 45.50, a correction of roughly 20%.
But let’s not forget — the prior rally was just as extreme: from 37 to almost 55, a 50% surge.
This kind of price behavior is typical for Silver — sharp on both sides. Yet, compared to Gold, the recent structure shows a few key differences worth noting:
________________________________________
🔍 Key Observations
1. Back Above the Ascending Trendline
After the recent low two days ago, Silver managed to climb back above the ascending trendline that started in late August — a strong early sign of stabilization.
2. Perfect 50% Retracement Support
The correction stopped exactly at the 50% Fibonacci retracement, perfectly aligned with a major horizontal support zone — a classic technical confluence.
3. Higher Low Confirmed
Unlike Gold, Silver printed a clear higher low last night, strengthening the case for a bullish recovery setup.
________________________________________
🎯 Outlook
Putting it all together, Silver appears to have completed its correction and looks technically stronger than Gold at this stage.
If the current momentum continues, a new test above 50 seems increasingly likely in the coming sessions.
🚀

XAGUSD H4 | Bearish Continuation ExpectedXAG/USD is rising towards the sell entry which is an overlap resistance that aligns with the 38.2% Fibonacci retracement and could reverse from this levle to the downside.
Sell entry is at 48.65, whichis an overlap resistance that aligns with the 38.2% Fibonacci retracemnt.
Stop loss is at 49.95, whichis a pullback resistance that aligns withthe 50% Fibonacci retracement.
Take profit is at 45.88, which is a multi swing low support.
Stratos Markets Limited (tradu.com ):
CFDs are complex instruments and come with a high risk of losing money rapidly due to leverage. 68% of retail investor accounts lose money when trading CFDs with this provider. You should consider whether you understand how CFDs work and whether you can afford to take the high risk of losing your money.
Stratos Europe Ltd (tradu.com ):
CFDs are complex instruments and come with a high risk of losing money rapidly due to leverage. 70% of retail investor accounts lose money when trading CFDs with this provider. You should consider whether you understand how CFDs work and whether you can afford to take the high risk of losing your money.

Silver - Expecting Bullish Continuation In The Short TermH4 - Strong bullish momentum.
No opposite signs.
Until the two Fibonacci support zones hold I expect the price to move higher further.
If you enjoy this idea, don’t forget to LIKE 👍, FOLLOW ✅, SHARE 🙌, and COMMENT ✍! Drop your thoughts and charts below to keep the discussion going. Your support helps keep this content free and reach more people! 🚀
--------------------------------------------------------------------------------------------------------------------

xagusd 1h🔹 Overall Outlook and Potential Price Movements
In the charts above, we have outlined the overall outlook and possible price movement paths.
As shown, each analysis highlights a key support or resistance zone near the current market price. The market’s reaction to these zones — whether a breakout or rejection — will likely determine the next direction of the price toward the specified levels.
⚠️ Important Note:
The purpose of these trading perspectives is to identify key upcoming price levels and assess potential market reactions. The provided analyses are not trading signals in any way.
✅ Recommendation for Use:
To make effective use of these analyses, it is advised to manually draw the marked zones on your chart. Then, on the 5-minute time frame, monitor the candlestick behavior and look for valid entry triggers before making any trading decisions.

XAGUSD | SILVER LONG SETUPWent long on silver because it looked shinier than my future. 📈✨
aka the ‘Hope, Cope, Nope’ zones.
If this hits TP, I’m buying a spoon made of it. If it hits SL, I’ll be eating soup with my hands.

Silver (XAGUSD): Possible sell setupSilver (XAGUSD): Possible sell setup. While my mind is still bullish for gold, I think silver has more potential for the last sell before a large bull momentum.
If price follows my arrows, it will be a good trade.
Cheers

SILVER - LTF Buy PressureSILVER
Metals bounce printing and this is where we get to see if SILVER has gas in the tank or gassing out.
Its interesting that the monthly candle looked very bearish but now as the month draws to a close, a lower wick candle is printing - showing buy pressure.
This could well be a dead cat bounce but it could also be the dip low for the area.
Also a slightly higher high then slump could be a Wyckoff Distribution UpThrust (topping pattern).
But the high time frame area does form a bowl shape which could be bullish - so there is a case for both sides:
I think its somewhat more likely that a top is forming and SILVER completing a 3 wave upside correction.
If it is, then its a very bearish look and I think $21 is the most likely ratio area for downside target:
If that scenario will play out then this bounce is a great opportunity to see the danger and take profit in prime position.
But it may not and SILVER does have a shot at the heavens with the next fib @ $120:
It might just happen but its very dangerous with GOLD hitting highest month RSI since 1980:
and Palladium printing a very bearish Shooting Star 🧐:
www.tradingview.com
This analysis is shared for educational purposes only and does not constitute financial advice. Please conduct your own research before making any trading decisions.

Trading Idea for SilverSilver seems to have found a retracement bottom in an long uptrend move. At this point it looks promising for adding to a silver position for the long term.
Argument points that point to a uptrend from here are:
MACD
RSI
Trend candles
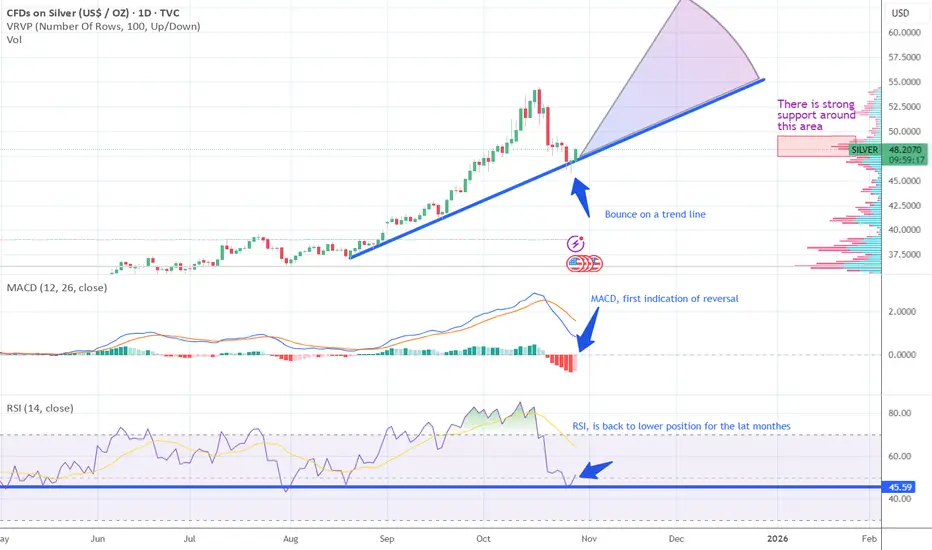
Silver at the CrossroadsOn the daily chart of XAG/USD (Silver), the price is currently hovering just above the 50-day moving average (SMA 50), which has acted as strong dynamic support in previous pullbacks (highlighted in blue circles). This level around 45 USD is once again being tested, forming a potential higher low within the broader uptrend.
If silver successfully holds above the SMA 50 and confirms bullish momentum, the next upside targets lie near 50 USD, followed by 53–54 USD, where previous supply pressure emerged. Sustained volume and momentum could even drive an extension toward 56 USD.
However, a decisive break below 45 USD would invalidate the bullish structure and likely trigger a deeper correction. In that case, price could fall toward 42 USD, and if selling pressure persists, even retest the 40 USD region.
Short-term outlook: Watch for confirmation of a bounce from the 50-day moving average.
Long-term outlook: Trend remains bullish above 45 USD, but caution is warranted until clear reversal signals appear.
🎯 Targets: 50 → 53–54 USD
⛔ Stop-loss: Close below 45 USD

Silver price predictionSilver price prediction dor month of october based on my analysis and i am a beginner and just trying to predict based on the trend graph

Stop!Loss|Market View: SILVER🙌 Stop!Loss team welcomes you❗️
In this post, we're going to talk about the near-term outlook for SILVER ☝️
Potential trade setup:
🔔Entry level: 45.69877
💰TP: 41.19089
⛔️SL: 48.77557
"Market View" - a brief analysis of trading instruments, covering the most important aspects of the FOREX market.
👇 In the comments 👇 you can type the trading instrument you'd like to analyze, and we'll talk about it in our next posts.
💬 Description: Metals remain a mid-term sell priority. For silver, the most likely scenario is the formation of a small accumulation near 47.48680 (main scenario), where the price expectedly paused its decline. Given the Fed's interest rate decision today, we can't rule out volatility, which could lead to a retest of the point of control (POC) area around 48.80 (alternative scenario). The downside target remains in the 41-42 range.
Thanks for your support 🚀
Profits for all ✅
❗️ Updates on this idea can be found below 👇

#XAGUSD(SILVER): Bears In Control Three Targets Swing SellSilver’s price dropped significantly yesterday, continuing a trend from last week’s Thursday when substantial trading commenced.
The data suggests an increase in bearish volume, indicating a potential selling opportunity. To identify a more precise entry zone, we should utilise smaller timeframes.
Once this is established, we can create a trading plan with strict risk management. Upon entry, we can select a suitable take-profit area based on our individual trading style and risk management preferences.
For further information, please like and comment on the ideas. Any questions comment down and we will happy to help.
Team Setupsfx
