SILVER LONG FROM SUPPORT
SILVER SIGNAL
Trade Direction: long
Entry Level: 4,629.4
Target Level: 4,962.5
Stop Loss: 4,404.9
RISK PROFILE
Risk level: medium
Suggested risk: 1%
Timeframe: 3h
Disclosure: I am part of Trade Nation's Influencer program and receive a monthly fee for using their TradingView charts in my analysis.
✅LIKE AND COMMENT MY IDEAS✅
Trade ideas

Silver - 3 drives to 46Silver is in correction before the next leg up. Presently within a intraday consolidation.
A suggestion for 3 drives and price to test 46. Some call this the bouncing ball and is a trend continuation pattern.
A short consideration on chart.
Long term I am bullish on this metal.

Break + Bearish FlagA 4H bullish trend line break set the bias to Short
Then 1H Bearish flag break signals the entry for short
With SL at the 4H resistance
TP at the 4H trend line
Once price break the 4H LL then move SL to LH

XAGUSD H4 | Bearish Continuation setupBased on the H4 chart analysis, we can see that the price has reacted off the sell entry, which is an overlap resistance level that aligns with the 23.6% Fibonacci retracement and could potentially drop from this levle to the downside.
Sell entry is at 47.66, which is an overlap resistance level that aligns with the 23.6% Fibonacci retracement
Stop loss is at 49.28, whic is a pullback resistance that aligns with the 38.2% Fibonacci retracement.
Take profit is at 44.36, which is a pullback that aligns with the 78.6% Fibonacci retracement.
Stratos Markets Limited (tradu.com ):
CFDs are complex instruments and come with a high risk of losing money rapidly due to leverage. 68% of retail investor accounts lose money when trading CFDs with this provider. You should consider whether you understand how CFDs work and whether you can afford to take the high risk of losing your money.
Stratos Europe Ltd (tradu.com ):
CFDs are complex instruments and come with a high risk of losing money rapidly due to leverage. 70% of retail investor accounts lose money when trading CFDs with this provider. You should consider whether you understand how CFDs work and whether you can afford to take the high risk of losing your money.

Silver Ascending channel breakdown down trend strong📉 #Silver (XAG/USD) Technical Outlook – 1H Timeframe
⚙️ Price has broken down from the ascending channel, showing clear rejection and strong selling pressure from the resistance area near $49.200.
💥 Bears are gaining momentum, confirming a potential short-term downtrend.
🎯 Technical Targets:
1️⃣ $48.500 – Initial support / 1st target
2️⃣ $47.500 – Secondary bearish objective
3️⃣ $46.000 – Major support zone / Final target
🚨 Bias: Bearish
📊 Structure: Channel breakdown
💪 Momentum: Sellers in control
🕒 Watch for retests of the $49.200 zone for potential short entries with confirmation.
#SilverAnalysis #XAGUSD #Commodities #TechnicalAnalysis #PriceAction

Silver: Metals Enter a Confident Correction PhaseSilver, like other metals, is also aiming for lower levels.
A short position is reasonable here too — stop above today’s high, target 44.75.
Entering at current levels looks appropriate.
Stop above today’s high.
Colleagues, this is not a trend reversal and not a metals crash — it’s a correction within an ongoing uptrend.
The trend remains upward, so let’s work carefully: use stop-losses and avoid going all-in!
I believe that before the New Year we’ll see growth again and enter another bullish cycle — but for now, we’re moving lower.

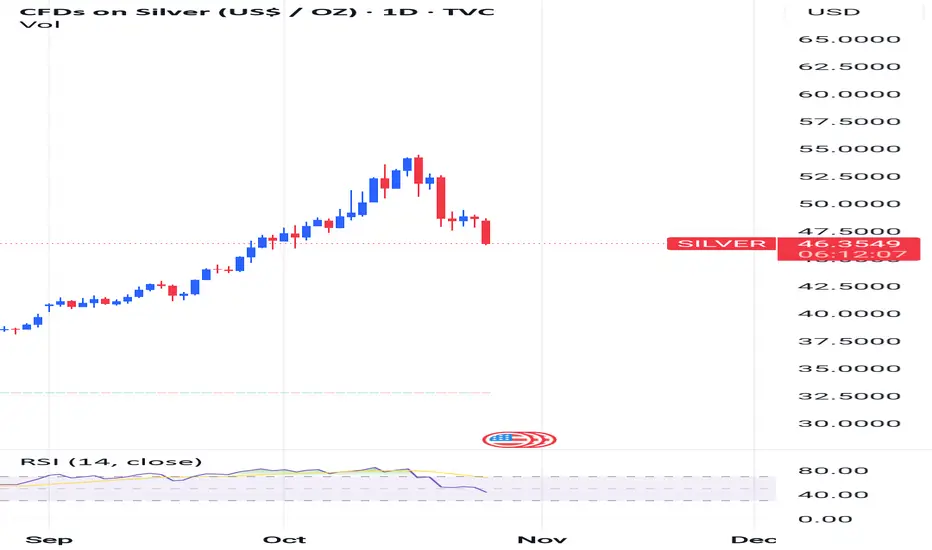
Silver Analysis – 26 October 2025
- Silver broke support zone
- Likely to fall to support level 45.00
Silver recently broke the support zone between the support trendline from August, support level 48.00 and the 38.2% Fibonacci correction of the upward impulse from August.
The breakout of this support zone accelerated the active minor correction 2 of the extended impulse wave (3) from August.
Silver can be expected to fall further toward the next support level 45.00, the breakout of which can lead to further losses toward the round support level 40.00.

Bullish idea for silverIt's been very exciting to watch to watch gold and silver tearing up the charts. We've seen a beautiful retracement on silver (and gold as well).
Silver cleared that OB and now I'm waiting for any meaningfull reaction to this area of interest.
Ideally I would like to see it touch the edge of the low volume node (blue) and start making bullish structure. That would be my cue to step into a long position. TP would be near the last ATH, but with the given market conditions I would rather trail my SL further into profit.
If price fails to bounce of the low volume node, we might see a further drop to the 43,500 area.
For now we just set alerts and monitor PA

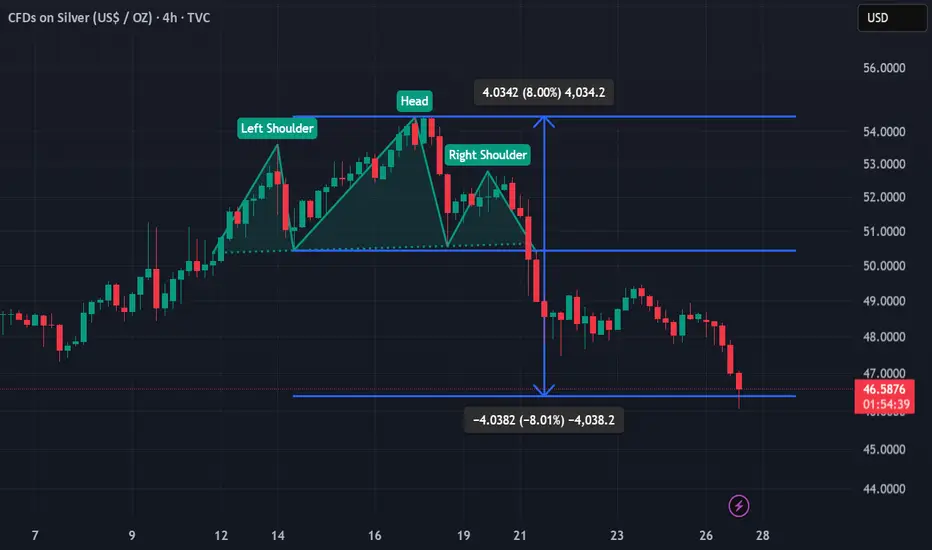
Silver/$XAUUSD Head and shoulders patternSilver bouncing off of the head and shoulder's pattern target zone around 46.5ish. will the price reverse from this point on?
Bounce BackIn Upper Level Warn In Advance, Don't Make new Positions here.
Now Silver down 16.8 % in just 2 weeks.
Now 44.88/45.88$ some Support zone.
Some Bounce Back Possible at this level.
Keep in mind we play only for dad cate bounce.
SILVER - BEARISH MOVE!Hello traders,
The Silver price failed to create a new higher high!
Currently, The higher low is broken (change of character).
So, I expect a bearish move📉
__________
TARGET: 46.99000🎯


SilverTechnical Analysis – XAG/USD (Silver)
After a strong downtrend, the price of silver (XAG/USD) shows clear signs of seller exhaustion at the 48,000 level, which now acts as key support. A breakout of the downtrend line indicates a possible reversal and renewed buying momentum.
As long as the price remains above support, the outlook favors an upward movement toward the resistance at 51,500–52,000, where the next point of liquidity and selling interest is located.
*A close below 47,800 would invalidate the bullish scenario.

XAGUSD - Signal#XAGUSD - Signal
H4 - Formation of the 3rd wave + breakout of the trend line. Stop behind the high of the 2nd wave.
Entry: 47.72828
TP: 46.31355 - 45.58804 - 44.36677 - 41.16757
Stop: 49.09465

Silver’s Bull Run Isn’t Over Yet – Here’s Why!Hey traders, today is a great time to revisit the Silver vs. Gold debate .
Fundamentally, Silver ( OANDA:XAGUSD ) is currently hitting some pretty impressive levels. In fact, we’ve just seen Silver break above its All-Time High(ATH), surpassing $50, driven by strong industrial demand and global economic uncertainties .
What does this mean for us? Well, while Gold ( OANDA:XAUUSD ) remains the classic safe haven, silver’s dual role—both as a precious metal and a key industrial commodity—gives it a unique edge right now. The recent breakout suggests that silver might actually be an even more compelling bullish play than gold in the current market environment.
So if you’re feeling bullish, there’s a solid fundamental case for silver shining a bit brighter these days. Let's keep an eye on how it moves.
---------------------------------------------------------
Let’s dive into the 4-hour timeframe for silver . Recently, with the help of a head and shoulders pattern , silver began a correction and reached its target .
At the moment, it looks like Silver has completed its pullback to a heavy resistance zone($49.82-$43.00) and is now moving near a Potential Reversal Zone(PRZ) and a Support line .
From an Elliott Wave perspective , it seems that silver has completed its main wave 3(New ATH=$49.82) and is currently working through its main wave 4 , which so far looks like a Zigzag Correction .
I expect that Silver will resume its upward movement and climb at least up to about $50.77(First Target) .
Second Target: $52.61
Stop Loss(SL): $45.82(Worst)
Please respect each other's ideas and express them politely if you agree or disagree.
Silver/ U.S. Dollar Analyze (XAGUSD), 4-hour time frame.
Be sure to follow the updated ideas.
Do not forget to put a Stop loss for your positions (For every position you want to open).
Please follow your strategy and updates; this is just my Idea, and I will gladly see your ideas in this post.
Please do not forget the ✅' like '✅ button 🙏😊 & Share it with your friends; thanks, and Trade safe.

Silver support retest at 4737The Silver remains in a bullish trend, with recent price action showing signs of a corrective pullback within the broader uptrend.
Support Zone: 4737 – a key level from previous consolidation. Price is currently testing or approaching this level.
A bullish rebound from 4737 would confirm ongoing upside momentum, with potential targets at:
4980 – initial resistance
5066 – psychological and structural level
5166 – extended resistance on the longer-term chart
Bearish Scenario:
A confirmed break and daily close below 4737 would weaken the bullish outlook and suggest deeper downside risk toward:
4667 – minor support
4600 – stronger support and potential demand zone
Outlook:
Bullish bias remains intact while the silver holds above 4737. A sustained break below this level could shift momentum to the downside in the short term.
This communication is for informational purposes only and should not be viewed as any form of recommendation as to a particular course of action or as investment advice. It is not intended as an offer or solicitation for the purchase or sale of any financial instrument or as an official confirmation of any transaction. Opinions, estimates and assumptions expressed herein are made as of the date of this communication and are subject to change without notice. This communication has been prepared based upon information, including market prices, data and other information, believed to be reliable; however, Trade Nation does not warrant its completeness or accuracy. All market prices and market data contained in or attached to this communication are indicative and subject to change without notice.

I may have been too hasty...a second lookI took a second look at the wave count from the last drop...on a micro level (15 min) you can discern a clean 5 wave pattern to make up a C leg(yellow)...therefore it is too early to call this a 5-3-5 vs a 3-3-5 pattern...if this support zone holds then we will likely see the ABC (purple) take up back up to the $50-$51 range...then the final leg down (5 wave pattern) likely to the mid $45-$46 range vs my previous target of $40-$42...
The key is to remain patient and wait for the pivot where we should exceed $60.

XAGUSDTrading forex based on strong fundamentals is beneficial because it allows investors to make informed decisions grounded in real economic data rather than speculation. By analyzing key indicators like interest rates, inflation, GDP growth, employment, and geopolitical stability, a trader can anticipate currency movements driven by macroeconomic forces. This approach helps identify long-term trends and reduces emotional or impulsive trading, offering more consistent and sustainable profits. In essence, good fundamentals turn forex trading from a gamble into a strategic investment rooted in economic reality.

Support has broken...and we have a 5 wave moved down...Folks, I was hoping we would see a 3-3-5 retrace which would complete around the $45-46 range, however, we have not confirmed a 5 wave move down which meand the pattern will actually be a 5-3-5 and we will go lower than originall expected...if heavily long you will be given a chance to lighten up on the next bounce (ABC pattern back up)...and you will be given a chance to buy lower...as marked on the chart...these are my expectations and is not investment advice.

SILVER- ARE YOU READY FOR BIG RALLY?WHY SILVER ?
🟡 1. De-Dollarization and Central Bank Demand
Central banks are buying gold at record levels, especially from emerging economies (China, India, Russia, Türkiye, etc.).
They’re reducing exposure to USD reserves amid rising U.S. debt and weaponization of the dollar (sanctions, SWIFT restrictions).
This steady non-speculative demand floor supports gold prices structurally.
2022–2024 already saw record official purchases — this trend is unlikely to reverse soon.
💵 2. U.S. Fiscal Imbalance and Debt Spiral
The U.S. debt-to-GDP ratio has surpassed 120%, and interest payments alone are nearing $1 trillion/year.
The Fed is trapped: tightening aggressively hurts the economy, while easing fuels inflation and devalues the dollar.
Either scenario (stagflation or monetary easing) is bullish for gold, since gold thrives on negative real yields.
🧩 3. Negative Real Interest Rates (Likely Return)
Once inflation becomes sticky and the Fed pivots (cuts rates), real yields could fall below zero again.
Gold performs best when inflation outpaces nominal rates — as seen in the 1970s and post-2008 cycles.
The 2020s are shaping up similarly: high fiscal spending, supply shocks, and weak productivity = persistent inflation risk.
🌍 4. Geopolitical Tension and Global Fragmentation
Rising geopolitical risks (Middle East, Ukraine, Taiwan Strait) create safe-haven flows.
Gold acts as insurance against systemic shocks.
The world is fragmenting into blocs (BRICS+ vs West), increasing uncertainty — and central banks want neutral reserves (gold fits perfectly).
🧠 5. Technological & Monetary Shifts
Digital currencies (CBDCs) and tokenized gold are making gold more liquid and usable in digital ecosystems.
If gold becomes integrated into digital payment systems (as collateral or backing), it could see renewed monetary relevance.
This could bring a valuation re-rate similar to Bitcoin’s narrative-driven growth.
📈 6. Technical and Historical Perspective
Gold’s long-term chart shows a major cup-and-handle pattern (multi-year formation).
A breakout above $2,400–$2,500 could target $3,000–$3,500 within the next few years.
Historically, gold tends to surge in late-cycle or post-recession phases — exactly where we’re heading.
🧮 7. Portfolio Diversification & ETF Flows
As equity and bond correlations rise, institutional investors seek uncorrelated assets.
Gold fits perfectly in modern risk-parity portfolios.
Expect renewed inflows into gold ETFs and mining stocks once rate cuts begin.

Very Risky!!2nd entry setup on Silver. Am not taking this trade on my accounts.
Just watching to see the setup plays out

27.10.25 Morning ForecastPairs on Watch -
OANDA:XAGUSD
FX:EURCAD
FX:AUDUSD
A short overview of the instruments I am looking at for today, multi-timeframe analysis down to what I will be looking at for an entry. Enjoy!

SILVER LIKELY TO GO HIGHER|LONG|
✅SILVER is currently trading within a bullish dealing range between the demand and supply areas. After engineering liquidity beneath internal equal lows, strong displacement confirms bullish order flow. Expect continuation toward external liquidity above 50.50$. Time Frame 4H.
LONG🚀
✅Like and subscribe to never miss a new idea!✅
