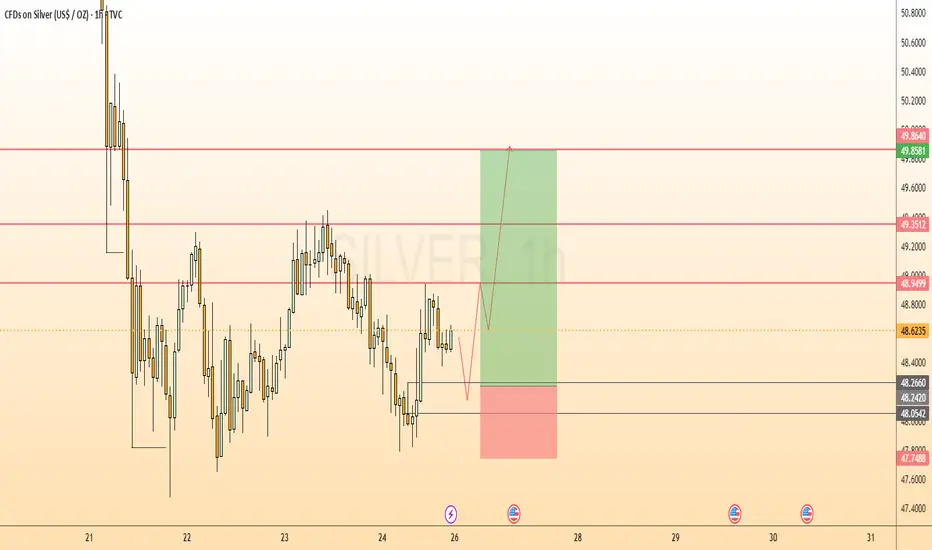
SILVER UpdateNext move on the way, focus on proper risk management & stay disciplined. Wishing you successful trades..!
Key Reason:
1. 1H Bullish OB formation.
2. BISI still in pending.
3. From this zone possible bullish move expected.
Let's see how it will work.
Trade ideas
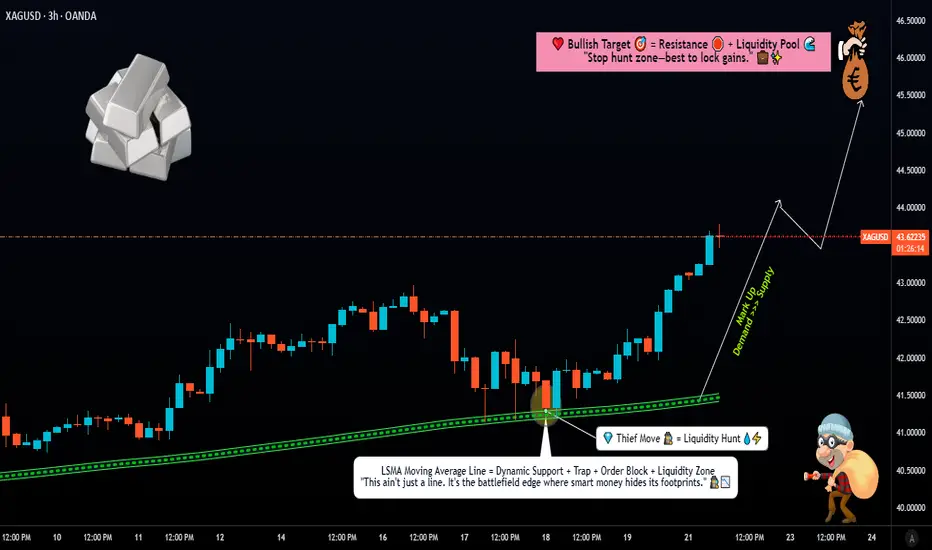
Silver Rally in Play – Prepare Layered Entries!🔥 Silver Heist: XAG/USD Day Trade Wealth Map 🤑💰
🎉 Ladies & Gentlemen, Welcome to the Thief’s Vault! 🚨 Get ready to swipe some shiny profits with this XAG/USD (Silver vs. US Dollar) bullish breakout plan! Our Metal Market Wealth Strategy Map is locked and loaded for a day trade adventure. Let’s dive into the heist with a polished, professional, yet sneaky fun vibe! 😎
📈 The Setup: Bullish Bandits on the Move! 🐂
🔍 Market Context: Silver (XAG/USD) is flashing bullish vibes 📡 with a confirmed Least Squares Moving Average (LSMA) pullback. The price has swept liquidity at the dynamic moving average support, giving bull traders the upper hand. 💪
🚀 Why It’s Hot: The bulls are charging as the price respects the dynamic support, signaling strength and a potential breakout. The market’s screaming, “Time to stack those silver bars!” 🪙
🏦 The Heist Plan: Thief-Style Layered Entries 🎯
🛡️ Entry Strategy: We’re using the infamous Thief Layering Strategy! 🕵️♂️ Place multiple buy limit orders to catch the price at key levels. Suggested entry layers:
$42.50
$43.00
$43.50
💡 Pro Tip: Feel free to add more layers based on your risk appetite! Stack those orders like a master thief. 😏
📝 Entry Note: You can enter at any price level within the bullish zone, but layering gives you the edge to scale in like a pro. 📊
🛑 Stop Loss: Protect the Loot! 🔒
🛑 Thief SL: Set your stop loss at $41.50 to keep your capital safe from market traps. 🕳️
📣 Note: Dear Thief OG’s (Ladies & Gentlemen), this SL is my suggestion, but it’s your heist, your rules! Adjust based on your risk tolerance and make those profits yours. 💸
🎯 Take Profit: Cash Out Like a Boss! 💼
🎯 Target: We’re aiming for $46.00, where strong resistance, overbought conditions, and potential traps await. 🪤 Lock in profits before the market pulls a fast one!
📣 Note: Dear Thief OG’s, this TP is my call, but you’re the master of your vault! Take profits at your discretion and secure the bag. 🤑
🔗 Related Pairs to Watch 👀
🔎 #XAUUSD (Gold vs. US Dollar): Gold and silver often move in tandem due to their precious metal correlation. A bullish XAU/USD could reinforce our XAG/USD setup. 🪙
🔎 USD Index (#DXY): A weaker US dollar typically boosts precious metals. Watch for DXY weakness to confirm bullish momentum in XAG/USD. 📉
🔎 #AUDUSD: The Aussie dollar has a positive correlation with silver due to Australia’s commodity-driven economy. A rising AUD/USD could signal strength in XAG/USD. 🇦🇺
🔑 Key Points & Correlations
🔔 Liquidity Sweep: The recent pullback to the LSMA support cleared out weak hands, setting the stage for a bullish surge. 🚀
🔗 Correlation Insight: Silver’s price action often mirrors gold (XAU/USD) due to their shared safe-haven status. A declining DXY or rising AUD/USD can amplify this setup’s potential. 📊
⚖️ Risk Management: Use the layered entry strategy to spread risk and maximize reward. Always respect your stop loss to avoid getting caught in a market trap! 🕵️♂️
⚠️ Disclaimer
This is a Thief-Style Trading Strategy crafted for fun and educational purposes. Trading involves risks, and I’m not a financial advisor. Always do your own research and trade at your own risk. 😎
✨ If you find value in my analysis, a 👍 and 🚀 boost is much appreciated — it helps me share more setups with the community!
#️⃣ #XAGUSD #Silver #DayTrading #ThiefStrategy #Bullish #TradingView #SilverTrading #DayTrade #ThiefTrader #LSMA #ForexStrategy #MetalMarket #TradingIdeas #LayeredEntries #BullishSetup #TradingView
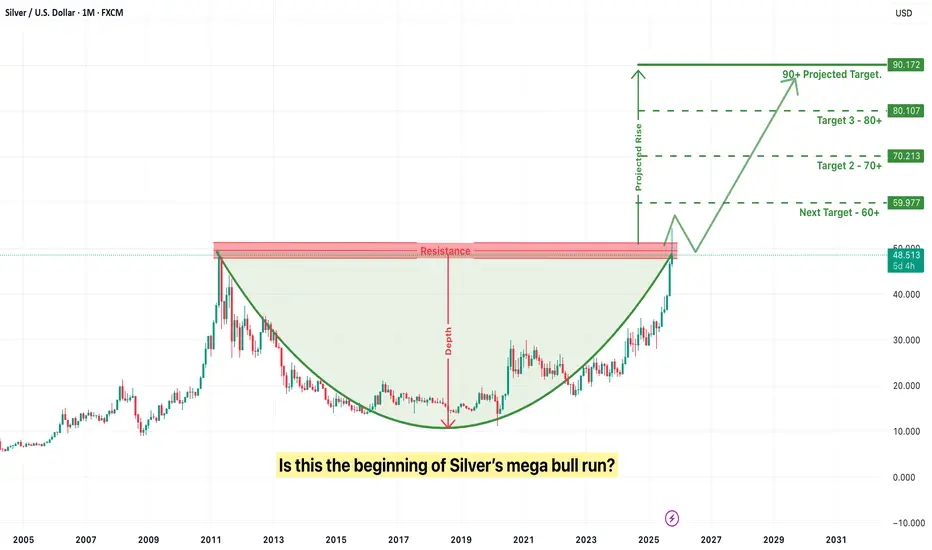
Is this the beginning of Silver’s mega bull run?For years silver has been seen as gold’s lesser companion — always important, but never truly leading. However, the world is now entering a new economic and technological era where silver is quietly transitioning from a secondary asset into a strategic metal of the future. What makes silver unique is that it is both an industrial metal and a monetary asset at the same time. Gold is used primarily for wealth protection, but silver has dual demand — it rises when technology adoption accelerates and it rises again when currencies weaken and investors seek a safe store of value. This rare combination places silver in a category of its own.
The most powerful driver behind silver’s future potential is the global energy and technology transformation. The world is rapidly shifting toward electric mobility, renewable power, high-speed communication networks and AI-scale computing. Every one of these megatrends directly increases silver consumption. Electric vehicles require significantly more silver than traditional cars because of their circuitry and conductivity needs. Solar panels have already become the single-largest industrial consumer of silver worldwide, and demand is projected to rise sharply due to green energy mandates and government policies. In the coming decade, silver will also be crucial to 5G infrastructure, robotics, space technology and medical-grade electronics. Simply put, modern technology cannot scale without silver.
While demand is rising rapidly, supply is structurally constrained. Most silver does not come from dedicated silver mines but as a by-product of mining other metals such as zinc, lead and copper. This means supply cannot simply increase when silver prices rise. If industrial base-metals mining slows, silver production automatically contracts. At the same time investment demand is rising, which creates a long-term deficit. This mismatch between rising demand and limited supply is exactly what leads to a major asset re-rating over time.
Another major factor supporting silver is the global macroeconomic cycle. Currencies across the world are losing value due to continuous money printing, rising debt and inflationary pressure. Investors are increasingly looking for hard assets that preserve purchasing power. Gold is traditionally the first choice, but it is already well accumulated and priced. Silver, being more affordable and under-owned, becomes the “accessible hedge” for the masses. Each time inflationary fears rise or fiat confidence falls, silver sees renewed investment flow.
Technically as well, silver is at a critical long-term juncture. The price structure is completing a multi-decade cup-and-handle pattern, which is one of the strongest bullish technical formations in commodity markets. Such large time-frame technical setups rarely appear, and when they do, their breakouts typically fuel multi-year trends rather than short rallies. A sustained breakout in silver has the potential to trigger a supercycle where price appreciation becomes exponential rather than linear.
However, while the long-term potential is extremely strong, investors should be aware of certain risks. Silver is far more volatile than gold and is known for sharp price swings in short timeframes. Breakouts can also produce temporary fake moves, trapping impatient investors who enter at the top and exit at the first correction. Because silver is tied to industrial demand, a short-term slowdown in the global economy can temporarily affect prices even when the long-term thesis remains intact. Another caution is the difference between physical silver and paper silver. Physical markets reflect real-world scarcity, while paper silver markets (ETFs, futures) can sometimes be suppressed by large institutional trading, creating short-term price distortions that do not reflect underlying fundamentals.
The key to winning with silver is adopting a patient, long-term perspective instead of a speculative trading mindset. Accumulation through systematic or staggered buying reduces timing risk and prevents emotional decision-making. A blend of physical holding for long-term security and digital exposure for liquidity creates the most efficient structure. Silver has historically rewarded patience and conviction while punishing emotional exits.
In conclusion, silver stands at the intersection of three powerful global shifts — technological transformation, monetary instability and resource scarcity. It is no longer just a precious metal; it is becoming a strategic asset for the coming decade. Gold protects capital, but silver has the potential to multiply it. This is why many economists, historians and market analysts believe silver is poised to become one of the most powerful wealth-building assets of the future.
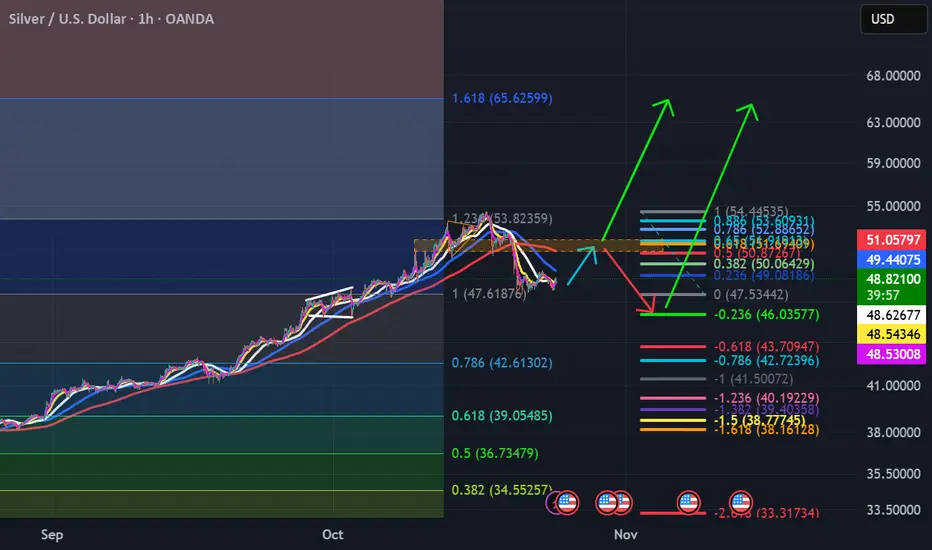
Siver may reach ATH again but not gold. 26/Oct/25 XAGUSD based on wave substructure silver may reach ATH again next week with price touching the upper trendline ( red) 3rd time at 55 +/-

Which direction is the silver copper?Just like the price analysis, it reacted to the specified ranges. Here we have two scenarios: If the price stabilizes and breaks the white range upwards, we can expect a bullish trend. Otherwise, the silver trend is still bearish.

SILVER XAGUSDSILVER IS POSITIONING FOR BUY FROM THE CURRENT PRICE ACTION BY CLOSE OF THE WEEK.AS THE MARKET OPENS I EXPECT A BULLISH CORRECTION INTO BREAK OF THE ASCENDING TRENDLINE (BAR).
SILVER IN CONTEXT.
Silver is a multifaceted precious metal valued for both its industrial applications and status as a store of value. It plays an essential role in various sectors due to its unique physical and chemical properties.
Key Characteristics of Silver
High Electrical and Thermal Conductivity: Silver is the best conductor of electricity and heat, which makes it indispensable in electronics and electrical applications.
Antimicrobial Properties: Silver is widely used in medical settings for wound dressings, coatings, and sterilization due to its germicidal capabilities.
Reflectivity: Its high reflectivity makes it useful in solar panels and certain optical applications like mirrors.
Major Industrial Applications
Electronics: Components such as switches, connectors, and conductive adhesives rely heavily on silver.
Solar Energy: Photovoltaic cells in solar panels use silver paste for efficient electricity generation.
Healthcare: Used in antimicrobial coatings and medical devices.
Jewelry and Silverware: Traditional uses, often mixed with other metals in alloys.
Other Uses: Batteries, photographic films (though decreased with digital), and catalysts.
Investment and Market Insights
Silver is traded actively as bullion, ETFs, futures, and options.
It tends to have higher price volatility compared to gold due to its dual role as an industrial metal and investment asset.
Price movements are influenced by industrial demand, inflation expectations, USD strength, and geopolitical factors.
Silver often has a strong correlation with gold but can diverge due to shifting industrial demand.
Summary
Silver’s importance spans from critical industrial applications in electronics and green energy to safe-haven investment. Its market price reflects a complex balance between industrial use and investment-driven demand, contributing to its volatility and attractiveness.
This makes silver an important commodity for diversified investment and industrial strategy.
TRADING STRATEGY.
WATCH US10Y
WATCH DXY DOLLAR INDEX
WATCH KEY SUPPLY AND DEMAND STRUCTURE FROM THE CHART.
RISK MANAGEMENT IS KEY.
#XAGUSD #SILVER #DOLLAR #DXY

XagusdSilver is at a crossroads with several possible scenarios:
First, if we are currently in the third wave of the third wave, the price could rise directly, breaking above the $50 level.
Second, we might see a correction in different forms if we assume this is a running flat corrective wave, where the price could drop down to around $20, and then rally strongly, surpassing $70 afterward.

I called silver at $30, now its heading toward $50I said silver would be worth $30/oz in February 2022. Now, its almost to $50. But RSI is very overbought, so caution is warranted.

Alternate paths to same destination...I am beginning to think that we have two alternate paths to the same destination...many have turned bearish and are saying we are headed back to $40-$42...I do not see that playing out...there is simply too much demand for silver globally for us to drop to those levels imo...I see one of these paths playing out...near term.
Possible long positionthis is what expected for XAGUSD.A possible long position with marked target( blue lines).

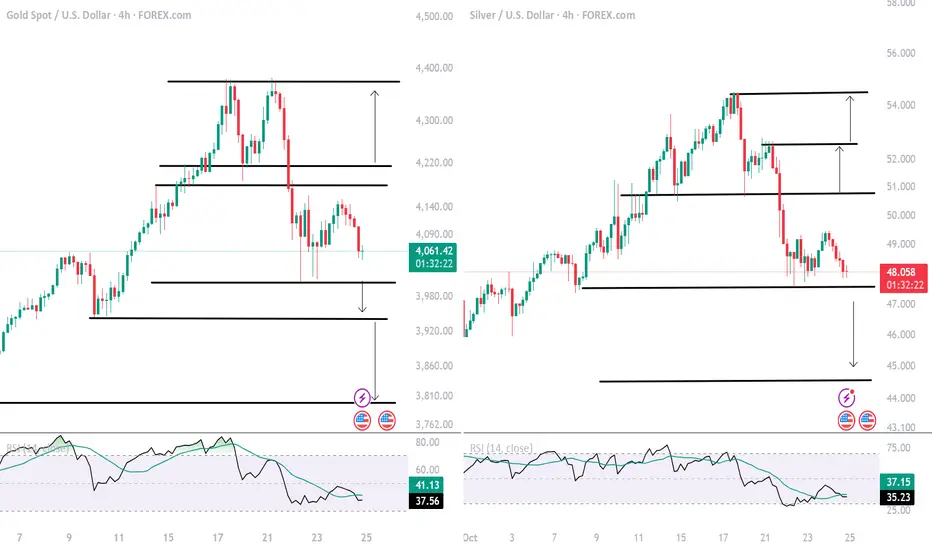
Gold, Silver Outlook: Haven Sentiment, Reversal Patterns on HoldFollowing the heated headlines on gold and silver — driving long lines outside jewelry stores and fueling intense media coverage and momentum — a contrarian signal has emerged. This signal was confirmed by classic reversal patterns, triggering the 300+ point selloff we witnessed this week.
Gold Outlook:
On the 4-hour chart, gold prices have formed a double-top pattern near the $4,380 peak, pulling back toward $4,000 support — a level that now defines two potential scenarios:
A sustained move below $4,000 — the double-top target and key support — could trigger another 300-point decline, with the next support zones around $3,920 and $3,780.
As price action remains above the target but below the neckline, the bearish bias persists. A clean break above $4,200–$4,240 would be required to reignite upside momentum toward $4,300–$4,380, after which new record highs could extend toward $4,900–$5,000.
Silver Outlook
On the 4-hour chart, silver has traced a head and shoulders reversal pattern, targeting the $47.30 level. If prices close back above the neckline at $50.80, gains may resume toward record levels, with key targets at $52.40, $54.40, and $56.60. Holding below $47 could extend losses toward $44.40 and $42.90, aligning with the trendline connecting consecutive higher highs between January 2023 and October 2024, setting up a potential bullish rebound.
- Razan Hilal, CMT
SILVER Local Long! Buy!
Hello,Traders!
SILVER SMC based analysis shows price reacting from the horizontal demand area where liquidity has been swept and bullish order flow may soon resume. Expecting a possible push upward toward the next target level once internal structure confirms a shift. Time Frame 5H.
Buy!
Comment and subscribe to help us grow!
Check out other forecasts below too!
Disclosure: I am part of Trade Nation's Influencer program and receive a monthly fee for using their TradingView charts in my analysis.

Silver corrective pullback support at 4737The Silver remains in a bullish trend, with recent price action showing signs of a corrective pullback within the broader uptrend.
Support Zone: 4737 – a key level from previous consolidation. Price is currently testing or approaching this level.
A bullish rebound from 4737 would confirm ongoing upside momentum, with potential targets at:
4980 – initial resistance
5066 – psychological and structural level
5166 – extended resistance on the longer-term chart
Bearish Scenario:
A confirmed break and daily close below 4737 would weaken the bullish outlook and suggest deeper downside risk toward:
4667 – minor support
4600 – stronger support and potential demand zone
Outlook:
Bullish bias remains intact while the silver holds above 4737. A sustained break below this level could shift momentum to the downside in the short term.
This communication is for informational purposes only and should not be viewed as any form of recommendation as to a particular course of action or as investment advice. It is not intended as an offer or solicitation for the purchase or sale of any financial instrument or as an official confirmation of any transaction. Opinions, estimates and assumptions expressed herein are made as of the date of this communication and are subject to change without notice. This communication has been prepared based upon information, including market prices, data and other information, believed to be reliable; however, Trade Nation does not warrant its completeness or accuracy. All market prices and market data contained in or attached to this communication are indicative and subject to change without notice.

SilverXAGUSD
- Completed " 12345 " Impulsive Waves and " ABC " Corrective Wave
- Break of Structure
- Supply Zone
- Fibonacci Level - 78.60%
- Order Block

Patiently waiting to buy Silver at an advantageous priceWith Silver very bullish I'm keen to buy and am waiting for a suitable opportunity to enter a long position with the intention of holding for several weeks. I am watching four likely scenarios on the 4-hour chart as follows:
A - green dotted line
Price forms a pennant before breaking through resistance at $52.50
1 - green solid line
Price finds support at $48-49 and breaks through resistance at $52.50
2 - blue line
Price drops further but finds support at $44
3 - black line
Price climbs to $52.50 then drops through support at $48-49 and through support at $44 but finds it at $41 where it starts its move higher.
Another scenario might be some combination of #2 and #3.
I am using these ideas as a guide although what actually unfolds might be completely different.
I drew the chart yesterday (Thu 24 Oct) since when price is currently following the blue line.

SILVER USDHI GUYS,
SILVER USD has formed the HS PRICE PATTERN H2, H1.
We are to find buy entries today in London session. take profit GRAND FINAL H4 HS (55.13932).
I Expect the trade to hold for possibly 1 week to profit area of interest
NOTE,
THE PATH AS ILLUSTRATED HAS NOT CHANGED, WE ARE STILL ON TRACK ON SCRIPT.

Bearish silver and a quick reversalI think there is high chances of bearish extended flat and a quick reversal in silver.
Silver in a double 3 pattern, a side ways behavior.On the larger time frame I am bearish for Gold and Silver both, but before that we are stuck in side ways price action visible on the 15 minutes chart. I think we will be done with the side ways price by the end of Friday or around the European session on Monday.

Three Failed Probes Hint at Silver UpsideAfter three failed probes beneath $48 and a bullish engulfing candle, some upside may be in store for silver.
While entry on a pullback would be preferred, longs could be considered around current levels with a stop below $48 for protection, targeting $51, which acted as both support and resistance earlier this month.
Even though the momentum picture has changed dramatically over the past week, RSI (14) has flattened just above 50 while MACD remains in positive territory despite crossing the signal line from above. Combined, the message is one of diminished upside pressure, not an outright bearish signal. As with this setup, more emphasis should be placed on price action rather than retaining a specific directional bias.
Good luck!
DS

New target for silver $71 after current consolidationNew target for silver $71 after current consolidation. If you're on leverage/margin, good luck with in-between roller coaster rides.
Silver Punches 45-Year Trend Line and Gets A Return PunchSilver prices reached a 45-year trend line going back to 1980 and has since retreated. The monthly candle for October is drafting a large wick to the upside similar to a shooting star candle formation.
In the video, we discuss some downside targets for XAGUSD of this correction that would be considered 'normal' after such a large runup.
Typical Elliott Wave patterns like this would call for a retracement back to the mid-40s and possibly $36-37.
See our written post from Sept 5 (attached below) when we mentioned "if silver does plow above $4.92, then the 1980 trend line will likely offer a bearish reaction."

a longer and deeper correction likely imoIn my opinion (IMO), we may be seeing the start of a longer and deeper correction...I could be off on this, however the bounce we are seeing at the moment is weekand looks corrective...this tells me we will likely see another major 5 wave move down...so either we see a 5-3-5 wave sequence or a 3-3-5 wave sequence...either way...I see us going back down to $38-$40 range in what will likely take a month or two to complete. I know this is not what we want to hear as silver bulls...but in the near to medium term I am bearish.
POSSIBLE XAGUSD SHORT SETUPANALYSIS
Last week:
>FRD(first red day) on Fri last week closing below Thurs low facilitating a CISD
This week:
>Mon price closed as an inside day
>Tues price closed in breakout(CIB) making the second day of bearish orderflow.
>Wed price closed in breakout as well however the price action was more of a range hence perceived as reaccumulation(acc)
>Thur: anticipating a purge and revert off Wed high and continuation of the bearish trend
