Trade ideas

(XAG)Huge and definite pump of silver to $250 A huge cup and handle pattern that has now broken its established neckline after 46 years and is ready for a big growth and explosion. This pattern and price growth are consistent and directly related to all sources and fundamentals. Even the Economist report can confirm this pattern. This growth is completely consistent with the explosion of artificial intelligence, data centers, electric cars, batteries, and consumer technology. This means that the era of widespread and industrial use of silver will reach a crazy peak. A 100% pattern has given a buy signal right now, and all oscillators, indicators, and trend patterns are also giving a buy signal and an imminent explosion. This is considered a once-in-a-lifetime opportunity with very little risk.
The first definitive target will be around $250 per ounce and the long-term target will be $449 per ounce, and the risk is also minimal, which means that gold will no longer grow significantly, and the industry, stocks, funds, and ordinary people will enter a period of large-scale silver purchases, resulting in a sharp increase in silver.

Official new high on SPOT mktsWe have an official new high on spot silver...accoring to my TV account, the silver futures is still down and not trading...I am very curious as to what shennanigans they have planned for us when the futures mkts reopen. As for me...I remain heavily long the metals and miners!
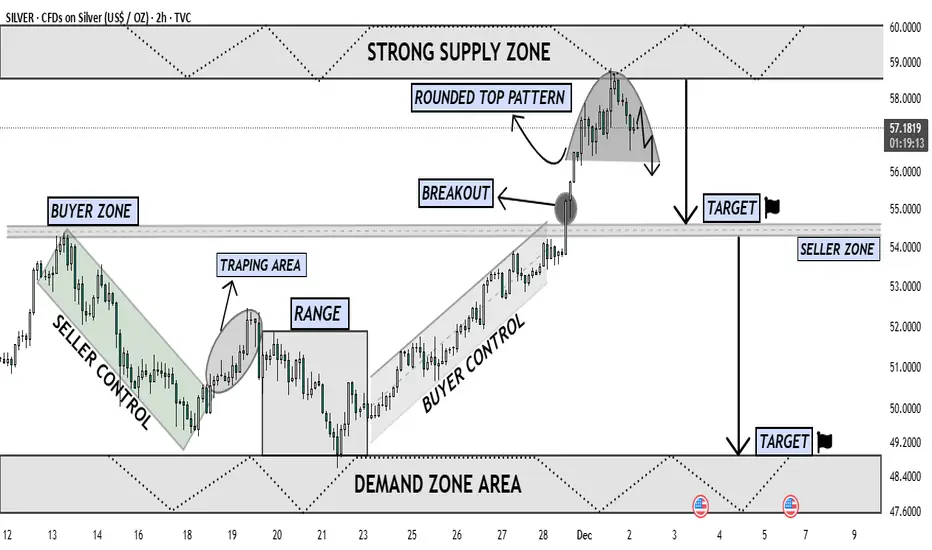
Silver Forming Major Top Near Supply Downside Retracement LikelyThe chart shows Silver reaching a major Strong Supply Zone near the 58–60 level, where price has reacted multiple times in the past. After a strong impulsive rally driven by Buyer Control, the market broke above the previous Buyer Zone, confirming bullish strength. However, once price entered the upper supply region, momentum started to fade, forming a clear Rounded Top Pattern — a classic distribution structure indicating exhaustion of buyers.
Following the breakout retest, buyers failed to continue upward, and sellers stepped in aggressively from the supply zone. The chart now shows a shift from buyer dominance to seller pressure, with price beginning to curve downward inside the rounded top. This shape reflects decreasing highs, weakening demand, and early reversal signals.
The projected move suggests that once the neckline of the rounded top breaks with strong bearish candle confirmation, price is likely to fall toward the first Target Zone around 54, which aligns with the Seller Zone and previous breakout structure. If bearish continuation remains strong, the next logical target lies in the Demand Zone Area between 48–49, where liquidity is expected to support a potential reversal or consolidation.
Overall, this chart indicates a high-probability corrective phase, with sellers preparing to reclaim control as the market rejects the supply zone and transitions into a deeper pullback phase. Buyers must show strong defense at the mid-support; otherwise, Silver could decline further toward the lower demand region.
XAGUSD Cup n handle breakoutXAGUSD Cup n handle breakout
Entry: 54.385
SL: 4104 (Below alligator jawline)
TP: 62.70 (Cup n handle TP)
RR: 1:2.78RR

Silver trying to break 45 YEARS horizontal resistance at $54 !!!Silver trying to break 45 YEARS horizontal resistance at $54 today !!! I made a prediction it would reach $54 by 26 Nov, but didn't quite there yet. Once $54 resistance is broken, silver will revalue itself between $100-$200 within 2 quarters. It's going to be an epic jaw dropping move.
Don't leverage/trade with margin... silver short term volatile moves will wipe you off financially for good. Buy the real bullion or ETF long term. Good luck silver stackers...

Silver/USD-bullish continuation. Next target at 66$Silver is moving up with the wave 5 red which aims at the immediate target of 66$ and higher.

SILVER: Forecast & Trading Plan
Remember that we can not, and should not impose our will on the market but rather listen to its whims and make profit by following it. And thus shall be done today on the SILVER pair which is likely to be pushed down by the bears so we will sell!
Disclosure: I am part of Trade Nation's Influencer program and receive a monthly fee for using their TradingView charts in my analysis.
❤️ Please, support our work with like & comment! ❤️

Silver Cup and Handle Pattern: Bullish SetupThis 4-hour chart on silver displays a textbook cup and handle formation.
The cup forms as silver rounds off a previous high and builds a base, signaling accumulation and renewed buying interest. The handle’s consolidation, often a descending channel, typically retraces less than half of the cup’s advance. Breakout confirmation comes when price closes above the handle’s downward resistance line
Statistically, the measured move upon breakout is often the depth of the cup added to the breakout level, indicating strong upside potential if the pattern completes successfully.
A conservative target is $54 - $57.
A silver rally can reflect broad risk-on sentiment. Historically, decisive moves in precious metals have sometimes coincided with bullish developments in the crypto market, triggered by macro events like Federal Reserve rate cuts or rising monetary inflation.

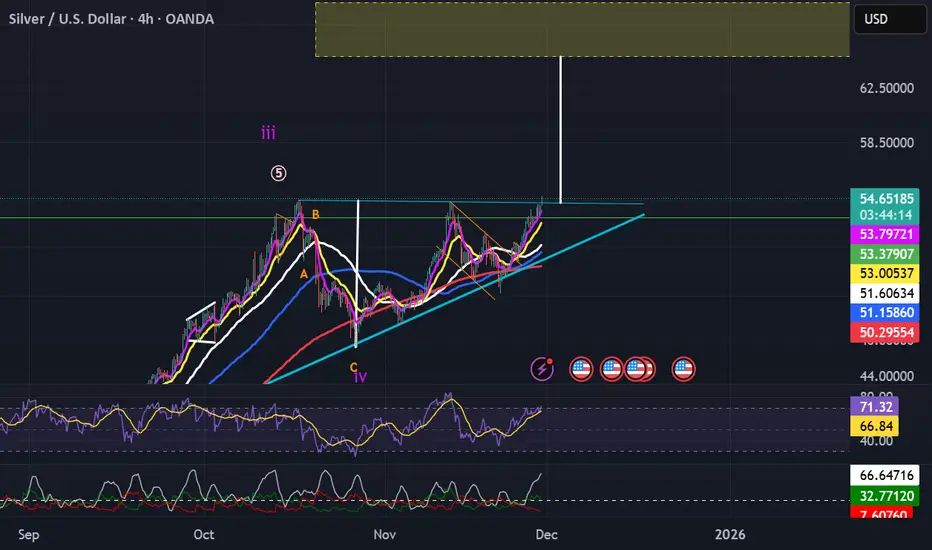
Spot Silver XAGUSD Aiming for All Time High, Targeting $57.4Spot Silver (XAGUSD) continues to display a constructive technical outlook, suggesting that the metal is preparing to challenge new all time highs. The short term structure from the 28 October low has unfolded as a five wave impulse, reinforcing the bullish trajectory. Wave 1 of this sequence concluded at $54.39, as indicated on the one hour chart. Following this peak, the market experienced a corrective pullback in wave 2, which developed into a classic zigzag Elliott Wave formation. Within this correction, wave ((a)) terminated at $49.33, wave ((b)) rallied to $52.46, and wave ((c)) declined to $48.6, thereby completing wave 2 at a higher degree.
From that low, silver has resumed its upward momentum in wave 3. However, a decisive break above the prior wave 1 high at $54.39 remains necessary to eliminate the possibility of a double correction. Progressing from wave 2, wave (i) ended at $50.66, while the subsequent pullback in wave (ii) found support at $49.69. The current expectation is for the metal to extend higher in wave (iii), after which a modest retracement in wave (iv) should occur before another advance resumes. In the near term, as long as the pivot at $48.6 holds firm, dips are anticipated to attract buyers. Support is likely to emerge in the form of three, seven, or eleven swings, providing the foundation for continued upside potential. This structure underscores the resilience of silver’s bullish cycle and highlights the importance of maintaining key pivots to sustain momentum.

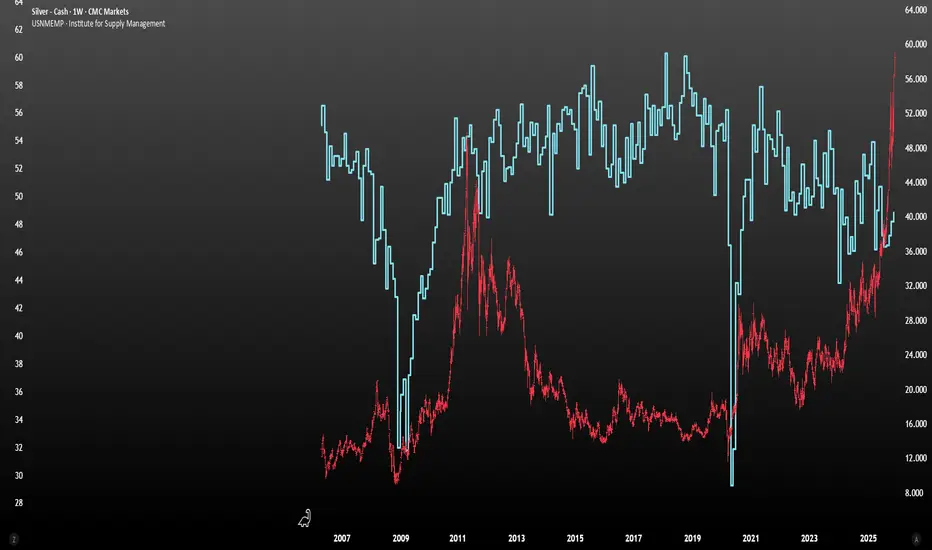
Will Silver's Attributes Change, Leading to a Surge?Silver surged last Friday, closing at $56.35, a 12.72% increase for the week, marking its strongest weekly performance since 2020. Silver prices have once again broken historical records, indicating growing market confidence in a continued slowdown in the US economy, making a December rate cut by the Federal Reserve almost a certainty.
From a candlestick chart perspective, the COMEX silver monthly chart formed a standard "pointing finger" pattern in October and November, with November's strong upward move significantly breaking historical highs. This pattern suggests continued upward momentum in December, a "refueling in mid-air" before resuming its upward trajectory, indicating ample short-term upward momentum.
In the past, silver's primary driver was industrial demand. Now, silver is more of a multi-functional asset, possessing attributes such as industrial demand, monetary value, precious metal properties, and strategic material attributes. Therefore, I believe silver will inevitably challenge the $60 mark, and the current $50 level will no longer be resistance but rather support.
Silver trading recommendations for next week: Primarily buy on dips, with selling on rallies as a secondary strategy. Buy at $55-$55.5, TP at $56.5, SL at $54.5. Sell at $56.8-$57, TP at $56, SL at $57.5.
I focus solely on short-term trading and clear market analysis. In short-term trading, there is no market that goes up or down forever, only the right entry point at any given moment. Find the rhythm and follow the trend. This is the essence of trading. If you are truly unsure when, where, and how to trade, let's work together to flexibly and steadily pursue greater profits in the ever-changing market!
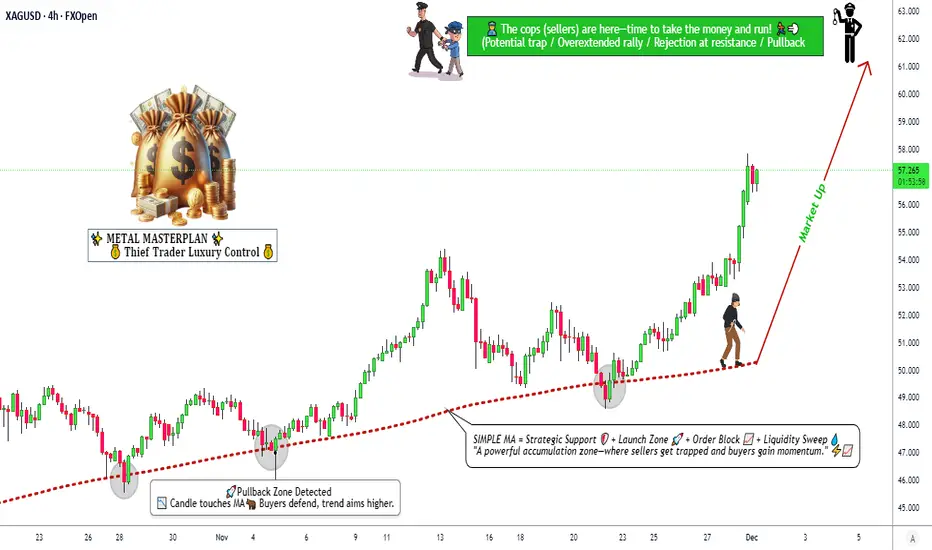
Strong Bullish Structure Developing in Silver🚀 XAG/USD (SILVER) Swing Blueprint | Bullish Structure Intact | Key Levels Mapped! ⚔️
🎯 Metals Market Opportunity: Silver (XAG/USD) Swing Trade Setup
📈 Direction: Bullish | Swing Trade
🏷 Asset: XAG/USD - Silver vs. U.S. Dollar
⚖️ Core Thesis: Silver is building a potential swing bullish structure, aiming for a significant resistance zone. This plan outlines the key framework.
📊 Trade Plan (Blueprint)
✅ Entry Zone: Consider entries on pullbacks or strength confirmation. (Any price level entry - discipline is key).
🛑 Stop Loss (Risk Management):
"This is thief SL @ 54" 💎
Dear Traders (The OG Crew), 👊
This is my protective level. YOU MUST adjust your SL based on YOUR OWN risk tolerance & strategy. I do not recommend using only my level. Manage your capital wisely.
🎯 Target Zone: @ 62 Area.
This aligns with a strong historical resistance + potential overbought/trap zone. 🪤 The strategy is to "escape with profits" as price approaches.
Note: This is my target. Take profits based on your own analysis and risk-reward goals.
🔍 Related Pairs & Market Correlations (Must-Watch) 🔗
Monitoring these pairs provides context for Silver's move:
🦅 TVC:DXY (U.S. Dollar Index):
Key Point: INVERSE correlation. A weaker TVC:DXY typically boosts commodities priced in USD, like Silver. Watch for DXY breakdowns for added Silver bullish confirmation.
🟡 XAU/USD (Gold):
Key Point: STRONG positive correlation. Gold is the leader. A strong, bullish Gold market often drags Silver higher (and vice-versa). Silver's moves can be more volatile ("Gold on steroids").
📈 US 10-Year Treasury Yields / TVC:TNX :
Key Point: General inverse relationship. Rising real yields can pressure non-yielding metals. Watch for yield pullbacks that may relieve pressure on Silver.
⛽️ Crude Oil ( BLACKBULL:WTI / ICMARKETS:XBRUSD ):
Key Point: Inflation/Commodity Sentiment Gauge. Rising oil can signal broader commodity strength and inflation fears, which can benefit Silver as a real asset.
📊 Copper ( CAPITALCOM:COPPER ) & AMEX:GDX (Gold Miners ETF):
Key Point: Industrial / Risk Sentiment. Copper confirms industrial demand outlook. AMEX:GDX strength confirms bullish precious metals sector momentum.
💎 Final Notes
This is a blueprint, not financial advice.
You are the captain of your own capital. 🧭
Always use proper position sizing.
Markets are dynamic—always monitor for structure breaks.
Let's get this bread... responsibly! 🥖
✅ Like & Follow if you find this detailed blueprint valuable! It helps the idea reach more traders. 💡
#SILVER #XAGUSD #TradingSetup #SwingTrading #Commodities #PreciousMetals #Forex #TradingView #DXY #GOLD #XAUUSD #Analysis

Don’t Ignore This Signal on SilverSilver is starting to show a clear bearish signal, and the biggest reason is the RSI divergence building on the chart. While the price kept making higher highs, the RSI failed to follow, showing lower highs and weakening momentum. This tells us that buyers are losing strength even though the price looked strong on the surface. When momentum drops before price does, it often leads to a corrective move, and silver is now sitting in that exact setup. If this divergence plays out, we could see a meaningful pullback in the coming sessions, so traders should stay cautious and watch how price reacts around key support levels.

Silver bullish breakout, previous resistance - new supportThe Silver remains in a bullish trend, with recent price action showing signs of a corrective pullback within the broader uptrend.
Support Zone: 5420 – a key level from previous consolidation. Price is currently testing or approaching this level.
A bullish rebound from 5420 would confirm ongoing upside momentum, with potential targets at:
5875 – initial resistance
6000 – psychological and structural level
6106 – extended resistance on the longer-term chart
Bearish Scenario:
A confirmed break and daily close below 5420 would weaken the bullish outlook and suggest deeper downside risk toward:
5350 – minor support
5275 – stronger support and potential demand zone
Outlook:
Bullish bias remains intact while the Silver holds above 5420. A sustained break below this level could shift momentum to the downside in the short term.
This communication is for informational purposes only and should not be viewed as any form of recommendation as to a particular course of action or as investment advice. It is not intended as an offer or solicitation for the purchase or sale of any financial instrument or as an official confirmation of any transaction. Opinions, estimates and assumptions expressed herein are made as of the date of this communication and are subject to change without notice. This communication has been prepared based upon information, including market prices, data and other information, believed to be reliable; however, Trade Nation does not warrant its completeness or accuracy. All market prices and market data contained in or attached to this communication are indicative and subject to change without notice.

SILVER (XAGUSD) – 4H Technical AnalysisBias: Bullish after expected retest | Target: 63.25 (Triangle Projection)
Status: WAIT FOR RETEST → BUY ON CONFIRMATION. Trade Plan (Swing)
ENTRY
Wait for retest of:
$54.00 – $54.50 zone
Or deeper wedge support at $52.80–53.20
Confirmation required:
Reversal candle (4H)
Volume spike
No lower-low below $52.50
STOP LOSS
Conservative SL: $51.90
Structural SL: $50.80 (below wedge support)
TARGETS
T1: $58.50
T2: $60.80
T3: $63.25 (Triangle Projection)
Overall Verdict
SILVER is in a strong uptrend and forming a textbook bullish continuation pattern.
The current breakout is false, and the chart strongly suggests:
A pullback to $54 zone
Bounce from support
Final breakout towards 63.25
This aligns perfectly with your annotations.
Bias: Strong Bullish after Retest
Current Action: WAIT for pullback (no buying at the top)
Disclaimer
This analysis is for educational purposes only and not investment advice. Trading involves risk; please conduct your own due diligence before taking positions.

Silver – Can the Break to Record Highs Be Maintained?Silver’s impressive upside run so far this week, which has seen it trade from a low of 56.165 on Monday to register a new record high at 58.96 yesterday, seems to be taking a pause in early trading on Thursday morning, with the price currently trading down around 1.8% at 57.44 at time of writing (0700 GMT).
With liquidity in the Silver market nowhere near as deep as in its bigger parent Gold, these types of exaggerated moves can happen more frequently, especially when trading at new extremes such as the record high that was reached a mere 24 hours ago. Where Silver moves next into the weekend may be determined by a combination of factors, such as positioning, performance of the US dollar and technical factors.
From a positioning standpoint, the debasement trade which has been underpinning much of Silver’s rally over the last 3-6 months still remains in place but can at times be subject to pullbacks as the trade can get crowded and this may be part of the reason for the drop this morning. There could be potential for further profit taking into Friday’s close, especially with the pivotal Federal Reserve interest rate decision now less 7 days away (December 10th).
From the US dollar point of view, as mentioned above, with the Fed rate decision now around the corner, traders may be more sensitive to the release of any available US labour market data. Today’s scheduled release of the Challenger Job Cuts at 1230 GMT and Weekly Jobless Claims at 1330 GMT could lead to further US dollar volatility, which may impact Silver prices. As a general rule a higher dollar makes Silver more expensive for foreign investors and vice versa.
Finally, interlinked with these two drivers are the technicals. Whether key support or resistance levels hold or a broken on a closing basis could lead to bigger directional moves into the weekend or early next week. So being apprised of these levels in advance can be prudent from a risk management approach.
Technical Update: Can New All-Time Highs Maintain The Push Higher?
Silver has enjoyed a positive late‑November to early‑December period, advancing more than 21% from the November 21st low of 48.62 to Wednesday’s 58.96 high. This move has produced new all‑time highs, with fresh upside acceleration following the closing break above the previous 54.45 October 17th record high.
While it might be argued that this type of price activity remains constructive with the potential for further gains, some traders may view the latest upside moves as becoming over‑extended, raising the risk of future price weakness.
In this environment, staying aware of relevant support and resistance levels may prove valuable in gauging Silver’s next directional themes.
Possible Resistance Levels: .
New all‑time highs place price activity into uncharted territory, making it difficult to establish valid resistance levels. In such cases, Fibonacci extensions can provide valuable guidance, highlighting potential areas where fresh selling pressure may emerge once more.
For Silver, Fibonacci extension calculations based on the last significant correction seen between October 17th and October 28th suggest that current price strength may be approaching a potential resistance at 59.79, which is the 61.8% extension level.
A closing break above 59.79 might now be required to open scope for a push to higher levels like the 100% extension level which sits at 63.15.
Possible Support Levels:
It is often difficult to determine with certainty when upside conditions have become over‑extended and of course this alone doesn’t guarantee price weakness. As such, closing breaks below support may be required to trigger a corrective phase in price. In the case of Silver, traders may view Monday’s session low of 56.16 as the first support.
Closing breaks below the 56.16 level, if seen, could reinforce the possibility of over‑extended upside conditions leading to continued price weakness. Such moves could open the way for tests of 54.95, which is the 38.2% Fibonacci retracement, and possibly even extend toward 53.75, the deeper 50% retracement level.
The material provided here has not been prepared accordance with legal requirements designed to promote the independence of investment research and as such is considered to be a marketing communication. Whilst it is not subject to any prohibition on dealing ahead of the dissemination of investment research, we will not seek to take any advantage before providing it to our clients.
Pepperstone doesn’t represent that the material provided here is accurate, current or complete, and therefore shouldn’t be relied upon as such. The information, whether from a third party or not, isn’t to be considered as a recommendation; or an offer to buy or sell; or the solicitation of an offer to buy or sell any security, financial product or instrument; or to participate in any particular trading strategy. It does not take into account readers’ financial situation or investment objectives. We advise any readers of this content to seek their own advice. Without the approval of Pepperstone, reproduction or redistribution of this information isn’t permitted.

SilverXAGUSD
- Bullish Channel as an corrective pattern in Long Time Frame
- Change of Characteristics
- Break of Structure
- Completed " 12345 " Impulsive Waves
- Demand Zone

Silver’s Next Move in an Overextended PositionAfter breaking out of what appeared to be a cup-and-handle pattern on 25 November, silver prices have surged from around $51.40 to $58.65. The metal now looks overextended, with the RSI at 75.25, and trading above its upper Bollinger Band for the fourth consecutive day. This suggests that silver may be due for a retest of the 20-day moving average or for a few days of sideways consolidation before the next move is established.
On the hourly chart, silver prices have formed what appears to be a trading range since 30 November, broadly between $56.60 and $58.90, with $58.90 acting as resistance and $56.60 as support. A break below $56.60 could set up a move back towards $53.90, which would then become an important level of support. If that were to be broken, silver could potentially fall further towards $50.75. Such a development might also indicate that a larger reversal is starting to take shape, although it is far too early to make that assumption.
Conversely, a breakout above $58.90 would be a very bullish signal and would suggest that silver’s move higher could extend for some time. While a precise price objective is difficult to determine, using a 100% extension of the breakout to the recent high at $58.90 would imply that silver could rise to around $67.10.
Written by Michael J. Kramer, founder of Mott Capital Management.
Disclaimer: CMC Markets is an execution-only service provider. The material (whether or not it states any opinions) is for general information purposes only and does not take into account your personal circumstances or objectives. Nothing in this material is (or should be considered to be) financial, investment or other advice on which reliance should be placed.
No opinion given in the material constitutes a recommendation by CMC Markets or the author that any particular investment, security, transaction, or investment strategy is suitable for any specific person. The material has not been prepared in accordance with legal requirements designed to promote the independence of investment research. Although we are not specifically prevented from dealing before providing this material, we do not seek to take advantage of the material prior to its dissemination.
SILVER Massive Short! SELL!
My dear friends,
Please, find my technical outlook for SILVER below:
The price is coiling around a solid key level - 56.402
Bias - Bearish
Technical Indicators: Pivot Points High anticipates a potential price reversal.
Super trend shows a clear sell, giving a perfect indicators' convergence.
Goal - 54.067
About Used Indicators:
The pivot point itself is simply the average of the high, low and closing prices from the previous trading day.
Disclosure: I am part of Trade Nation's Influencer program and receive a monthly fee for using their TradingView charts in my analysis.
———————————
WISH YOU ALL LUCK

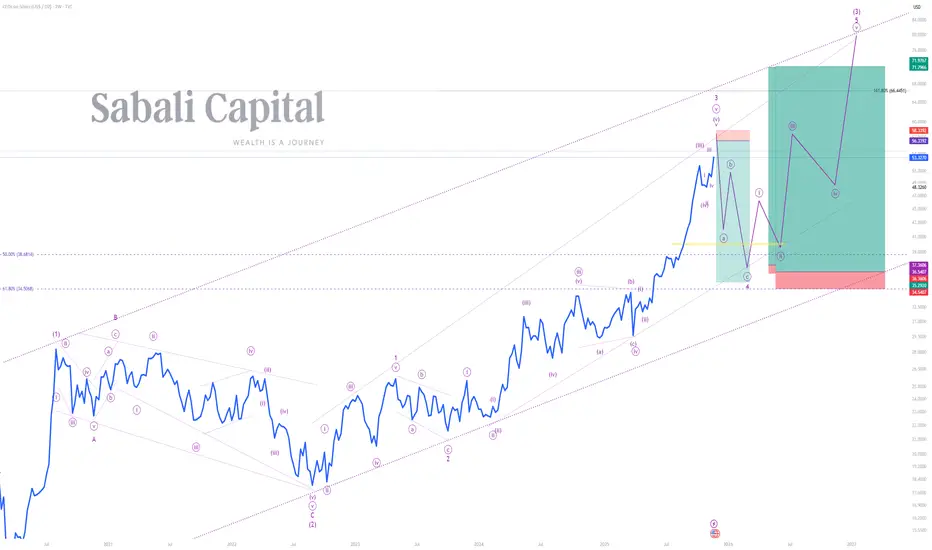
FROM RALLY TO REALITY, SILVER'S CORRECTION IS STRUCTURALPeace be unto you
Primary Chart: Silver Analysis (Weekly Timeframe)
A) Wave Analysis: Minor wave 3 peaks, sharp correction looms
Price is currently completing minor wave 3 that began printing on the 4th of October 2023. Minor wave 1 started printing on the 1st of September 2022 and terminated on the 5th of May 2023. Minor wave 2 sideways correction began when minor wave 1 terminated and terminated when minor wave 3 started printing. Minor wave 4 is expected to be a sharp correction in line with the law of Elliot Waves Guideline on Corrections (Wave 2 and 4) which states that "if wave 2 is a sharp correction, expect wave 4 to be a sideways correction, and vice versa". Thus, minor wave is forecasted to be sharp and retrace to 50% and 61.8% retracement levels of minor wave 3, i.e. minor wave is forecasted to terminated within the 38.6814 and 34.5068 levels before price begins printing minor wave 5 to complete intermediate wave (3) as indicated on the primary chart.
B) Indicator(s) Analysis: Bearish Divergence confirmed and bulls losing altitude. The EMA magnet activated, pullback before the next push. The MACD flips the script, and a seasonal shift is detected.
1) EMA 50 & 150 (Weekly) - Though strongly bullish, price will pull back to touch these moving averages before it continues to rally.
2) RSI 14 (Weekly) - The RSI has rallied above the 70 upper band in August 2025 and reached a peak in October 2025. On the 3rd of November 2025 the RSI reached a trough, and it is now printing a lower high whilst price is printing a higher high. This is known as a Strong Bearish Divergence signaling that bulls are growing weak and that price will collapse on its weight.
3) MACD H (Weekly) - Price has been printing above the MACD centerline indicating that bulls have been strong, but on the 20th of October 2025 we have seen a down close on MACD Histograms indicating a possible trend reversal and a change of season. This is the time to go short.
#SabaliCapital
#TechnicalAnalysis
#PreciousMetals
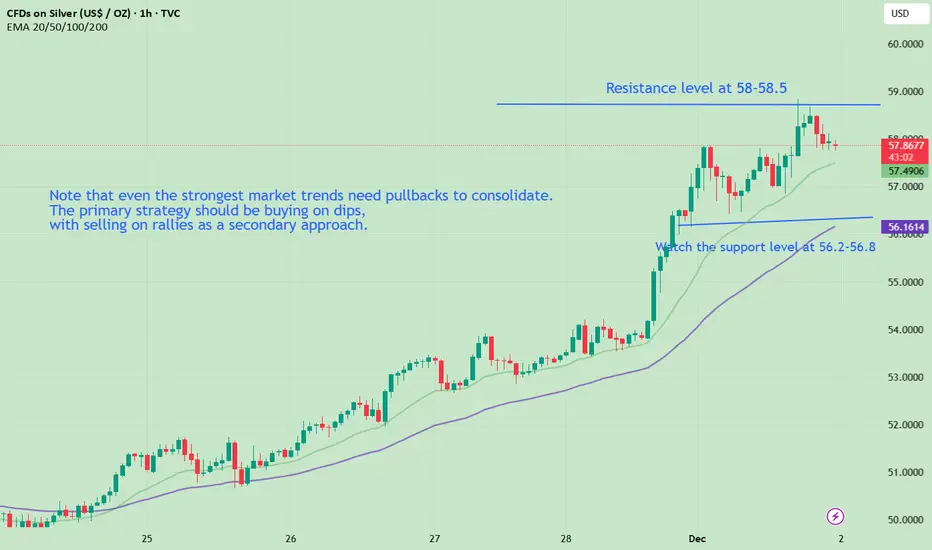
How Much Upside Potential Does Silver Have? Strategy Update
The rise in silver prices is a clear signal to the market that its intrinsic value is being reassessed. This bull market in silver is not simply driven by sentiment, but by the dual demands of national-level geostrategic allocation and the global competition in the new energy industry.
Silver has been the star performer this year, breaking a 46-year high and rising 98% year-to-date. This was expected given our consistent bullish trend. However, the rapid and unilateral surge has made the gains seem alarming. A clear-headed assessment of the overall trend is still necessary. The overall trend remains bullish, and pullbacks are inevitable. Buying on dips is the strategy, while selling on rallies is the tactic. Again, avoid chasing the price higher.
The operational strategy remains primarily buying on dips: watch for support at 56.2-56.8. It's important to note that even the strongest markets need pullbacks to consolidate: resistance is at 58-58.5. I focus solely on short-term trading and clear market analysis. In short-term trading, there is no market that rises or falls forever, only the right entry point at any given moment. Find your rhythm and follow the trend. That's the essence of trading. Currently, you must seize every opportunity to buy on pullbacks. If you're struggling to execute trades precisely, try my method: first test the market with a small position, then add to your position on pullbacks. This way, you won't miss any opportunities.
If you need to recover significant losses or obtain precise trading signals, find the channel entry and contact me to trade strictly according to my signals. This will make it easier for you to recover losses or double your profits!
While Gold Stalls, Silver Eyes The 60-Record Silver has broken above a 45-year resistance, turning the 54-barrier into a potential support level moving forward. If silver continues to hold above this multi-decade structure, a new era for the metal could unfold in alignment with triple-digit long-term forecasts supported by the expansion of technology and green-energy industries — including solar panels, electric batteries, and industrial tech use cases.
From a weekly perspective, silver’s price action is aligned with the upper bound of a duplicated up-trending channel respected between August 2022 and September 2025. The 60 zone remains a key psychological resistance level — and a potential retracement trigger. Beyond that, Fibonacci extension measurements from the July 2025 low and the October 2025 high-and-low sequence outline the next upside zones near 64 and 69.
On the downside, if a reversal emerges below the daily low of 56.20 and the previous 2025 record at 54.30, retracement risks may extend toward the mid-zone of the new channel between 51.80 and 50.80. A confirmed hold below this area could pave the way for deeper declines toward 45 and 43.90 — aligning with a historical resistance zone connecting consecutive higher highs between January 2023 and October 2024, before silver possibly resumes its bullish course.
Written by Razan Hilal, CMT
