Trade ideas

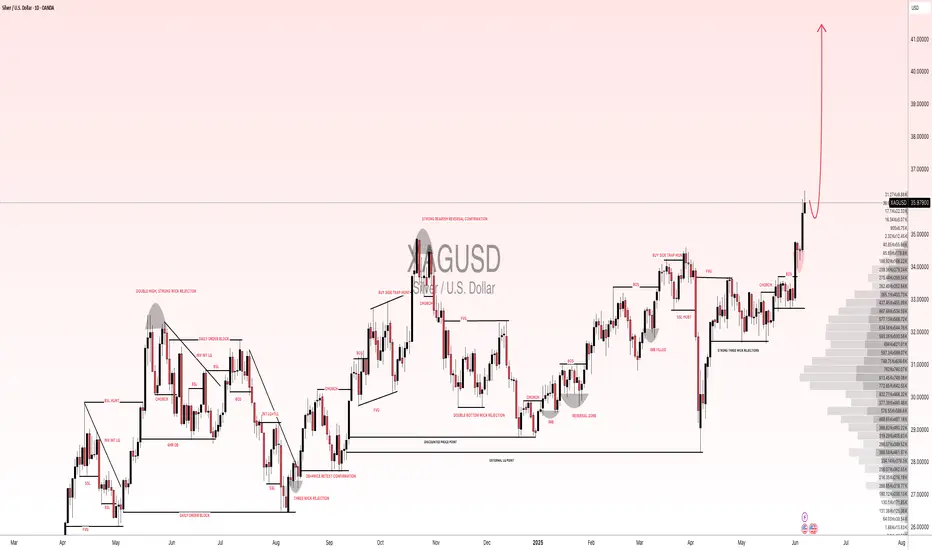
XAGUSD(SILVER):To $60 the silver is new gold, most undervaluedSilver has shown remarkable bullish behaviour and momentum, in contrast to gold’s recent decline. Despite recent news, silver remains bullish and unaffected by these developments. We anticipate that silver will reach a record high by the end of the year, potentially reaching $60.
There are compelling reasons why we believe silver will be more valuable in the coming years, if not months. Firstly, the current price of silver at 36.04 makes it the most cost-effective investment option compared to gold. This presents an attractive opportunity for retail traders, as gold may not be suitable for everyone due to its nature and price.
Silver’s price has increased from 28.47 to 36.25, indicating its potential to reach $60 in the near future. We strongly recommend conducting your own analysis before making any trading or investment decisions. Please note that this analysis is solely our opinion and does not guarantee the price or future prospects of silver.
We appreciate your positive feedback and comments, which encourage us to provide further analysis. Your continuous support over the years means a lot to us.
We wish you a pleasant weekend.
Best regards,
Team Setupsfx
Silver - local topI think we have a top here in Silver.
Three days of higher highs and a deviation on the third day with market structure break.
Could be a local top or a long term top. Only time will tell, but it's a sell right now.
Price is currently testing all the previous daily highs.

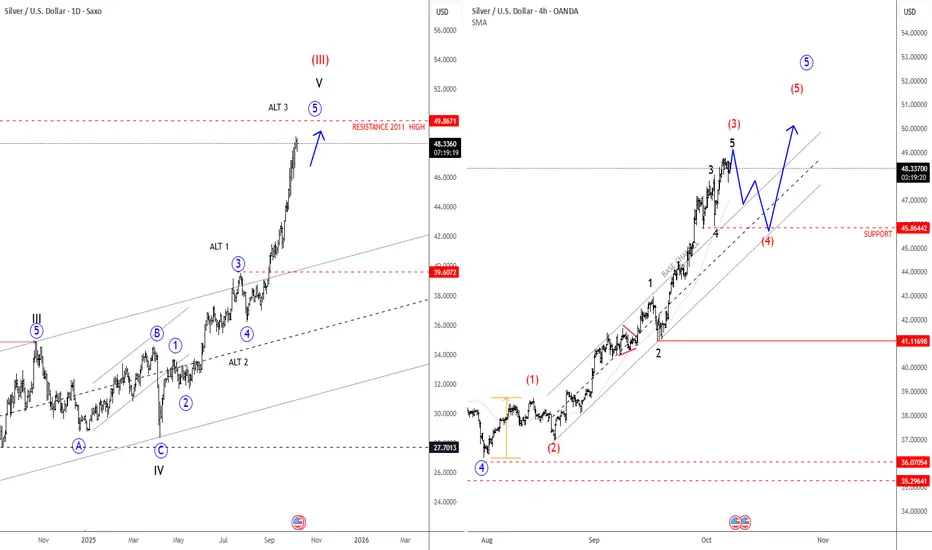
Silver Is Extending Impulsively Higher; All-Time Highs SoonSilver Is Extending Impulsively Higher, which can push the price into all-time highs from a technical point of view and by Elliott wave model.
Silver is on the rise and has been outperforming gold quite a lot over the last week, and it looks like an extended leg up is still in progress; seems like wave three of an extended impulse, therefore more gains are possible after next three-leg retracement. Based on the 4-hour chart, there is a chance that price goes towards 50usd, but there can be some new pullback first. Ideally red wave (4) could stabilize near 45.86. Only a sharp impulse down closer to 43 level will be an indication that higher degree wave four has started.
Higher Time frame charts show an ongoing bull cycle that is now targeting the high from April 2011, which could be the next major level and a potential area for a new retracement, maybe sometime in 2026.
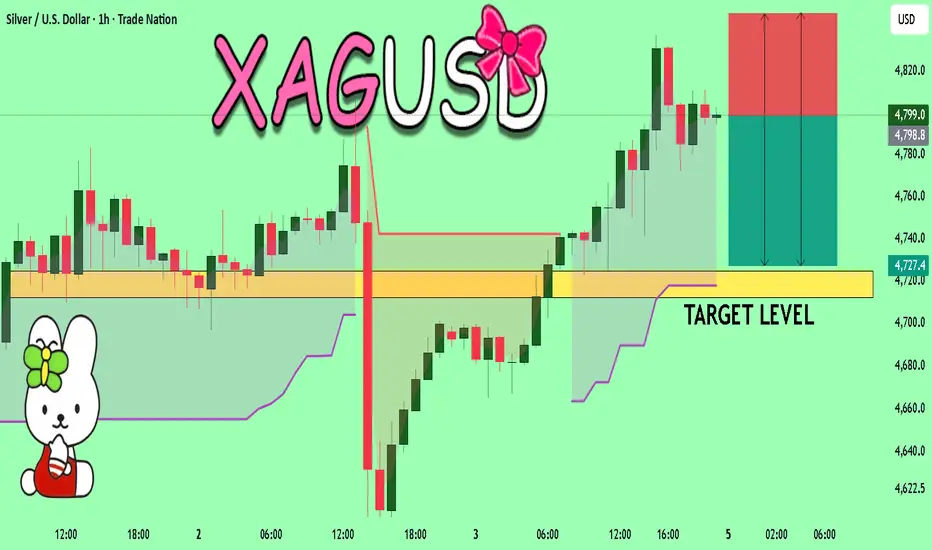
SILVER BEST PLACE TO SELL FROM|SHORT
SILVER SIGNAL
Trade Direction: short
Entry Level: 4,834.9
Target Level: 4,657.5
Stop Loss: 4,952.1
RISK PROFILE
Risk level: medium
Suggested risk: 1%
Timeframe: 9h
Disclosure: I am part of Trade Nation's Influencer program and receive a monthly fee for using their TradingView charts in my analysis.
✅LIKE AND COMMENT MY IDEAS✅

XAGUSD-INVESTMENT IDEAXAGUSD is about to break its resistance on montly timeframe and also making a cup and handle pattern if some one want to take trade calculate your risk and invest.

SILVER Bullish Continuation! Buy!
Hello,Traders!
SILVER holds above the horizontal demand level, showing bullish intent as Smart Money defends premium reaccumulation zones. Expect a move toward 4,885$ to rebalance inefficiency and collect buy-side liquidity. Time Frame 1H.
Buy!
Comment and subscribe to help us grow!
Check out other forecasts below too!
Disclosure: I am part of Trade Nation's Influencer program and receive a monthly fee for using their TradingView charts in my analysis.

SILVER (XAG/USD): One More Bullish Wave is Coming?!⚠️ SILVER appears to be confined within a horizontal range, as observed on the 4-hour chart. The price is currently nearing the upper limit of this range.
Given the prevailing strong bullish trend, there is a considerable likelihood of a continued upward movement.
A breakout and a 4-hour candle closing above the indicated resistance level would serve as a dependable confirmation.
The subsequent objective for buyers is anticipated to be 49.00.
Conversely, the market might persist in its consolidation phase, trading within the established range.

Silver heading to 5000?The Silver remains in a bullish trend, with recent price action showing signs of a continuation breakout within the broader uptrend.
Support Zone: 4766 – a key level from previous consolidation. Price is currently testing or approaching this level.
A bullish rebound from 4766 would confirm ongoing upside momentum, with potential targets at:
4897 – initial resistance
4850 – psychological and structural level
5000 – extended resistance on the longer-term chart
Bearish Scenario:
A confirmed break and daily close below 4766 would weaken the bullish outlook and suggest deeper downside risk toward:
4716 – minor support
4665 – stronger support and potential demand zone
Outlook:
Bullish bias remains intact while the silver holds above 4766. A sustained break below this level could shift momentum to the downside in the short term.
This communication is for informational purposes only and should not be viewed as any form of recommendation as to a particular course of action or as investment advice. It is not intended as an offer or solicitation for the purchase or sale of any financial instrument or as an official confirmation of any transaction. Opinions, estimates and assumptions expressed herein are made as of the date of this communication and are subject to change without notice. This communication has been prepared based upon information, including market prices, data and other information, believed to be reliable; however, Trade Nation does not warrant its completeness or accuracy. All market prices and market data contained in or attached to this communication are indicative and subject to change without notice.

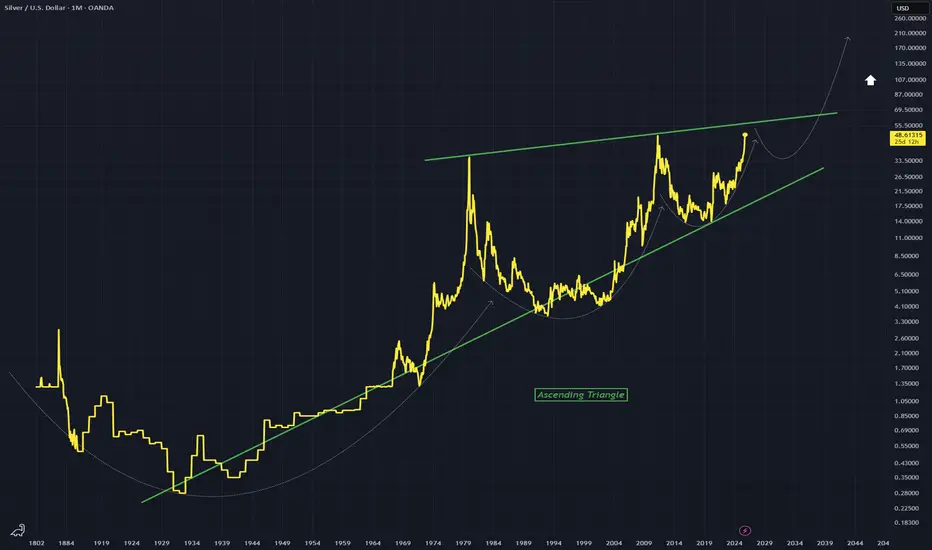
SILVER C&H FOR A 6X IN NEXT 10 YEARS?Silver has been building a Cup & Handle for 45 years.
Break $50 — and it’s headed to $300.
This time, Silver won’t just follow Gold…
It’ll outrun it.

SILVER - Recurring Cup PatternInteresting chart showing repeating cups, each one progressively becoming tighter and tighter within this large ascending triangle on this Monthly chart.
Will another cup form and break out of this triangle? It is possible and would be a massive Breakout.
Again, Monthly chart.
XAGUSD GOOD SELL OPTIONWe have seen metals roaring upwards. However after recent Diplomatic and Geopolitical situations we can see slight pull back

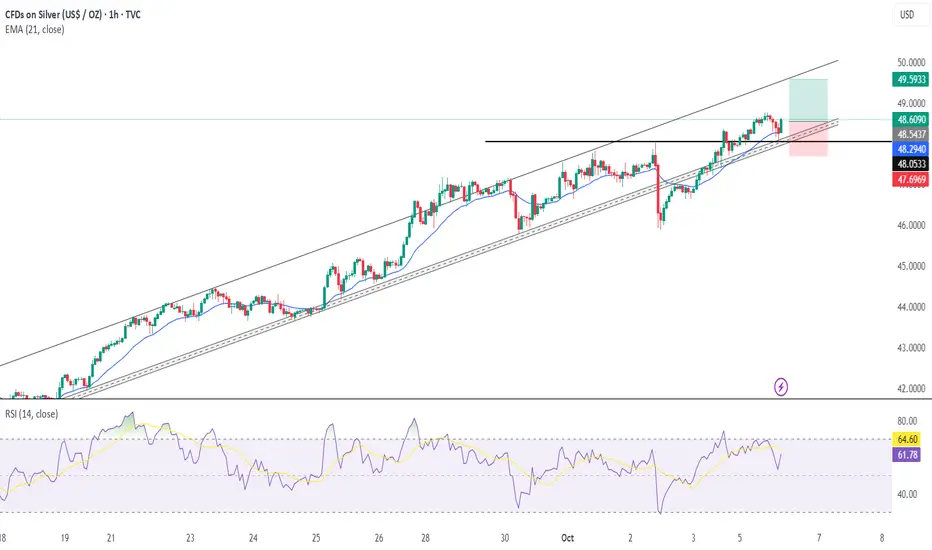
XAGUSD H1 | Potential Bullish Continuation AheadXAG/USD is falling towards the buy entry which is a pullback support that aligns withthe 38.2% Fibonacci retracement and could bounce from this level to the upside.
Buy entry is at 47.61, which is a pullback support that aligns with the 38.2% Fibonacci retracement.
Stop loss is at 46.74, which is a pullback support that is slightly above the 78.6% Fibonacci retracement.
Take profit is at 49.46, which is aligns with the 161.8% Fibonacci extension.
High Risk Investment Warning
Trading Forex/CFDs on margin carries a high level of risk and may not be suitable for all investors. Leverage can work against you.
Stratos Markets Limited (tradu.com/uk ):
CFDs are complex instruments and come with a high risk of losing money rapidly due to leverage. 65% of retail investor accounts lose money when trading CFDs with this provider. You should consider whether you understand how CFDs work and whether you can afford to take the high risk of losing your money.
Stratos Europe Ltd (tradu.com/eu ):
CFDs are complex instruments and come with a high risk of losing money rapidly due to leverage. 66% of retail investor accounts lose money when trading CFDs with this provider. You should consider whether you understand how CFDs work and whether you can afford to take the high risk of losing your money.
Stratos Global LLC (tradu.com/en ):
Losses can exceed deposits.
Please be advised that the information presented on TradingView is provided to Tradu (‘Company’, ‘we’) by a third-party provider (‘TFA Global Pte Ltd’). Please be reminded that you are solely responsible for the trading decisions on your account. There is a very high degree of risk involved in trading. Any information and/or content is intended entirely for research, educational and informational purposes only and does not constitute investment or consultation advice or investment strategy. The information is not tailored to the investment needs of any specific person and therefore does not involve a consideration of any of the investment objectives, financial situation or needs of any viewer that may receive it. Kindly also note that past performance is not a reliable indicator of future results. Actual results may differ materially from those anticipated in forward-looking or past performance statements. We assume no liability as to the accuracy or completeness of any of the information and/or content provided herein and the Company cannot be held responsible for any omission, mistake nor for any loss or damage including without limitation to any loss of profit which may arise from reliance on any information supplied by TFA Global Pte Ltd.
The speaker(s) is neither an employee, agent nor representative of Tradu and is therefore acting independently. The opinions given are their own, constitute general market commentary, and do not constitute the opinion or advice of Tradu or any form of personal or investment advice. Tradu neither endorses nor guarantees offerings of third-party speakers, nor is Tradu responsible for the content, veracity or opinions of third-party speakers, presenters or participants.

Silver Route to $50Break this triangle to the upside and see Silver squeeze!
Break to the downside = doom...

$100 Silver 2029-2031 - Long Term InvestmentMacro Cup & Handle + 21 Fib Time Zone + Fractal
The scenario means we go down a little bit more. We then consolidate for a couple of years before we have a parabolic year or two.

$50 Silver"Decade of zero returns" for the stock market = Shortening Bear Market for Commodities
Price target = $50
Fractal backbone + Room in technicals for such move.
Price target was established in June 2021.
Time frame pushed up in anticipation of 2023 bear.

XAGUSD SILVERSILVER IS LOOKING AT 50$ AND one more swing could see the shinny metal up to the moon.
demand floor @ 47.726-47.150$ high risk zone
demand floor @46.550 low risk zone
note all the buy zone can be broken ..manage your risk.
target will be based on risk appetite
trading gold and silver comes with risk, management is key.
#silver #xagusd #dxy #us10y

Silver :Fantastic Momentum, rally continues after a Buy SignalSilver : Fantastic Momentum and rally continues after a Buy Signal .
( Not a Buy / Sell Recommendation
Do your own due diligence ,Market is subject to risks, This is my own view and for learning only .)

SILVER The Target Is DOWN! SELL!
My dear friends,
My technical analysis for SILVER is below:
The market is trading on 47.990 pivot level.
Bias - Bearish
Technical Indicators: Both Super Trend & Pivot HL indicate a highly probable Bearish continuation.
Target -47.247
Recommended Stop Loss -4848.0
About Used Indicators:
A pivot point is a technical analysis indicator, or calculations, used to determine the overall trend of the market over different time frames.
Disclosure: I am part of Trade Nation's Influencer program and receive a monthly fee for using their TradingView charts in my analysis.
———————————
WISH YOU ALL LUCK
XAGUSD 1H🔹 Overall Outlook and Potential Price Movements
In the charts above, we have outlined the overall outlook and possible price movement paths.
As shown, each analysis highlights a key support or resistance zone near the current market price. The market’s reaction to these zones — whether a breakout or rejection — will likely determine the next direction of the price toward the specified levels.
⚠️ Important Note:
The purpose of these trading perspectives is to identify key upcoming price levels and assess potential market reactions. The provided analyses are not trading signals in any way.
✅ Recommendation for Use:
To make effective use of these analyses, it is advised to manually draw the marked zones on your chart. Then, on the 15-minute time frame, monitor the candlestick behavior and look for valid entry triggers before making any trading decisions.

XAG/USD Monthly AnalysisThe last few months have seen this precious metal go from strength to strength.
Is the bull run about to come to an end though?
With price approaching the 2011 supply zone, time could be running out for the buyers and the probability of selling pressure increases.
Are you a buyer or a seller? Whatever you are, look for a trade that meets your strategy rules.

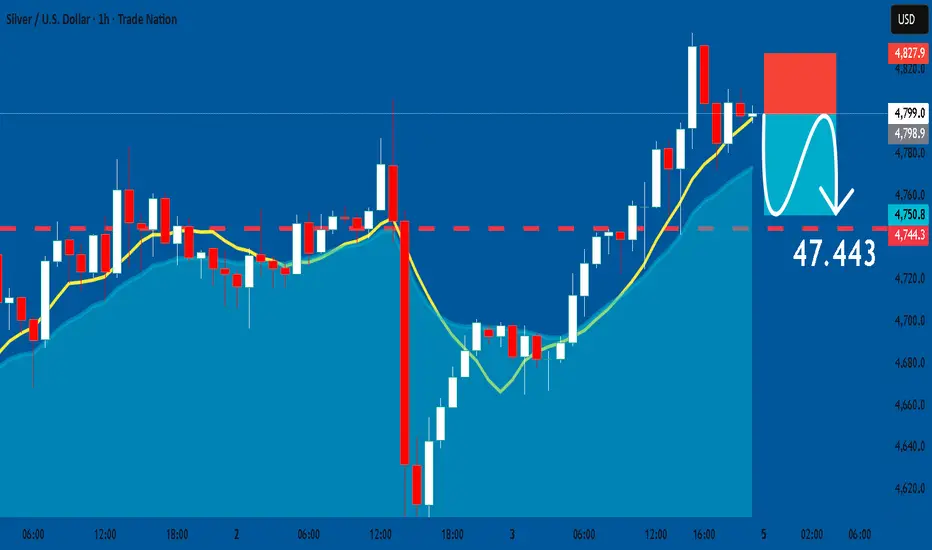
SILVER: Short Trade Explained
SILVER
- Classic bearish formation
- Our team expects fall
SUGGESTED TRADE:
Swing Trade
Sell SILVER
Entry Level - 47.990
Sl - 49.279
Tp - 47.443
Our Risk - 1%
Start protection of your profits from lower levels
Disclosure: I am part of Trade Nation's Influencer program and receive a monthly fee for using their TradingView charts in my analysis.
❤️ Please, support our work with like & comment! ❤️