Silver Powerful BreakoutOANDA:XAGUSD : Cup with Handle pattern and now powerful breakout, As long as hold above $54.70, every chance that it will touch $59.90 & $62.70 in upcoming days, Stop Loss $52.70.
Trade ideas

Silver Wave Analysis – 28 November 2025
- Silver broke key resistance level 54.00
- Likely to rise to resistance level 58.00
Silver recently broke the resistance zone between the key resistance level 54.00 (which stopped the previous sharp impulse wave (5) in October) and the resistance trendline of the ascending triangle from October.
The breakout of this resistance zone accelerated the active intermediate impulse wave (3).
Given the clear daily uptrend, Silver can be expected to rise to the next resistance level 58.00, target price for the completion of the active impulse wave (3).

ALERT! Silver has broken out, surging Silver has broken out of the rising triangle. This is very bullish. Near term price target is $60. Expect a retest.
A cup in A cup - Bullish on Silver
I have trouble seeing silver tanking from here chart wise.
The monthly chart is showing two cup, maybe we get a handle but I wouldn't count on it much at this point.
On the 15-30 minutes, beautiful cup and the formation of the handle.
If you trust gold to make ATH in the near term, and you are generally bullish on commodity, Silver will be part of your portfolio right now.
If you want to be careful, Silver would be interesting after a confirmed closed candle breakout of 54.50$
The real downside potential here is a melt up of Stocks with commodity with cryptos. We are in high price territory. A correction is possible.

Silver trend continuation breakout supported at 5213 The Silver remains in a bullish trend, with recent price action showing signs of a corrective pullback within the broader uptrend.
Support Zone: 5213 – a key level from previous consolidation. Price is currently testing or approaching this level.
A bullish rebound from 5213 would confirm ongoing upside momentum, with potential targets at:
5437 – initial resistance
5514 – psychological and structural level
5600 – extended resistance on the longer-term chart
Bearish Scenario:
A confirmed break and daily close below 5213 would weaken the bullish outlook and suggest deeper downside risk toward:
5155 – minor support
5100 – stronger support and potential demand zone
Outlook:
Bullish bias remains intact while the Silver holds above 5213. A sustained break below this level could shift momentum to the downside in the short term.
This communication is for informational purposes only and should not be viewed as any form of recommendation as to a particular course of action or as investment advice. It is not intended as an offer or solicitation for the purchase or sale of any financial instrument or as an official confirmation of any transaction. Opinions, estimates and assumptions expressed herein are made as of the date of this communication and are subject to change without notice. This communication has been prepared based upon information, including market prices, data and other information, believed to be reliable; however, Trade Nation does not warrant its completeness or accuracy. All market prices and market data contained in or attached to this communication are indicative and subject to change without notice.

Could Tight Supply Trigger Silver’s Next Big Rally?Silver prices are facing clear fundamental pressure amid growing signs of a tightening global supply. Inventories in China, one of the biggest players in the silver market, have fallen to their lowest level since 2015, with large amounts being shipped to Western markets in an attempt to ease the surge in demand. This comes at a time when the industrial sector especially solar energy and advanced technologies is experiencing accelerating growth, pushing silver consumption to unprecedented levels.
Meanwhile, reports from the Silver Institute show that the market has been in a structural deficit for several years, with global demand exceeding both mine production and recycling supply. This imbalance between supply and demand, along with declining Chinese reserves, has raised serious concerns about the possibility of an imminent global shortage.
With industrial demand continuing to rise and available supply shrinking, silver appears to be entering a critical phase where supply dynamics may play a decisive role in determining price direction in the coming weeks and months.
From a technical perspective, looking at the 4-hour chart, silver prices remain below the $54.48 level after testing it in October.
The bullish scenario for silver depends on holding above $52.68 and breaking above $54.48, which would open the door to further upside and potentially usher in a new bullish phase targeting $75 and $100 in the long term.
The bearish scenario for silver involves a decline below 52.48 with a lower low formed, meaning a 4-hour candle closing below that level which would suggest a corrective pullback toward the $50 area again in the short to medium term.

SILVER Long IdeaWe have a unconfirmed ascending triangle formation at silver. After the daily close on the red lines , formation will be confirmed and we can target easly to the blue area as shown

Silver AnalysisSilver has completed well-defined Cup & Handle pattern on the 4H chart — a classic bullish continuation structure.
Prices are hovering close to the neckline around $53.95–54.00, confirming momentum on the upside.
Key Observations
- Any sustainable breakout of the Cup & Handle pattern signals a continuation of the bullish trend.
- Prices are riding the upper Bollinger Band — strong momentum.
- RSI remains in the bullish zone, supporting further upside.
- Breakout retest zone lies around $53.30–53.90; holding above this region keeps the bias upward.
Upside Target
Measured move projection points to ~$57.30, aligning with broader resistance levels.
Downside Risk
If prices fail to give a bullish breakout, but fall below the zone between pivot point (53.32) & S1 (52.70), then it would weaken the bullish setup and delay the move.

Gold & Silver Forecast: Topping Pattern + Gann Dates AlignWe continue to lean towards the view that both markets are forming — or have already formed — a top, with a strong reversal to the downside still favoured. Our potential bottom dates remain as follows:
10th December
19th December
29th December
Could both precious metals continue higher?
Yes — if Gold breaks above 4245 and Silver breaks above 54 on a daily breakout basis, then both instruments could accelerate sharply to the upside. In that scenario, the dates listed above would likely flip from potential bottoms to potential tops.
However, for now, our Elliott Wave count, Gann timing, and statistical work continue to point more towards a reversal and a downside move. We acknowledge that the current trend, with all these strong green candles, looks powerful and convincingly bullish — but this does not change our bearish bias unless the market proves otherwise.
In all cases, stay safe and always apply strict risk management.
XAGUSD - Forming Bullish Pattern Cup & Handle - Ready to Fly OANDA:XAGUSD
- What this Cup & Handle Pattern & How It Should Be Traded.
Silver (XAGUSD has created a clear 2‑hour Cup & Handle / rounding‑bottom structure, a classic bullish continuation pattern where price first forms a rounded “U” base (cup) and then a smaller consolidation on the right side (handle).
The neckline around 54.50 is the key decision zone – repeated rejections there show supply, and a strong close above it usually signals that buyers have finally absorbed that supply and are ready for the next leg up.
The depth of the larger cup projected from the neckline gives a measured move, which aligns with upside objectives roughly around 61.50 (Target 1) and 64.00 (Target 2) on this chart.
Cup & Handle works best when traders combine the pattern with strict risk management – risking only 1–2% of account per trade so that multiple small losses do not damage capital.
Execution Section – Exact Plan (For Education Only)
Bias: Bullish, but only above the breakout level
Entry
Trade long only above 54.50. A 2H candle close above 54.50 with a solid body is the breakout confirmation; wicks alone are not enough.
Stop‑loss
Partial / active SL: 50.75 – if price closes below this handle support, treat it as handle failure and either book loss or reduce size aggressively.
Positional SL (pattern invalidation): 48.50 – a close below the second‑cup low invalidates the entire structure; exit fully without averaging down.
Targets
Target 1: 61.50 – derived from measured‑move logic of the cup; good zone to book partial profits and trail stop to at least entry.
Target 2: 64.00 – extended objective if momentum sustains; manage with trailing stop below higher swing lows to lock in open profits.
Risk Rules for Anyone Following
Risk a fixed 1–2% of account per trade and calculate position size from distance between entry and chosen stop (partial or positional).
If price closes back below 50.75 after breakout, treat it as early warning; if it closes below 48.50, the idea is over – no “hoping,” only disciplined exit.

Silver is breaking the wedge upwards Silver prices is breaking the raising wedge rn. It’s amazing to see it quickly reaching 60 soon. I hope it won’t rally to $100. Otherwise it would be end of this trend.

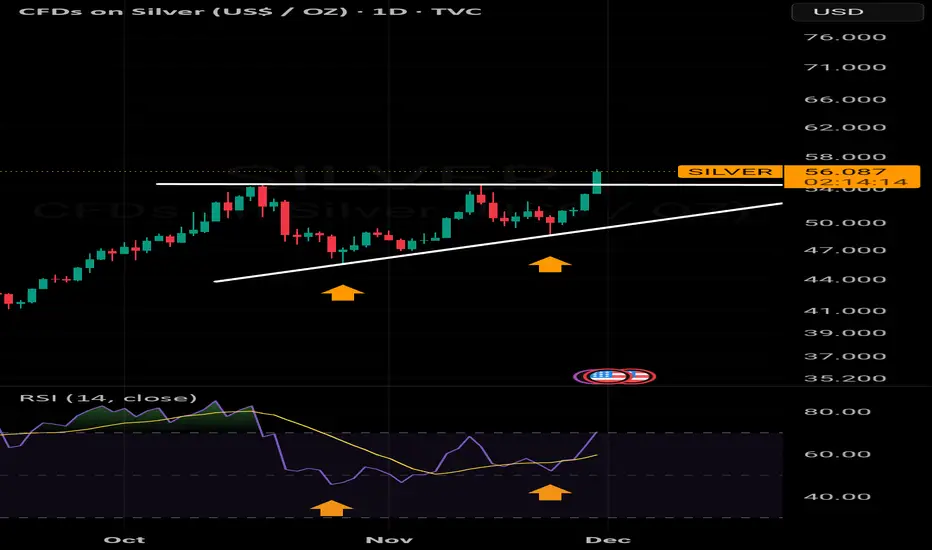
Bullish ascending triangle, waiting for breakoutSilver is forming a bullish ascending triangle. A breakout to the upside is a bullish signal. In that case a retest of the $54 level is likely. RSI divergence supports bullish thesis. A violation of the triangle base would invalidate.

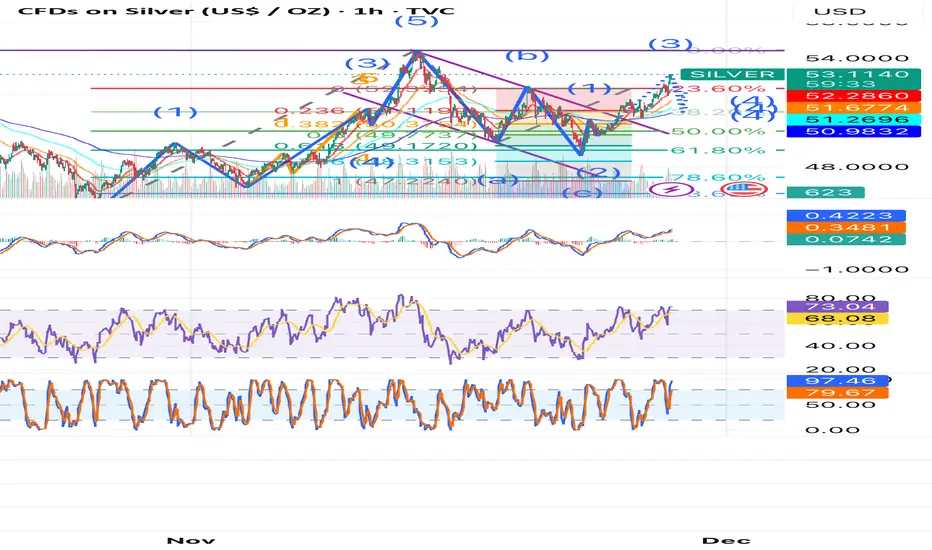
Silver: The Most Mispriced Asset of the Current Commodity SupercSilver looks like one of the clearest cases of mispricing in the current commodity supercycle. Fundamentally and from a demand-growth standpoint, silver is extremely strong, yet the market continues to price it as if the metal were abundant and optional, not structurally tight and increasingly indispensable.
The gold-to-silver ratio tells the story clearly: with gold around $4,065/oz and silver around $50/oz, the ratio sits near 81:1, far above the post-1970 historical mean of roughly 60:1. Historically, deviations above 75–80 have tended to be temporary dislocations that lasted 4–12 months before mean-reverting violently. In many such cases, the reversion came not from gold falling, but from silver accelerating upward at a much faster rate.
That setup is now repeating.
Technically, silver is sitting at a compelling entry zone. On the short-term structure, the metal has already broken above its downward corrective A-B-C channel, completing the C-wave at approximately 0.786 × Wave A rather than a full 1.0 extension, showing buyers stepped in early and with strength. This is often a hallmark of a developing impulse structure.
Price has also double-topped near the marked purple resistance around $54.50, which could be used as a short-term trade resistance or a long-term buying opportunity. A decisive breakout above this level with strong volume would confirm the beginning of a much larger impulse, which aligns cleanly with the broader Wave 5 interpretation on the 1-day chart. That gives the setup both:
- a macro-ratio tailwind, and
- a technical pattern showing the early phase of a bullish expansion leg.
Silver is acting like a coiled spring: ratio extreme, structural demand pressure, and impulsive wave dynamics all point toward a potential accelerated repricing phase.
XAGUSD H1 | Bullish Bounce Off Key SupportMomentum: Bullish
Price is currently above the ichimoku cloud.
Buy entry: 50,608
- Strong pullback support
- 50% Fib retracement
- 100% Fib projection
- Fair Value Gap
Stop Loss: 49.634
- Swing low support
Take Profit: 51.631
- Multi-swing high resistance
High Risk Investment Warning
Stratos Markets Limited (tradu.com/uk ), Stratos Europe Ltd (tradu.com/eu ):
CFDs are complex instruments and come with a high risk of losing money rapidly due to leverage. 70% of retail investor accounts lose money when trading CFDs with this provider. You should consider whether you understand how CFDs work and whether you can afford to take the high risk of losing your money.
Stratos Global LLC (tradu.com/en ): Losses can exceed deposits.
Please be advised that the information presented on TradingView is provided to Tradu (‘Company’, ‘we’) by a third-party provider (‘TFA Global Pte Ltd’). Please be reminded that you are solely responsible for the trading decisions on your account. Any information and/or content is intended entirely for research, educational and informational purposes only and does not constitute investment or consultation advice or investment strategy. The information is not tailored to the investment needs of any specific person and therefore does not involve a consideration of any of the investment objectives, financial situation or needs of any viewer that may receive it. Past performance is not a reliable indicator of future results. Actual results may differ materially from those anticipated in forward-looking or past performance statements. We assume no liability as to the accuracy or completeness of any of the information and/or content provided herein and the Company cannot be held responsible for any omission, mistake nor for any loss or damage including without limitation to any loss of profit which may arise from reliance on any information supplied by TFA Global Pte Ltd.

XAGUSD H4 | Bullish RiseMomentum: Bullish
The price has reacted off the buy entry, which is a pullback support.
Buy entry: 50.84
Pullback support
Stop loss: 49.39
Pullback support
Take profit: 54.09
SWing high resistance
145% Fibonacci extension
High Risk Investment Warning
Stratos Markets Limited (tradu.com ), Stratos Europe Ltd (tradu.com ):
CFDs are complex instruments and come with a high risk of losing money rapidly due to leverage. 70% of retail investor accounts lose money when trading CFDs with this provider. You should consider whether you understand how CFDs work and whether you can afford to take the high risk of losing your money.
Stratos Global LLC (tradu.com ): Losses can exceed deposits.
Please be advised that the information presented on TradingView is provided to Tradu (‘Company’, ‘we’) by a third-party provider (‘TFA Global Pte Ltd’). Please be reminded that you are solely responsible for the trading decisions on your account. Any information and/or content is intended entirely for research, educational and informational purposes only and does not constitute investment or consultation advice or investment strategy. The information is not tailored to the investment needs of any specific person and therefore does not involve a consideration of any of the investment objectives, financial situation or needs of any viewer that may receive it. Past performance is not a reliable indicator of future results. Actual results may differ materially from those anticipated in forward-looking or past performance statements. We assume no liability as to the accuracy or completeness of any of the information and/or content provided herein and the Company cannot be held responsible for any omission, mistake nor for any loss or damage including without limitation to any loss of profit which may arise from reliance on any information supplied by TFA Global Pte Ltd.

SILVER LongTrendline break and trendline support.
Look to buy a little pullback.
See if the levels work


Silver Wave Analysis – 24 November 2025
- Silver reversed from support area
- Likely to rise to resistance level 52.50
Silver recently reversed from support area between the round support level 50.00 (which was set as the likely downward target in our earlier report for this instrument), 20-day moving average and the 50% Fibonacci correction of the upward impulse (1) from October.
The upward reversal from this support area started the active intermediate impulse wave (3).
Given the overriding daily uptrend, Silver can be expected to rise to the next resistance level 52.50 (top of the previous wave B).

XAGUSD _ 4h
Update on silver
I would be waiting to see market reaction when price touches top of the Chanell.

Silver oversold bounce testing resistance at 5033The Silver remains in a bullish trend, with recent price action showing signs of a corrective pullback within the broader uptrend.
Support Zone: 4845 – a key level from previous consolidation. Price is currently testing or approaching this level.
A bullish rebound from 4845 would confirm ongoing upside momentum, with potential targets at:
5033 – initial resistance
5108 – psychological and structural level
5214 – extended resistance on the longer-term chart
Bearish Scenario:
A confirmed break and daily close below 4845 would weaken the bullish outlook and suggest deeper downside risk toward:
4780 – minor support
4740 – stronger support and potential demand zone
Outlook:
Bullish bias remains intact while the Silver holds above 4845. A sustained break below this level could shift momentum to the downside in the short term.
This communication is for informational purposes only and should not be viewed as any form of recommendation as to a particular course of action or as investment advice. It is not intended as an offer or solicitation for the purchase or sale of any financial instrument or as an official confirmation of any transaction. Opinions, estimates and assumptions expressed herein are made as of the date of this communication and are subject to change without notice. This communication has been prepared based upon information, including market prices, data and other information, believed to be reliable; however, Trade Nation does not warrant its completeness or accuracy. All market prices and market data contained in or attached to this communication are indicative and subject to change without notice.

XAGUSD idea 11.11.2025I'm primarily looking at two scenarios here: a short could potentially be at sfp above high at a price of around 53.1 and a short that I would like is sfp below low at a price of around 46.7

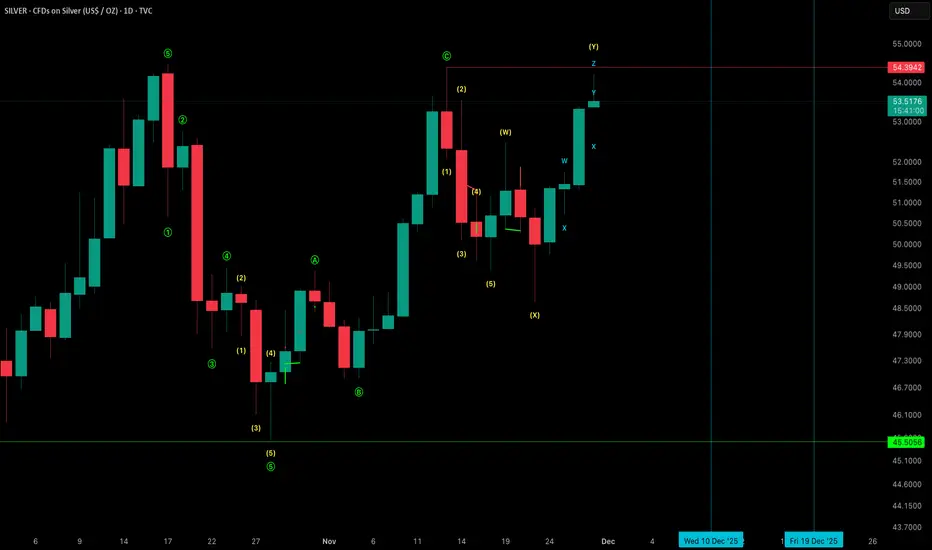
XAGUSD Silver Outlook (Count 2)Here is my primary view on FX_IDC:XAGUSD . This is an updated view taking in to account the monthly time frame chart which i have recently shared, i may work on publishing the monthly idea soon.
In this outlook silver is currently close to working through a series of wave 4's and 5's. As I mention on the chart if the projected levels change but the sequence is accurate then I’ll be happy with that.
I have added some more comments in the chart regarding the Elliott wave guideline of alternation, which we should consider when forecasting future price action.
In line with the monthly chart, this outlook now shows the $87 target, and the analysis behind it. I have changed the wave degrees to reflect this current impulsive rally being in the cyan primary degree sitting under the purple cycle degree wave III.
More comments on the chart.

xagusd 4h🔹 Overall Outlook and Potential Price Movements
In the charts above, we have outlined the overall outlook and possible price movement paths.
As shown, each analysis highlights a key support or resistance zone near the current market price. The market’s reaction to these zones — whether a breakout or rejection — will likely determine the next direction of the price toward the specified levels.
⚠️ Important Note:
The purpose of these trading perspectives is to identify key upcoming price levels and assess potential market reactions. The provided analyses are not trading signals in any way.
✅ Recommendation for Use:
To make effective use of these analyses, it is advised to manually draw the marked zones on your chart. Then, on the 15-minute time frame, monitor the candlestick behavior and look for valid entry triggers before making any trading decisions.
