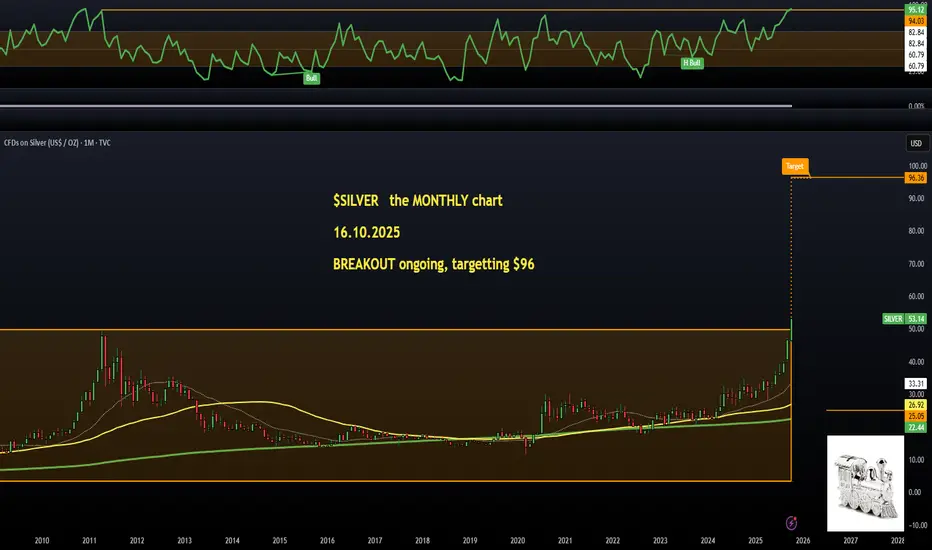
$SILVER (monthly): BREAKOUT ongoing, targetting $96 for startersBeen posting about TVC:SILVER ever since I started posting on Square, even though this is a crypto platform, I could not stop myself from posting about it everywhere.
And most of you didn't pay any attention, I can see by the views statistics, lol.
It's been skyrocketing, $53 dollars broken, but there is still another 80% in this, at least. I personally have much bigger targets for the next few years as this cycle is far from finished, imo.
$96 is just based on this RECTANGLE breakout, which is currently ongoing. All we really need is a close above $50 to confirm it.
Right now the RSI is extremely overbought, similar levels to the 2011 top, but fundamentally, SILVER is very undervalued and even in terms of silver/gold ratio.. A lot of upside to come. 👽💙
Trade ideas
Silver to 130 USD?Looks like it will. I guess that'll be my target with all the miners.
What a violent next few months we'll have..
Not financial advice.

The Silver ChartRecent technical analysis suggests a bearish signal for silver, with charts showing a potential reversal after a significant rally. However, there is conflicting information, as some technical indicators still show a "Strong Buy" signal and long-term fundamental factors like tight supply and industrial demand could support prices
Silver Monthly breakoutSilver is clearly breaking out of the long term cup (partially shown) and Handle pattern of 45 years..

Setupsfx_ | SILVER: Preparing For Another Bullish Move! There are two buying areas we believe could reverse the price trend, which would be a significant move in silver price history. We may even see it go above $40 for the first time. Silver is becoming a secondary best option to invest in the global market, but it will never surpass gold at least for now.
Good luck and trade safely!
Team Setupsfx_

Silver (XAGUSD) – Bearish Momentum Building#Silver (#XAGUSD H4) – Bearish Momentum Building
Current price: $52.46
Silver is showing early signs of a downside continuation after a completed corrective rebound. The structure suggests a potential shift toward a new impulsive leg lower.
🧩 Technical Overview
• Price reversed from the $53.00 resistance zone after completing a local correction.
• The rising channel was broken, confirming weakness and early downside momentum.
• Market structure now favors a decline, with the trend shifting toward lower highs and lower lows.
📉 Scenario
If price confirms a downward continuation:
• Stop-loss: above the recent high near $53.00.
• Once a clear H4 fractal forms, the stop should trail above the most recent fractal high.
• The main downside targets are aligned with Fibonacci levels from the previous swing:
– First zone: $50.50 (initial reaction area)
– Next support: $47.20–$47.40
– Extended target: $44.10–$44.30
– Major accumulation zone: $41.20
⚙️ Market Context
• The overall bullish impulse from mid-September appears exhausted.
• Lower timeframe momentum confirms growing pressure from sellers.
• A clean break below $50.50 would confirm continuation of the downward leg.
🧭 Summary
Silver remains in a corrective decline phase, showing potential for deeper retracement if sellers maintain control.
As long as price stays below $53.00, the bias remains bearish, with focus on $47.20–$44.00 as the key reaction zones.

SILVER: Strong Bullish Sentiment! Long!
My dear friends,
Today we will analyse SILVER together☺️
The market is at an inflection zone and price has now reached an area around 52.802 where previous reversals or breakouts have occurred.And a price reaction that we are seeing on multiple timeframes here could signal the next move up so we can enter on confirmation, and target the next key level of 53.558.Stop-loss is recommended beyond the inflection zone.
❤️Sending you lots of Love and Hugs❤️

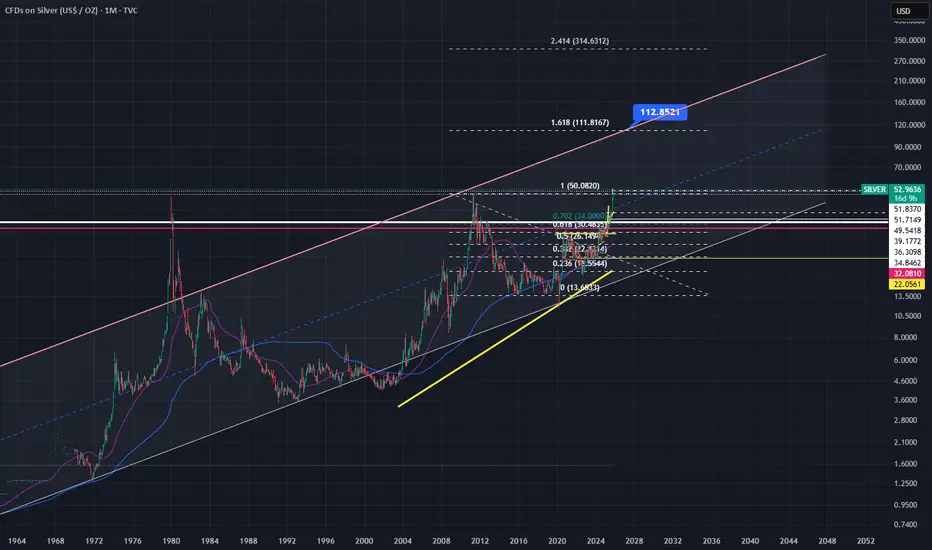
Silver to the 1.618 Fib Extension? $111.00Could silver be headed to the 1.618 fib extension which also coincides with upper channel trend line?

#XAGUSD 18% MOVE SINCE BREAKOUT??#Silver has clearly broken the resistance at 50.
Has already given an 18% move since breaking out.
Target clearly 300 for long term.
This has become now a rally leader.

silver usdHI GUYS,
CORRECTION ON TECHNICAL
I made a serious loss today on silver usd.
adjustments were made because silver failed to respect price patterns.
am a human being i make mistakes.
Will be selling tomorrow as soon as we reach MID TERM area of interest.
NOTE THE PRICE PATTERNS HAVE NOT CHANGED , HOWEVER MY ENTRY LEVEL WAS WRONG.

Silver - Expecting Bullish Continuation In The Short TermH4 - Strong bullish momentum.
No opposite signs.
Until the two Fibonacci support zones hold I expect the price to move higher further.
If you enjoy this idea, don’t forget to LIKE 👍, FOLLOW ✅, SHARE 🙌, and COMMENT ✍! Drop your thoughts and charts below to keep the discussion going. Your support helps keep this content free and reach more people! 🚀
--------------------------------------------------------------------------------------------------------------------

SILVER : The energy transition’s most undervalued asset.so , AG has always been the undervalued metal in a tight cycle.
Historically SILVER to GOLD ratio was 89-90:1
Now, the newest variable : the industrial demand , which historically was not even an driver like it is today is only growing in demand.
As SILVER is needed in SOLAR , EV industry as a vital component.
SUPPLY ISSUES:
- no major SILVER mines are expected to come back online till 2027-2028
- and the fact is SILVER always comes as a byproduct as the raw material always be a mix of other metals like lead, zinc and copper.
TECHNICALS
i projected a medium term high leverage trade idea but a Multi year ascending triangle is forming ever since 2020.
and COT data shows commercial short position unwinding lately.
i used my custom projection tool for range calculates (on chart)
cannot publish with my priv COT indicator publicly.

Stop!Loss|Market View: SILVER🙌 Stop!Loss team welcomes you❗️
In this post, we're going to talk about the near-term outlook for SILVER ☝️
Potential trade setup:
🔔Entry level: 50.05638
💰TP: 47.31895
⛔️SL: 52.62271
"Market View" - a brief analysis of trading instruments, covering the most important aspects of the FOREX market.
👇 In the comments 👇 you can type the trading instrument you'd like to analyze, and we'll talk about it in our next posts.
💬 Description: The most likely scenario for silver is currently moving toward the nearest support level at 50.78000, where a downward breakout is expected. In this case, it would be safe to say the local uptrend has been broken. An alternative (less likely) scenario suggests a new high near 52, where a reversal could be anticipated. In both cases, it's best to look for a potential entry once the price reaches indicated levels.
Thanks for your support 🚀
Profits for all ✅
❗️ Updates on this idea can be found below 👇


SILVER Will Keep Growing! Buy!
Hello,Traders!
SILVER shows Smart Money accumulation from the horizontal demand area, with bullish displacement suggesting price will tap into the 5,280$ liquidity pool next. Time Frame 1H.
Buy!
Comment and subscribe to help us grow!
Check out other forecasts below too!
Disclosure: I am part of Trade Nation's Influencer program and receive a monthly fee for using their TradingView charts in my analysis.

SILVER: Move Down Expected! Short!
My dear friends,
Today we will analyse SILVER together☺️
The market is at an inflection zone and price has now reached an area around 51.748 where previous reversals or breakouts have occurred.And a price reaction that we are seeing on multiple timeframes here could signal the next move down so we can enter on confirmation, and target the next key level of 51.089.Stop-loss is recommended beyond the inflection zone.
❤️Sending you lots of Love and Hugs❤️

SILVER-potential buy zonesilver is in buul run as it is printing new HH and HL's now it retraced to 0.5-0.6 fib level with 100 ema and trendline support.

Silver Bounce From Support After RetracementSilver is giving a "Buy" entry after retracement on 1H and 4H timeframes. It has also bounced from support, indicating that it can further go up.
Let's take a 1:1 trade here.


silver usdHI GUYS
we cleared mid term area of interest now we are in sell situation.
We are in London session , silver sells

XAGUSD (Silver) 45 Year's Breakout Will Going To Upside What to say about the XAGUSD (Silver) 45 & 14 Year's Breakout Will Going To Upside more target 55-60-69 in Upcoming Year's Now Price 49.65
