#XAGUSD Silver – Monthly Chart (Higher Time Frame Analysis Updat📈 #XAGUSD Silver – Monthly Chart (Higher Time Frame Analysis Update)
On the monthly COMEX chart, Silver has reached a historically critical zone — a level it has touched only three times since its inception on the forex market ⚡️
### 🕰 Historical Context
1️⃣ 1980:
Silver made its first-ever major peak around $48, followed by a massive correction all the way down to $5.
2️⃣ April 2011:
The metal created another lifetime high at $49.80, but history repeated itself — price crashed sharply, touching lows near $11.50 in subsequent years.
3️⃣ October 2025 (Current Scenario):
Silver has now printed a new high at $51.20, marking its third attempt in history to sustain above the psychological barrier of $50.
---
### 🔍 Key Technical Outlook
Both previous times, Silver failed to sustain above $50, leading to deep corrections.
Hence, this time, we need to see at least 1–2 consecutive weekly candle closings above the $50–$51 zone to confirm a strong breakout and trend continuation.
Once that confirmation comes in, we could confidently plan fresh long entries, as this would signal a potential super-cycle rally in Silver 🔥
---
### 🎯 Upside Projections
If Silver manages to hold above $50 convincingly, the next major targets on a higher timeframe would be:
* First Target: $60
* Extended Target: $68
This move could potentially open the doors for a massive long-term bullish phase, supported by both technical breakout and global precious metal demand fundamentals 💎
Trade ideas

SILVER USDHI GUYS,
We are so bullish on silver . still holding on to buy entries that we made last 3 months, last month and last week.
Take profit GRAND FINAL HS H4 (56.59109 HEAD)
Take profit MID TERM HS H4 ( 53.23641 SHOULDER).
I will post entries only when we reach mid term area of interest soon.
we can adjust our trailing stop loss to secure profits on every break and retest moves the market presents.
WISH U LUCK AND SAFE HOLDING, TILL TAKE PROFIT AREAS

SILVER: Will Go Up! Long!
My dear friends,
Today we will analyse SILVER together☺️
The in-trend continuation seems likely as the current long-term trend appears to be strong, and price is holding above a key level of 51.673 So a bullish continuation seems plausible, targeting the next high. We should enter on confirmation, and place a stop-loss beyond the recent swing level.
❤️Sending you lots of Love and Hugs❤️

Silver Shines — But Caution Ahead?Silver Shines — But Caution Ahead?
- Silver has just hit a fresh all-time high of $51.70, breaking past its 2011 record.
- However, the monthly RSI is racing toward the extreme 85.00 zone, a level that previously marked major tops in 2006, 2008, and 2011.
Momentum remains strong, but history suggests (as shown in the monthly Silver Chart) that when RSI enters this zone, sharp pullbacks tend to follow.
I don't mean, the the rally is over — but it's just a reminder that every time a steep vertical move is often followed by high volatility (volatility might invite pullbacks).

How much longer can it sustain this velocity?If silver reaches $53.50, then it would have reproduced a similar move done back in 2010-2011.
How much longer can it sustain this velocity?

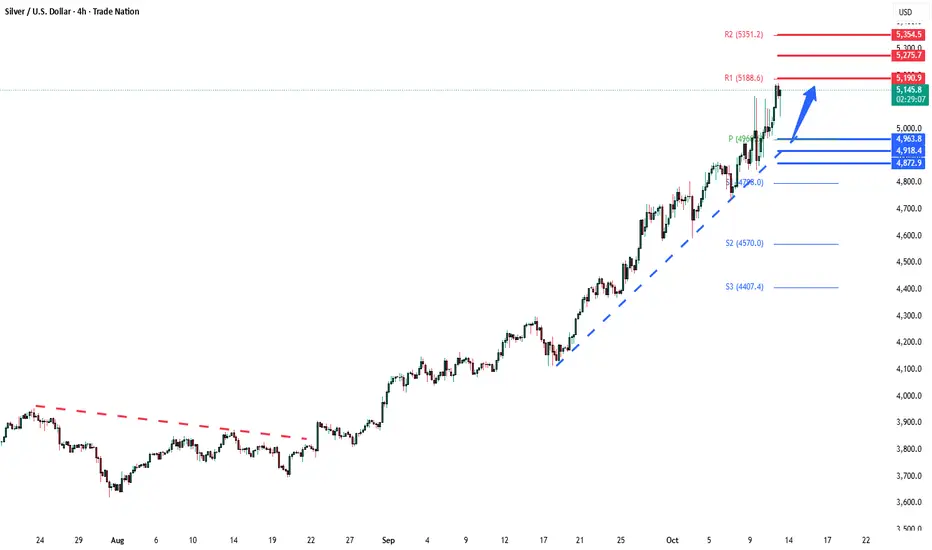
Silver bullish breakout supported at 4964The Silver remains in a bullish trend, with recent price action showing signs of a continuation breakout within the broader uptrend.
Support Zone: 4964 – a key level from previous consolidation. Price is currently testing or approaching this level.
A bullish rebound from 4964 would confirm ongoing upside momentum, with potential targets at:
5190 – initial resistance
5275 – psychological and structural level
5355 – extended resistance on the longer-term chart
Bearish Scenario:
A confirmed break and daily close below 4964 would weaken the bullish outlook and suggest deeper downside risk toward:
4920 – minor support
4870 – stronger support and potential demand zone
Outlook:
Bullish bias remains intact while the silver holds above 4964. A sustained break below this level could shift momentum to the downside in the short term.
This communication is for informational purposes only and should not be viewed as any form of recommendation as to a particular course of action or as investment advice. It is not intended as an offer or solicitation for the purchase or sale of any financial instrument or as an official confirmation of any transaction. Opinions, estimates and assumptions expressed herein are made as of the date of this communication and are subject to change without notice. This communication has been prepared based upon information, including market prices, data and other information, believed to be reliable; however, Trade Nation does not warrant its completeness or accuracy. All market prices and market data contained in or attached to this communication are indicative and subject to change without notice.
SILVER SELLERS WILL DOMINATE THE MARKET|SHORT
SILVER SIGNAL
Trade Direction: short
Entry Level: 5,140.8
Target Level: 5,029.5
Stop Loss: 5,214.4
RISK PROFILE
Risk level: medium
Suggested risk: 1%
Timeframe: 1h
Disclosure: I am part of Trade Nation's Influencer program and receive a monthly fee for using their TradingView charts in my analysis.
✅LIKE AND COMMENT MY IDEAS✅

$XAGUSD Silver3 targets based on Fibonacci and the giant cup and handle formation.
Target 1 = 45.47 has already been hit. Bat pattern.
Target 2 = 54.79 Alternate bat at fibonacci level 1.13
Target 3 = 73.43 crab pattern fibonacci level 1.618
Target 4 = 96.26 for cup and handle pattern.

Silver: New ATH, Sharp Pullback, and What Comes NextLast week, something traders had been waiting for finally happened — Silver reached a new all-time high, touching 51.30 before a strong 3,000-pip selloff followed.
However, looking closely at the chart, we can see that this decline stopped precisely at the confluence of horizontal support and the ascending channel’s lower boundary — a technical level that often attracts renewed buying interest.
In my Friday’s analysis, I mentioned that although Silver looked very strong, traders should watch the ATH zone and the channel’s upper resistance for potential pullbacks. Indeed, XAGUSD reacted exactly from that area and corrected lower.
Now, things get very interesting:
1. Strong demand near $50 – Despite the initial drop on Friday, Silver built a solid floor just under the 50 level, suggesting that buyers remain in control and the recent ATH might just be a prelude to new highs.
2. Holding above the median line – The price is hovering around the channel’s midline without testing the lower boundary, a clear sign of underlying strength.
3. Potential pennant formation – Although not perfectly shaped, the price action since Thursday resembles a small pennant, which is typically a continuation pattern in bullish trends.
Putting these clues together, the technical picture still favors the upside, with confirmation coming if price sustains above the 50.50–50.70 zone.
If that happens, considering Silver’s recent momentum, we could easily see $55 as the next target in the coming week.
As long as $49 remains intact, my plan stays simple — buy the dips. 🚀
Silver XAG/USD Eyes 49+ – Uptrend Intact, Pullback Could Fuel MoHello everyone,
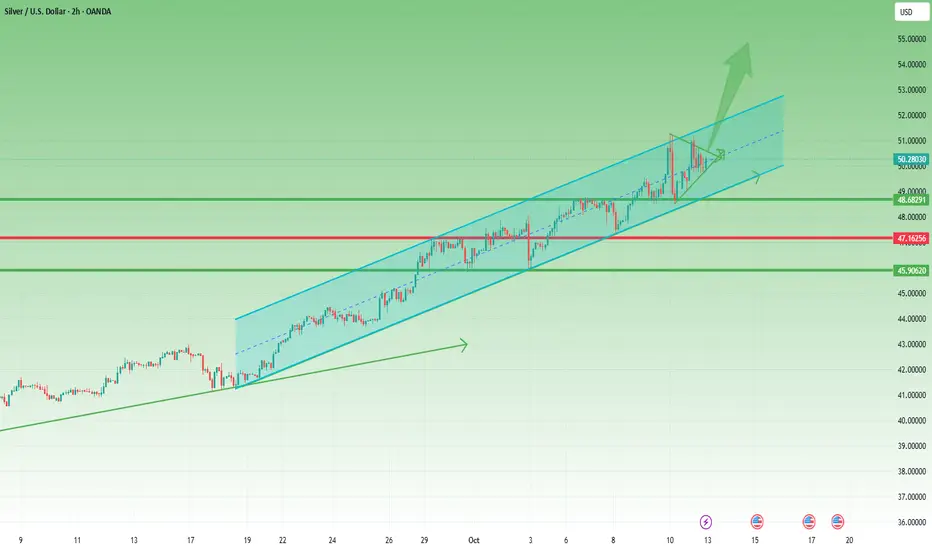
Silver OANDA:XAGUSD is showing a strong uptrend and appears “well-fueled” to reach the 49+ region in the short term. This rally is supported not only by technical factors but also by a volatile macro backdrop. In the US, CPI and PCE metrics, especially Core, remain key drivers: softer-than-expected readings reduce real yields, weaken the USD, and boost silver; hotter prints apply pressure.
Growth and input-cost data such as ISM/PMI (Manufacturing & Services), notably Prices Paid, influence industrial demand – electronics, solar – but extreme readings could push yields and USD higher, offsetting the impact. Fed statements and FOMC minutes are also critical: dovish tones favor silver, hawkish stances weigh on price. ETF inflows and speculative positions further support the rally, with SLV, SIVR showing strong inflows and CFTC net longs rising.
On the 4H chart, the technical structure remains robust: price stays above the ascending Ichimoku cloud, FVG steps form and partially fill, producing healthy “push-rest-push” behavior. Key levels include support at 48.05–48.20, deeper at 47.60–47.80; resistance near 48.85–49.00, then 49.40, with higher targets at 49.80–50.00.
The preferred scenario is a shallow pullback to 48.05–48.20 to gather momentum, followed by a breakout through 48.85–49.00 toward 49.40; if buying pressure persists, 49.80–50.00 is reachable. This is supported by technical alignment, Ichimoku support, FVG steps, and a favorable macro backdrop: soft CPI/PCE/ISM data or dovish Fed moves lower real yields and USD, triggering strong breakout. Even neutral news favors buy-the-dip as long as 48.05–48.20 holds . The invalidation level is a 4H close below 47.60.
What do you think – will silver push past 49+, or will it need a corrective leg first?

SILVER (XAGUSD) 15M – Bearish Rejection Setup Ahead TVC:SILVER
Structure | Trend | Key Reaction Zones
Price reached the accumulation + resistance zone, facing repeated rejections.
Structure is forming a lower-high pattern beneath the descending trendline.
If the rejection confirms, a sharp drop toward the next liquidity pool (49.00 area) can follow.
Market Overview
Silver has been ranging within a broad accumulation zone after rejecting the upper resistance region around 50.8–51.2. The market shows weakness near the top of the channel, hinting at a bearish continuation phase. If momentum fails to break above the diagonal resistance, a downside move toward 49.5–49.0 becomes highly probable before a possible reaction from the strong demand box.
Key Scenarios
✅ Bearish Case 📉 → 🎯 Target 1: 49.52 | 🎯 Target 2: 49.03 | 🎯 Target 3: 48.70
❌ Bullish Case 🚀 → 🎯 Target 1: 50.80 | 🎯 Target 2: 51.20 (if resistance breaks cleanly)
Current Levels to Watch
Resistance 🔴 : 50.80 – 51.20
Support 🟢 : 49.50 – 49.00 – 48.70
⚠️ Disclaimer: For educational purposes only. Not financial advice.

xagusdHave we seen high for year? deffo a cup there. Supports drop for gold to hard to say but i see weakness and possible correction in metals i cannot ignore

Silver LongWanting to long silver on pullback. Expecting pullback after many long wicks rejections, pulling back into area of support, confluence is the rising par. chan. and fib below 0.5, also market uncertainty after Friday's crazy drop

Gold’s Playbook Repeating in Silver?HI GUYS!
History doesn’t repeat, but in the markets, it often rhymes, and silver’s chart looks eerily familiar.
Gold’s long-term cup-and-handle pattern between 2013–2023 led to a massive breakout above $4,000. Now, silver appears to be tracing the same formation, just a few years behind.
Silver’s cup (2011–2024) has completed, and its handle (a descending channel) is forming right where gold’s did before it launched.
The measured target? Around $200+ USD, a level that would mark a historic revaluation of the metal.
With industrial demand rising and monetary uncertainty persisting, silver could soon follow gold’s lead, turning this technical Deja vu into a full-blown breakout.
History’s playbook is open. Silver might be next.

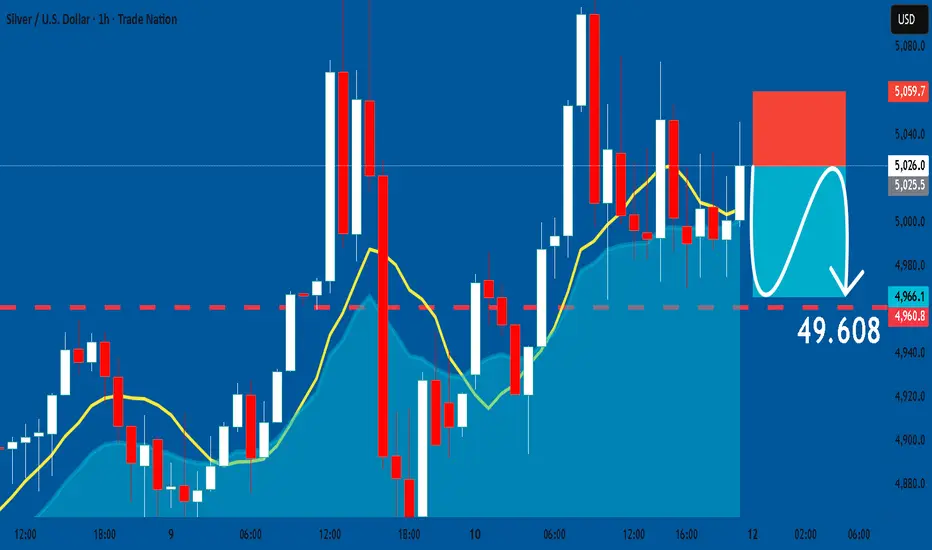
SILVER: Short Trade Explained
SILVER
- Classic bearish pattern
- Our team expects retracement
SUGGESTED TRADE:
Swing Trade
Sell SILVER
Entry - 50.260
Stop - 50.597
Take - 49.608
Our Risk - 1%
Start protection of your profits from lower levels
Disclosure: I am part of Trade Nation's Influencer program and receive a monthly fee for using their TradingView charts in my analysis.
❤️ Please, support our work with like & comment! ❤️
Silver Near Its All-Time High — Time to Secure Profits or Hold ?Hello Traders 🐺
Many of you have been asking for my thoughts on Silver’s price, so let’s break it down together.
To be honest, it’s not an easy call right now — we’re in a situation where several strong bullish and bearish factors are mixed together, making decision-making a bit tricky.
But don’t worry, let’s take a look at the chart first, then we’ll go over the current global and U.S. economic conditions, and finally come up with a solid strategy 👇
As you can see on the chart, Silver is getting very close to its all-time high around $50. Naturally, many traders start taking profits when we approach such major resistance levels — and honestly, that’s totally reasonable since psychological levels always matter.
However, when you take a closer look at the candles, you can still see a strong bullish momentum holding the trend.
Now, considering the upcoming tariff wars, geopolitical tensions in the Middle East, and the ongoing Russia conflict, things are getting pretty interesting.
Yes, in wartime, both Gold and Silver tend to rise because national currencies lose value — but we also need to remember that wars often bring recessions, and that can lower industrial demand, especially from electronics and tech industries, which are big silver consumers.
When people start prioritizing essentials and hold onto cash, non-essential spending drops, leading to lower demand for silver.
On the other hand, both Gold and Silver have already been in a long-term bullish rally, and prices are no longer ideal for large fresh entries.
As you know, the trend is our friend — until it ends.
From my personal point of view, a partial profit-taking around current levels, followed by re-accumulation during a possible pullback toward the support area I marked on the chart, seems like a smart play.
For example, you could sell half of your position here and buy it back if price dips to that key zone — while keeping the rest for a potential continuation to the upside.
As always, stay disciplined — because:
Discipline is rarely enjoyable, but almost always profitable.
🐺 KIU_COIN 🐺

Silver forming a long-term “Cup and Handle” - as Gold didSilver seems to be repeating the same institutional “Cup and Handle” structure that we recently saw play out perfectly on Gold.
On Gold, the price completed the entire measured move — equal to the depth of the cup — before entering consolidation.
Now, Silver is building a very similar long-term formation, and this setup could define the market direction for the next several years.
🧠 Technical Context
On the higher timeframes (1W and 1M), Silver has formed a clear rounded base — the cup.
The current consolidation area represents the handle, and price is now approaching the upper boundary of that handle.
Once we see a decisive breakout above the handle resistance, institutions will likely defend that zone on the first retest.
This pattern is one of the most reliable continuation formations in long-term trends, especially when accompanied by rising volume near the breakout area.
There’s a very important condition: this pattern becomes active only after the handle breakout.
Before the breakout, it’s just an unconfirmed structure — the pattern is validated only once the handle level is broken.
🎯 Trade Plan
Breakout Level (Handle Resistance): around $50.0 – $51
Usually, the breakout happens on high volume, accompanied by several strong bullish candles
Retest Zone: $30 – $35.0
Target (long-term extension): $600.0+
Stop-Loss: according to your risk management strategy
📊 Summary
If Silver repeats the Gold scenario, we might see a clean breakout–retest–continuation structure with very limited pullbacks once the move begins.
This could mark the start of a multi-year bullish phase in silver.
I’ll be monitoring the breakout confirmation and volume profile closely before entering.
Once confirmed, the upside potential looks substantial compared to the risk.
This is not financial advice. For educational purposes only

Silver will Make a New All Time HighHello Traders
In This Chart XAGUSD HOURLY Forex Forecast By FOREX PLANET
today XAGUSD analysis 👆
🟢This Chart includes_ (XAGUSD market update)
🟢What is The Next Opportunity on XAGUSD Market
🟢how to Enter to the Valid Entry With Assurance Profit
This CHART is For Trader's that Want to Improve Their Technical Analysis Skills and Their Trading By Understanding How To Analyze The Market Using Multiple Timeframes and Understanding The Bigger Picture on the Charts

Uptrend in silverAccording to previous analysis, this historical ceiling was broken and we can now enter a buy trade at the specified price if the demand range is not penetrated.

Silver Long-Term Outlook: Wyckoff, Fibonacci & Volunacci in PlayOn the monthly chart, Silver is showing a strong setup for long-term investors. We can clearly identify two adjacent Wyckoff accumulation patterns, signaling institutional accumulation phases.
Price action is following an ascending Fibonacci channel, reflecting a steady bullish structure. After breaking out of the second Wyckoff pattern, a Volunacci projection has formed—pointing toward a potential move to retest its historical high near $48.
This alignment of classic technical patterns with volume-based projection tools strengthens the long-term bullish case for Silver.

XAGUSD | Bullish Like Gold, Watching CDV for ConfirmationMy outlook on silver matches gold — bullish.
The entry zone is already marked, and I’ll be waiting for CDV confirmation before stepping in.
If CDV starts to turn positive and shows absorption at the marked area, I’ll look for a clean reaction entry.
Both metals are following similar accumulation behavior, and I prefer to let order flow and CDV strength validate the setup rather than front-run it.
Patience here matters, when CDV supports the move, it usually delivers clean follow-through.

What now for Silver ? If you had invested in Silver back in 1979 at the high of 47+ dollars, you would have to wait for 32 long years to breakeven. Not forgetting your inflationary costs, admin fees, etc. Just thinking about it sends chills - how many 32 years does one have in a lifetime? If you are lucky and invest when you are 18-20, that means you would be 52 years old to see it breakeven.
Then, say the next generation or you continue to invest in 2011 at the peak of 48, this time you are luckier. You waited 14 years only to see your capital breakeven, more than half of the previous case.
It is highly likely many would be taking profits off since they waited so long and with Silver at its highest level now, nobody knows for certain how high it will go or rather will it come down ?
I expect some pull back as this is a triple top formation which is bearish according to chart patterns. It could continue to go up a little before pulling back since equities market will see a continued wave of sell down in the coming weeks. Precious metals like gold and silver are deemed as safe havens and a large majority of the people are still holding on to this belief and thus will/may continue to shore up the price higher.
For me, I am just watching the show for now , not selling any since my exposure to Silver is not high.

XAGUSD 4H🔹 Overall Outlook and Potential Price Movements
In the charts above, we have outlined the overall outlook and possible price movement paths.
As shown, each analysis highlights a key support or resistance zone near the current market price. The market’s reaction to these zones — whether a breakout or rejection — will likely determine the next direction of the price toward the specified levels.
⚠️ Important Note:
The purpose of these trading perspectives is to identify key upcoming price levels and assess potential market reactions. The provided analyses are not trading signals in any way.
✅ Recommendation for Use:
To make effective use of these analyses, it is advised to manually draw the marked zones on your chart. Then, on the 5-minute time frame, monitor the candlestick behavior and look for valid entry triggers before making any trading decisions.
