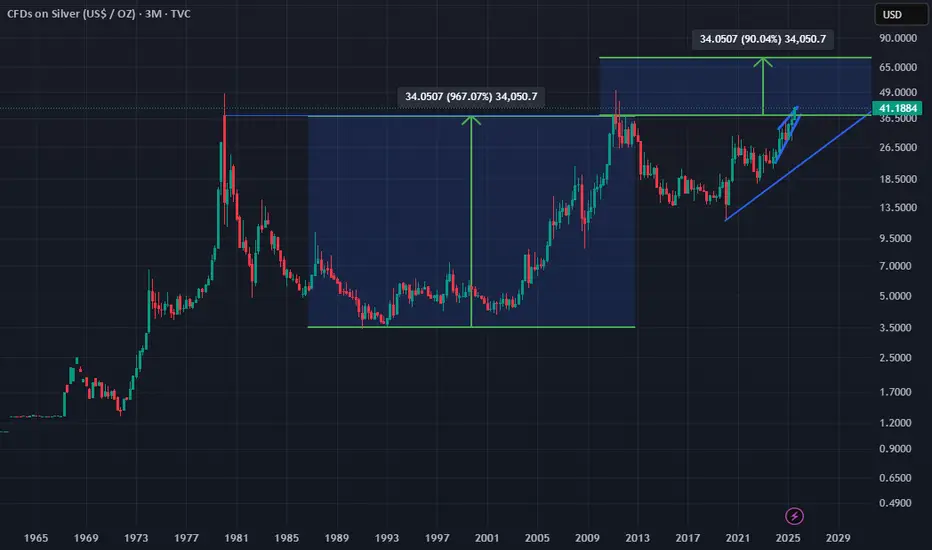
Silver/USD:Poised for a Breakout After 50 Years of ConsolidationIn my latest analysis of the Silver/USD chart, I've identified a significant resistance level at $48 USD. This level has been a formidable barrier for decades, but a breakout could signal a major shift. If Silver/USD manages to break through this resistance, we could see a target of $580 USD, representing a substantial upside potential.
Historically, after breaking out, assets often retest previous highs, so a retest of the $48 level might occur before a sustained move higher. This setup comes after an unprecedented 50-year consolidation period, suggesting that Silver/USD is gearing up for a long-term trend. This trade could unfold over the next five years, offering a compelling opportunity for long-term investors.
Trade ideas

Silver Bullish breakout continuation supported at 4144The Silver remains in a bullish trend, with recent price action showing signs of a continuation breakout within the broader uptrend.
Support Zone: 4144 – a key level from previous consolidation. Price is currently testing or approaching this level.
A bullish rebound from 4144 would confirm ongoing upside momentum, with potential targets at:
4260 – initial resistance
4320 – psychological and structural level
4375 – extended resistance on the longer-term chart
Bearish Scenario:
A confirmed break and daily close below 4144 would weaken the bullish outlook and suggest deeper downside risk toward:
4065 – minor support
4020 – stronger support and potential demand zone
Outlook:
Bullish bias remains intact while the silver holds above 4144. A sustained break below this level could shift momentum to the downside in the short term.
This communication is for informational purposes only and should not be viewed as any form of recommendation as to a particular course of action or as investment advice. It is not intended as an offer or solicitation for the purchase or sale of any financial instrument or as an official confirmation of any transaction. Opinions, estimates and assumptions expressed herein are made as of the date of this communication and are subject to change without notice. This communication has been prepared based upon information, including market prices, data and other information, believed to be reliable; however, Trade Nation does not warrant its completeness or accuracy. All market prices and market data contained in or attached to this communication are indicative and subject to change without notice.

Silver (XAGUSD) – Resistance Rejection Ahead?Silver (XAGUSD) is currently trading near the key $41.50 resistance area after a strong bullish rally. Price is showing signs of consolidation at the upper boundary of the rising channel. A rejection from this resistance could trigger a corrective move back towards the $40.00 – $39.50 support zone, with further downside potential towards the $38.00 support level if momentum weakens.
Resistance zone: $41.50 – $42.00
Key support zones: $40.00 – $39.50 / $38.00
Possible scenario: Short-term pullback from resistance after recent bullish structure
This setup highlights a possible reversal opportunity if sellers step in at resistance, but a breakout above $42.00 would invalidate the bearish outlook and suggest continuation higher.

XAGUSD H1 | Price retracing into support levelSilver (XAG/USD) is falling towards the buy entry, which is a pullback support that aligns with the 61.8% Fibonacci retracement and could bounce from this level to the take profit.
Buy entry is at 41.20, which is a pullback support that aligns with the 61.8% Fibonacci retracement.
Stop loss is at 40.76, which is a pullback support level.
Take profit is at 41.64, which is a swing high resistance level.
High Risk Investment Warning
Trading Forex/CFDs on margin carries a high level of risk and may not be suitable for all investors. Leverage can work against you.
Stratos Markets Limited (tradu.com ):
CFDs are complex instruments and come with a high risk of losing money rapidly due to leverage. 65% of retail investor accounts lose money when trading CFDs with this provider. You should consider whether you understand how CFDs work and whether you can afford to take the high risk of losing your money.
Stratos Europe Ltd (tradu.com ):
CFDs are complex instruments and come with a high risk of losing money rapidly due to leverage. 66% of retail investor accounts lose money when trading CFDs with this provider. You should consider whether you understand how CFDs work and whether you can afford to take the high risk of losing your money.
Stratos Global LLC (tradu.com ):
Losses can exceed deposits.
Please be advised that the information presented on TradingView is provided to Tradu (‘Company’, ‘we’) by a third-party provider (‘TFA Global Pte Ltd’). Please be reminded that you are solely responsible for the trading decisions on your account. There is a very high degree of risk involved in trading. Any information and/or content is intended entirely for research, educational and informational purposes only and does not constitute investment or consultation advice or investment strategy. The information is not tailored to the investment needs of any specific person and therefore does not involve a consideration of any of the investment objectives, financial situation or needs of any viewer that may receive it. Kindly also note that past performance is not a reliable indicator of future results. Actual results may differ materially from those anticipated in forward-looking or past performance statements. We assume no liability as to the accuracy or completeness of any of the information and/or content provided herein and the Company cannot be held responsible for any omission, mistake nor for any loss or damage including without limitation to any loss of profit which may arise from reliance on any information supplied by TFA Global Pte Ltd.
The speaker(s) is neither an employee, agent nor representative of Tradu and is therefore acting independently. The opinions given are their own, constitute general market commentary, and do not constitute the opinion or advice of Tradu or any form of personal or investment advice. Tradu neither endorses nor guarantees offerings of third-party speakers, nor is Tradu responsible for the content, veracity or opinions of third-party speakers, presenters or participants.

XAGUSD--LONG--After 4 days consolidation time to move forward
--monthly bullish
--weekly bullish
--daily bullish
--tp and entry levels are as shown on chart

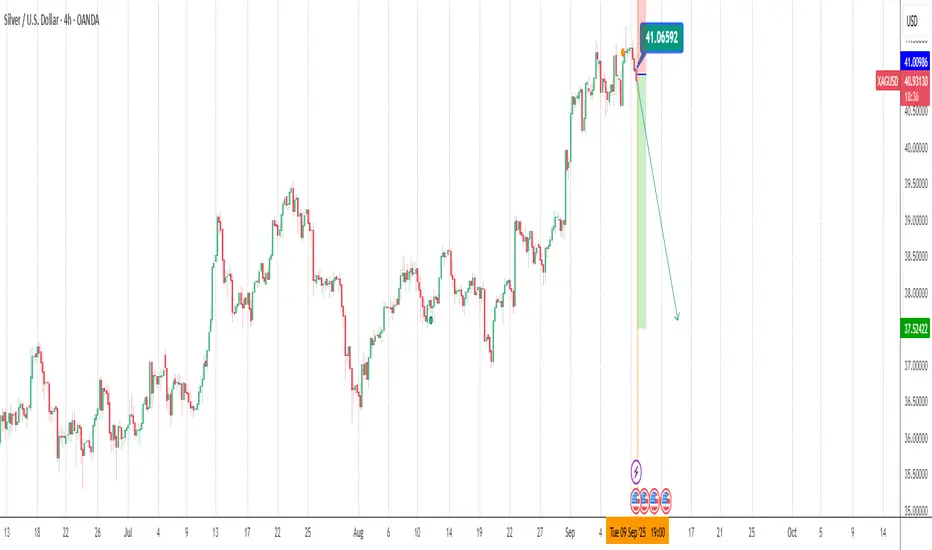
SILVER: Bears Are Winning! Short!
My dear friends,
Today we will analyse SILVER together☺️
The price is near a wide key level
and the pair is approaching a significant decision level of 41.351 Therefore, a strong bearish reaction here could determine the next move down.We will watch for a confirmation candle, and then target the next key level of 41.269.Recommend Stop-loss is beyond the current level.
❤️Sending you lots of Love and Hugs❤️

SLIVER-BULLISH IDEASILVER is seems to be in bull run as it is moving in bullish continuation pattren symmetrical triangle wait for its uper trend line and resistence to break to secure your entry

Silver Near PRZ – Bearish Reversal Incoming?Today I want to share with you an analysis of SILVER ( OANDA:XAGUSD ). In my opinion, in terms of technical analysis , Silver has a more regular chart than Gold( OANDA:XAUUSD ) these days.
Silver is currently trading near the Resistance line , Important Resistance lines , Yearly Resistance(2) and Potential Reversal Zone(PRZ) .
In terms of Elliott wave theory , it seems that Silver has managed to complete microwave 3 of the main wave 5 , and after the support lines are broken, we can expect a decline and completion of microwave 4 . The end of microwave 4 could follow Fibonacci levels .
Also, we can see the Regular Divergence(RD-) between Consecutive Peaks .
I expect Silver to fall to at least $40.51(First Target) AFTER breaking the support lines .
Second Target: $39.81
Stop Loss(SL): $42.18
Note: Today's US data release could cause a shock to Silver, but ultimately, Silver will continue its downward trend (at least to the first target).
Please respect each other's ideas and express them politely if you agree or disagree.
Silver/ U.S. Dollar Analyze (XAGUSD), 4-hour time frame.
Be sure to follow the updated ideas.
Do not forget to put a Stop loss for your positions (For every position you want to open).
Please follow your strategy and updates; this is just my Idea, and I will gladly see your ideas in this post.
Please do not forget the ✅' like '✅ button 🙏😊 & Share it with your friends; thanks, and Trade safe.

The most important number for silver$37.80. No other number on the price chart has as much significance as this number. When each candle represents 3M the textbook Cup and Handle on Silver suddenly reveals itself. More importantly the breakout! The Real breakout in Silver isn't $50. The Real breakout in silver just happened. And since it happened on 3M candle chart, one could assume this is a lasting breakout, much like $2000 Gold. We all saw what happened there.
SILVER: Will Go Up! Long!
My dear friends,
Today we will analyse SILVER together☺️
The in-trend continuation seems likely as the current long-term trend appears to be strong, and price is holding above a key level of 41.198 So a bullish continuation seems plausible, targeting the next high. We should enter on confirmation, and place a stop-loss beyond the recent swing level.
❤️Sending you lots of Love and Hugs❤️

Silver Holding 41 — Eyes on 42.5Silver defended 41.0 well. Bias remains bullish.
• Long @ 40.99 running
• Target: 42.50
• Invalidation: Below 40.6

XAGUSD Holding Firm Above $41, Bulls Eye Higher LevelsSilver continues to consolidate after its recent strong rally, holding above the $41.00 handle while respecting its rising trendline. Recent bearish interest rate news has pressured the U.S. dollar, further boosting precious metals. With this macro tailwind, silver’s bullish structure remains intact as long as key supports hold.
🔍 Technical Analysis
Current price: $41.17.
Price has maintained momentum above the ascending trendline since August.
Immediate consolidation near recent highs signals market strength rather than exhaustion.
Multiple layered supports sit below, keeping the bullish case intact.
🛡️ Support Zones & Stop-Loss (White Lines):
🟢 $39.87 – 1H Support (High Risk)
First short-term defense.
Stop-loss: $39.52
🟡 $37.22 – 4H Support (Low Risk)
Stronger structural zone.
Stop-loss: $36.95
🟠 $34.76 – Daily Support (Long-Term Entry)
Major macro base. Attractive for longer-term positioning.
Stop-loss: $34.16
🔼 Resistance Levels:
Near-term resistance: $41.50
Break above → opens path toward $42.20 and $43.00.
🧭 Outlook
Bullish Case: Consolidation above $41.00 + breakout past $41.50 → continuation to $42+.
Bearish Case: Failure of $39.87 → correction into $37.22 or $34.76 before renewed demand.
Bias: Bullish while above $39.87 and trendline remains intact.
🌍 Fundamental Insight
Silver benefits from a dual role: a precious metal hedge against monetary easing and a key industrial input.
Bullish tailwind: Bearish U.S. rate news has weakened the dollar, lifting silver alongside gold.
Caution: Stronger-than-expected USD rebounds or risk-on sentiment could trigger pullbacks.
✅ Conclusion
XAGUSD remains in a bullish structure above $41.00, with demand stacked across multiple support zones. A break above $41.50 confirms continuation toward higher levels, while pullbacks into $39.87 or $37.22 offer attractive long setups.
⚠️ Disclaimer
This analysis is for educational purposes only and does not constitute financial, investment, or trading advice.

XAG/USD 1-Day Candle Trading PlanThis plan suggests a strategy of buying at the support level (38.687 USD) , aiming for a profit target at 41.222 USD, with a stop loss at 37.647 USD to manage risk.

XAGUSD upside target 42.00On the 4-hour chart, XAGUSD is trading within an upward trend channel, with a bullish trend prevailing. Currently, the market has stabilized after retracing to support near 40.70, with an upward target of around 42.00.

Silver to $48 very soonIt's going to $48 very soon following gold momentum. It could spike to $70 within 2 months (once in every 30 yrs silver spike). If you want to make a life changing moment, now it's the time. I long SLV ETF since low $30.

SILVER: Strong Bearish Sentiment! Short!
My dear friends,
Today we will analyse SILVER together☺️
The recent price action suggests a shift in mid-term momentum. A break below the current local range around 40.925 will confirm the new direction downwards with the target being the next key level of 40.796 and a reconvened placement of a stop-loss beyond the range.
❤️Sending you lots of Love and Hugs❤️

XAGUSD sell needed.Even if the main trend is bullish, it needs to go down at least till thursday morning, before to continue growing.
Step by step.
blessings.
thks.
Trading balanceTrading balance The price of the asset has rebounded from the balance zone. With the prospect of growth into the resistance zone.

Silver Pullback Ahead? A Buying Opportunity in the MakingSilver is in an uptrend channel both in the short term and the medium term. Significant bullish pressure is coming from gold, rising technology investment that boosts demand for silver, persistent inflation risks, and the Fed being on the verge of cutting rates. Fundamentally, everything supports silver, and upward pressure is likely to continue.
However, in the short term, upward momentum has started to ease despite the push from gold, which could be an early signal of a small correction. The upward move is still expected to continue, but if the green trendline and the 40.50 support both fail, there is a zone between 39.10 and 40.50 with previous low trading volume that could be filled by a selloff. Such low-volume zones often behave similarly to gaps, though not always.
In either case, silver has stronger potential over the medium term, and any sudden selloffs are likely to remain buying opportunities.

SILVER Will Go Up! Long!
Here is our detailed technical review for SILVER.
Time Frame: 1h
Current Trend: Bullish
Sentiment: Oversold (based on 7-period RSI)
Forecast: Bullish
The market is on a crucial zone of demand 4,131.3.
The oversold market condition in a combination with key structure gives us a relatively strong bullish signal with goal 4,170.3 level.
P.S
Overbought describes a period of time where there has been a significant and consistent upward move in price over a period of time without much pullback.
Disclosure: I am part of Trade Nation's Influencer program and receive a monthly fee for using their TradingView charts in my analysis.
Like and subscribe and comment my ideas if you enjoy them!

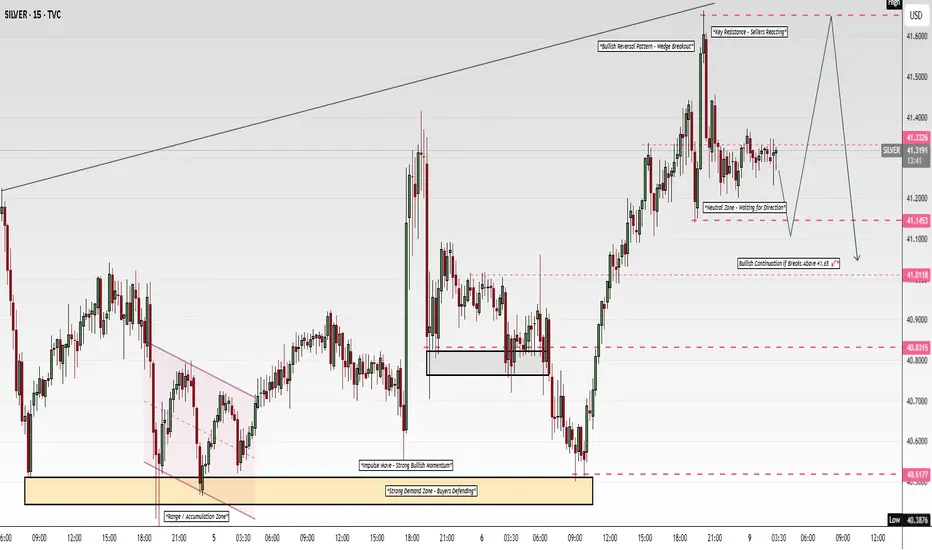
SILVER 15m – Key Resistance Test | PULLBACK/CORRECTION PENDINGFOREXCOM:XAGUSD
📊 SILVER 15m – Key Resistance Test ⚡
Structure | Trend | Key Reaction Zones
Silver rejected at 41.65 (key resistance). Buyers are active from 41.00–41.15, but a breakout above 41.65 is needed for further continuation.
Market Overview
The market is consolidating near resistance. A push above 41.65 could extend gains, but failure will drag price back to demand zones near 41.00 and below.
Key Scenarios
✅ Bullish Case 🚀
Target 1: 41.45
Target 2: 41.65
Target 3: 41.90 – 42.00
Stop Loss: Below 41.00
❌ Bearish Case 📉
Target 1: 41.15
Target 2: 41.00
Target 3: 40.52
Stop Loss: Above 41.65
Current Levels to Watch
Resistance 🔴: 41.65
Support 🟢: 41.15 – 41.00
⚠️ Disclaimer: This analysis is for educational purposes only. Not financial advice.

XAGUSD SELL IDEAI’m looking forward to selling XAGUSD(silver) as price resisted around 41.500 my expected take profit level is 40.500. One can sell from the current market price. It has a good probability to drop.
