SILVER: The Market Is Looking Down! Short!
My dear friends,
Today we will analyse SILVER together☺️
The market is at an inflection zone and price has now reached an area around 48.240 where previous reversals or breakouts have occurred.And a price reaction that we are seeing on multiple timeframes here could signal the next move down so we can enter on confirmation, and target the next key level of 47.777.Stop-loss is recommended beyond the inflection zone.
❤️Sending you lots of Love and Hugs❤️
Trade ideas

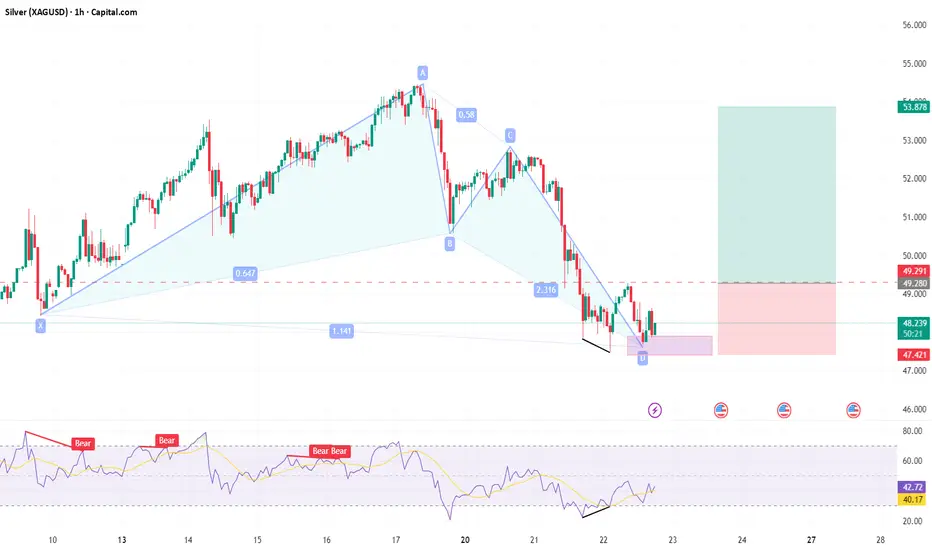
XAGUSD Bullish Reversal Harmonic PatternXAGUSD Completed XABCD pattern indicating the PRZ supported by bullish divergence. Strong reversal expected from this zone. Entry at the breakout of LH.
SILVER Is Bearish! Short!
Please, check our technical outlook for SILVER.
Time Frame: 1D
Current Trend: Bearish
Sentiment: Overbought (based on 7-period RSI)
Forecast: Bearish
The market is trading around a solid horizontal structure 4,794.2.
The above observations make me that the market will inevitably achieve 4,123.0 level.
P.S
The term oversold refers to a condition where an asset has traded lower in price and has the potential for a price bounce.
Overbought refers to market scenarios where the instrument is traded considerably higher than its fair value. Overvaluation is caused by market sentiments when there is positive news.
Like and subscribe and comment my ideas if you enjoy them!

XAGUSD 22 octI’ve identified a cup and handle pattern in silver, which is a bullish signal as it has already broken out. Based on the projection of this cup and handle pattern, we could see silver reaching a price range of 78-90 in the coming months. This outlook is supported by the current market situation, where gold prices are already high and the limited supply of gold, driven by massive physical gold buying recently, is making silver an attractive alternative for hedging.

SILVER BULLS WILL DOMINATE THE MARKET|LONG
SILVER SIGNAL
Trade Direction: long
Entry Level: 4,960.5
Target Level: 5,379.0
Stop Loss: 4,680.9
RISK PROFILE
Risk level: medium
Suggested risk: 1%
Timeframe: 9h
Disclosure: I am part of Trade Nation's Influencer program and receive a monthly fee for using their TradingView charts in my analysis.
✅LIKE AND COMMENT MY IDEAS✅

Silver (XAGUSD) Setup — VWAP & Volume Profile Trade PlanXAGUSD Silver is in a strong bullish trend on the higher timeframes, but we’ve seen an aggressive short-term reversal 🔁. I’m using VWAP and Volume Profile to help plan my trade and identify value/support areas 📊.
If price remains above VWAP and shows support from the volume profile, I’ll look for a long opportunity — otherwise I’ll stay flat and wait for confirmation 🚦. Everything’s explained clearly in the video.
⚠️ Disclaimer: This is for educational purposes only and not financial advice.

Stop!Loss|Market View: SILVER🙌 Stop!Loss team welcomes you❗️
In this post, we're going to talk about the near-term outlook for SILVER ☝️
Potential trade setup:
🔔Entry level: 46.91212
💰TP: 41.26205
⛔️SL: 50.07903
"Market View" - a brief analysis of trading instruments, covering the most important aspects of the FOREX market.
👇 In the comments 👇 you can type the trading instrument you'd like to analyze, and we'll talk about it in our next posts.
💬 Description: Metals have fixed intraday decline records early this week. For now, the likelihood of continued declines is higher, and a reversal is more likely. A strong factor for continued declines in silver would be the formation of an accumulation between levels 47 and 48. In this case, a drop to level 38 could be expected. The declines in metals are explained with profit-taking, thereby strengthening the USD.
Thanks for your support 🚀
Profits for all ✅
❗️ Updates on this idea can be found below 👇

long on XAGUSD. Silver tap into weekly fvg and and after that taking previous day liquidity and after that failed 4 hour bearish fvg. So market into ullish mood.

mrmoney limited XAG/USD swing trading ideaprice formed a range demand zone which will aid price for its bullish trends

XAGUSD retreated from recent highs. Could we see a rebound here?Silver prices fell, posting their steepest daily drop since 2021, as profit-taking and a firmer US dollar weighed on the market. The ongoing US government shutdown has created a data vacuum, limiting insight into trader positions in silver futures. Despite the short-term pullback, long-term fundamentals remain supportive, driven by strong industrial demand and potential Fed easing. In the near term, US dollar strength and stabilizing Treasury yields may cap silver's upside.
XAGUS is testing support at 48.00, which coincides with the 38.2% Fibonacci Retracement. A rebound above this level may prompt prices to retest the swing high at 54.20 and the 161.8% Fibonacci Extension. If XAGUSD breaks the 54.20 resistance, the price may resume its uptrend and approach the psychological level at 60.00. Conversely, closing below 48.00 may prompt a deeper retracement toward the following support and channel's breakout zone at 45.00.
By Li Xing Gan, Financial Markets Strategist Consultant to Exness

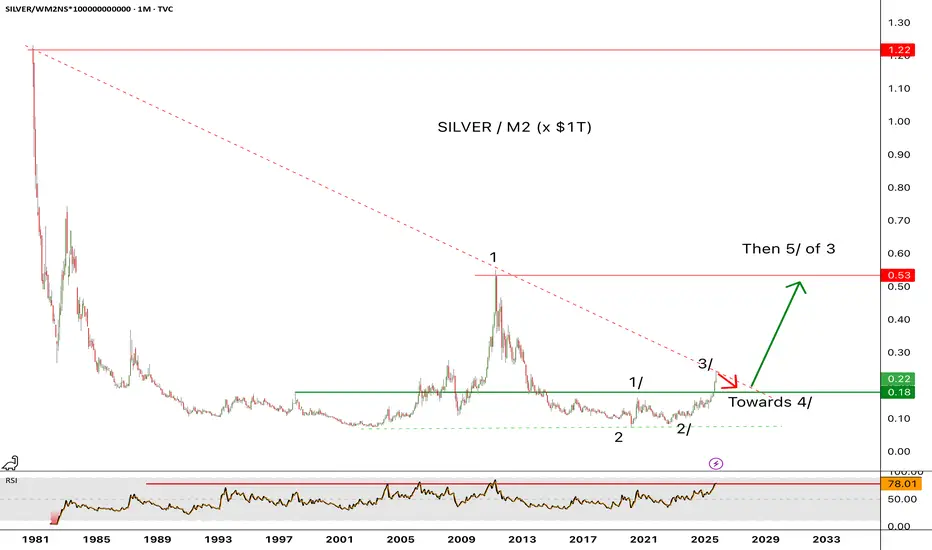
The ratio of Silver / M2 reached an important resistanceThe ratio of Silver / M2 (x$1T) has reached an important resistance last Thursday. It also reached rare overbought condition (see the monthly RSI14 at the 78 resistance area). It is now due for a consolidation phase, support seen near 0.18 (implying a pullback of about 18% to $44 from the recent high of $54 on silver. This could take a few months (normally, but who knows) before exploding above the down trend line towards the 0.53 area. In summary, the rise of silver has just started.
SILVER XAGUSD THE price of silver took correction along side GOLD ,dollar index rebound sent gold and SILVER sell off.
layer by layer.
#silver #xagusd #dollar #us10y

Silver Squeeze – Risk Reversals and Dollar Strength Sets InSilver has broken lower after recent highs, with the much-anticipated “silver squeeze” losing momentum. The market is now facing renewed pressure from a stronger U.S. dollar and broad risk-off sentiment, as investors trim exposure to commodities and metals.
The weekly close will be crucial — a bearish candlestick could confirm further downside potential, opening the door toward the USD 40.00 area, a key technical support zone.
Several factors are currently weighing on Silver:
- DXY rebound: The U.S. Dollar Index has bounced from support, attracting safe-haven demand and pressuring metals.
- Higher real yields: As inflation expectations ease, rising real yields make precious metals less attractive.
- ETF outflows: Institutional investors are trimming Silver ETF holdings, reducing speculative support.
- Weakness in industrial metals: A slowdown in China’s manufacturing sector is dragging down sentiment for Silver, which also has industrial demand.
- Technical exhaustion: After repeated tests of the USD 53.00 zone, momentum faded, and a breakdown below short-term moving averages confirmed a shift in tone.
If the current move continues, Silver could test USD 40.00 in the coming sessions. Only a decisive recovery above USD 52.00 would ease the short-term bearish outlook.

Pullback to 47 range then up in my opinionThis sell off is a perfect chance to add to your silver physical and miners...I think the pb will hit be to around $47 where it should find support. It could to down to the $44-$45 range but I think that would be the max for this pull back...good luck to all.
Silver (XAG/USD) Outlook: Bearish Momentum Dominates Amid CorrecSilver (XAG/USD) Outlook: Bearish Momentum Dominates Amid Correction
Silver prices have experienced a sharp decline today, dropping over 4.8% to hover around $49.88 after opening near $52.40. This pullback follows a recent surge that pushed the metal to all-time highs above $54 last week, driven by safe-haven demand and dovish Federal Reserve signals. However, profit-taking and reduced geopolitical tensions appear to be spurring the current reversal, with technical indicators pointing to further downside potential in the short term.
Key factors influencing today's movement include:
- **Technical Breakdown**: The price has broken below a short-term ascending channel and key support at $50, signaling a shift from the prior bullish trend. Resistance now sits at $50.25–$51.50, while immediate support levels are at $49.20, with deeper targets around $47.50–$48 if selling pressure persists. A close below $49.80 could accelerate declines toward $45.50–$46 in the coming sessions. Overbought conditions from the rapid rally—evident in indicators like RSI dipping below 50 and a bearish MACD crossover—support this corrective phase.
- **Market Sentiment**: Real-time trader discussions highlight expectations of a multi-week correction after the historic bull run, with some eyeing a retest of $45 before any resumption of upside. Broader risk-off flows, including softer equity markets and a strengthening USD, are adding headwinds, though upcoming US economic data like the Leading Index could provide minor relief if it surprises positively.
- **Fundamental Context**: While long-term drivers like industrial demand (e.g., in solar and electronics) and inflation hedges remain intact, near-term forecasts suggest easing from peaks. Analyst views lean bearish for the session, with overall ratings classifying the pair as a "Strong Sell" based on moving averages and oscillators.
For the remainder of October 21, 2025, the direction appears downward, with potential for continued selling unless a rebound above $50 materializes by close. Traders should monitor for volatility around support zones, as a failure to hold could extend losses, while a false breakdown might trigger a quick recovery to $51–$52.

XAGUSD - Signal#XAGUSD - Signal
H4 - Formation of the 3rd wave + breakout of the trend line. Stop behind the high of the 2nd wave.
Entry: 48.19986
TP: 47.19755 - 46.35812 - 44.82284 - 43.16576
Stop: 49.15511

SILVER USDHI GUYS,
CORRECTION AND UPDATE ON SILVER TECHNICAL
We are bullishly moving through the SIGNAL BOX H8,H4,H6.

SILVER: Strong Bullish Sentiment! Long!
My dear friends,
Today we will analyse SILVER together☺️
The price is near a wide key level
and the pair is approaching a significant decision level of 48.723 Therefore, a strong bullish reaction here could determine the next move up.We will watch for a confirmation candle, and then target the next key level of 49.015.Recommend Stop-loss is beyond the current level.
❤️Sending you lots of Love and Hugs❤️

Long-Term Silver Analysis with 100% SensitivitySilver has shown a strong and steady upward trend with no major price drops. This reflects growing industrial demand, investor confidence, and the metal’s unique position as both a precious and industrial asset. So far, this analysis has proven to be the most accurate and successful among long-term forecasts.
Sasha charkhchian

Silver - 6-month analysis and resultsThe strength of the price movement in silver has continued to increase since the 6-month analysis was sent for it, because this price analysis was done at the stop of the price movement, and with this increase in the price of silver and all metals in the financial markets, the price will increase.
Sasha Charkhchian

Silver sideways consolidation capped at 4980Silver remains in a bullish trend, with recent price action showing signs of a corrective pullback within the broader uptrend.
Support Zone: 4737 – a key level from previous consolidation. Price is currently testing or approaching this level.
A bullish rebound from 4737 would confirm ongoing upside momentum, with potential targets at:
4980 – initial resistance
5066 – psychological and structural level
5166 – extended resistance on the longer-term chart
Bearish Scenario:
A confirmed break and daily close below 4737 would weaken the bullish outlook and suggest deeper downside risk toward:
4667 – minor support
4600 – stronger support and potential demand zone
Outlook:
Bullish bias remains intact while the silver holds above 4737. A sustained break below this level could shift momentum to the downside in the short term.
This communication is for informational purposes only and should not be viewed as any form of recommendation as to a particular course of action or as investment advice. It is not intended as an offer or solicitation for the purchase or sale of any financial instrument or as an official confirmation of any transaction. Opinions, estimates and assumptions expressed herein are made as of the date of this communication and are subject to change without notice. This communication has been prepared based upon information, including market prices, data and other information, believed to be reliable; however, Trade Nation does not warrant its completeness or accuracy. All market prices and market data contained in or attached to this communication are indicative and subject to change without notice.

XAGUSDThe 49-49.5 level seems to be a very strong resistance for silver... After the structure changes from bullish to bearish, clear targets are available in the picture.

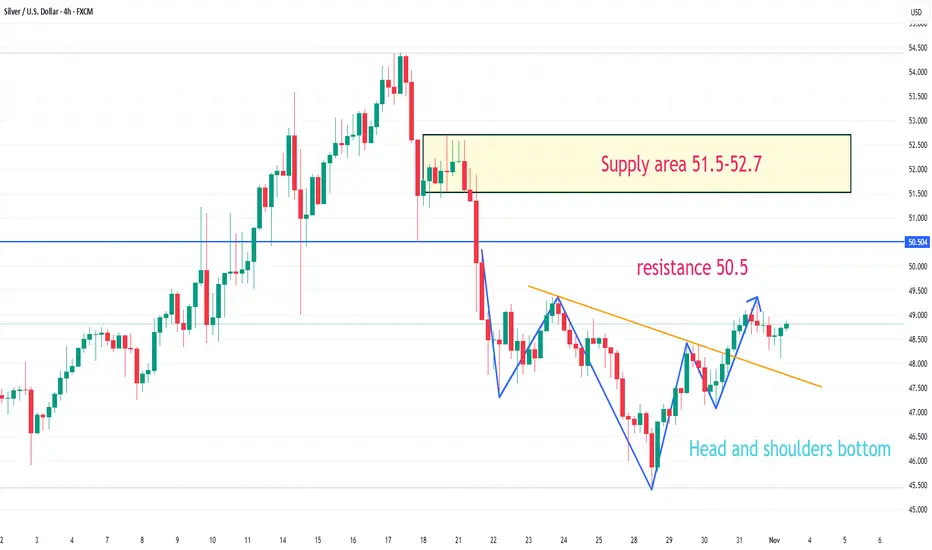
XAGUSD has formed a head and shoulders bottom patternOn the 4-hour chart, XAGUSD has formed a head and shoulders bottom pattern. Currently, watch for resistance around 49.4; a break above this level could lead to further upward movement, with resistance around 50.5, and further upside potential in the 51.5-52.7 area after that.