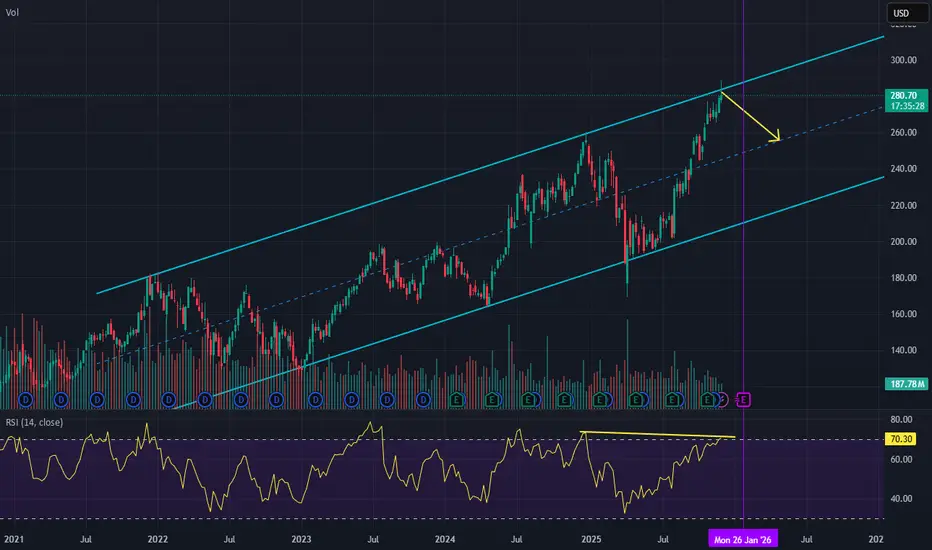
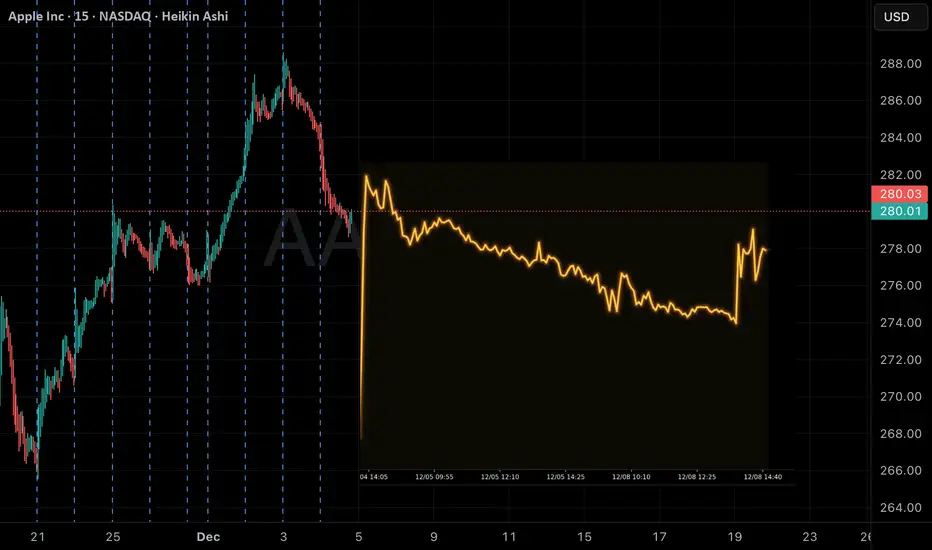
APPLE Just formed its Cycle Top. Best sell opportunity is here.Almost 3 months ago (September 19, see chart below), we gave a buy signal on Apple Inc. (AAPL), which recently hit our final $290 Target:
This week we go back to the long-term 1W time-frame as the Bullish Leg (green) since the April 07 bottom just hit the top (Higher Highs trend-line) of its 4-year Channel Up.
The 2023 Bullish Leg also peaked on its 1.236 Fibonacci extension and eventually corrected back to its 1W MA50 (blue trend-line), hitting its 0.382 Fibonacci retracement level at the same time. The 2022 and early 2025 Bearish Legs even broke below the 1W MA50 and bottomed after a minimum -32.05% decline. The April 2025 bottom even hit the 1W MA200 (orange trend-line).
All of those Channel Up (Cycle) Tops have taken place while the 1W RSI broke above the overbought level (70.00). This has already taken place since last week and we also se the 1W MACD to start reversing, which is something that has also happened every time after a Top.
Based on all the above evidence (1.236 Fib hit, Channel Up top hit, 1W RSI overbought, 1W MACD reversing), we expect Apple to start a long-term correction (Bear Cycle), technically the new Bearish Leg of the 4-year Channel Up and initially make contact with the 1W MA50 and the 0.382 Fibonacci retracement level at $236.00. If the price closes a 1W candle below the 1W MA50, then we expect a second Target to be fulfilled at the bottom of the Channel Up at $200, below the 1W MA200 but still almost -32.00% from the top.
The most efficient long-term buy signal is perhaps given by the 1W RSI again, when it hits the 33.20 Support. Use that to time your buy entry accordingly.
---
** Please LIKE 👍, FOLLOW ✅, SHARE 🙌 and COMMENT ✍ if you enjoy this idea! Also share your ideas and charts in the comments section below! This is best way to keep it relevant, support us, keep the content here free and allow the idea to reach as many people as possible. **
---
💸💸💸💸💸💸
👇 👇 👇 👇 👇 👇
Apple Inc
No trades
Trade ideas

Apple - This stock will collapse!🥊Apple ( NASDAQ:AAPL ) is reversing right now:
🔎Analysis summary:
Starting back five years ago, Apple established a major rising channel pattern. Following this channel, Apple recently created a textbook +40% move higher. But with the current retest of resistance, we will certainly see another pullback of -30% in the near future.
📝Levels to watch:
$250
SwingTraderPhil
SwingTrading.Simplified. | Investing.Simplified. | #LONGTERMVISION

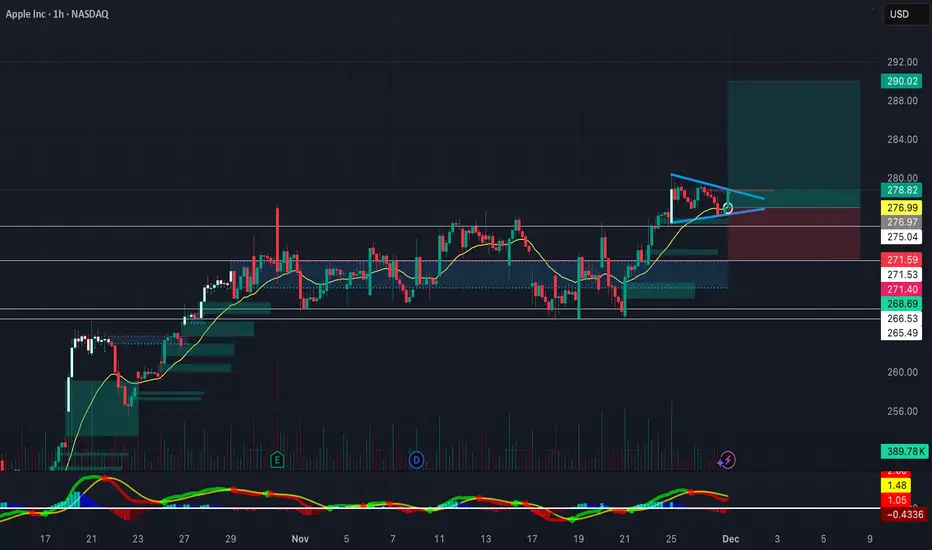
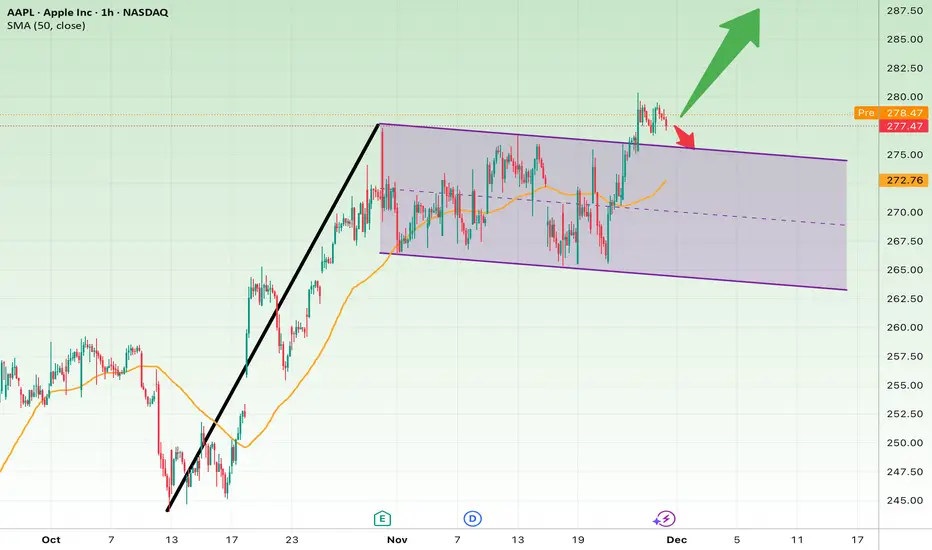
AAPL – Dec 10 OutlookKey Levels Tighten as Price Compresses Inside a Falling Wedge
AAPL has been slowly compressing inside a clean falling wedge on both the 1H and 15M charts. Each bounce is getting weaker, but sellers haven’t fully broken the structure yet — they’re defending every lower-high while buyers continue holding that wedge support line. This usually doesn’t last long; wedges like this resolve with a sharp move once liquidity is taken from one side.
The 1H chart shows the wedge narrowing into a decision zone right under $278–280, which is also where the micro supply block sits. That area remains the line in the sand for bulls. If they can’t reclaim it, AAPL stays on the defensive.
On the 15M, BOS and CHoCH levels line up cleanly with where liquidity was swept earlier today. Price keeps reacting to that mid-zone demand but isn’t showing strength — more like it’s floating until a real catalyst shows up.
GEX levels confirm the idea:
$280 → Major Call Wall, heavy resistance where dealers hedge against upside breakouts.
Below, the $272–273 zone lines up with PUT support — if the wedge breaks down, that area becomes the magnet.
My view right now is simple: AAPL is coiling for its move. As long as the wedge support holds, you may still get an upside test toward $280. But if sellers crack $276 and push momentum down, the unwind toward $273 opens fast.
This is one of those setups where you just let price show its hand — no need to force anything in the middle of the wedge. Let liquidity get taken first.
Disclaimer:
This analysis is for educational purposes only and not financial advice. Trade your own plan and manage your risk.

let's buy appleMy analysis is purely technical, supported by multiple factors:
1) We've been within an ascending channel for several months now, specifically since August. This gives us a sense of the market's general trend and allows us to identify potential retracement zones.
2) Subsequently, we can observe a descending structural pattern between October 29th and November 25th, which we can consider an accumulation zone, given the previous bullish performance in the preceding months.
3) The accumulation just described has been stopped numerous times in a specific zone that we consider resistance deriving from a psychological round number (275.00), the area described and the area colored purple.
4) As we can see, our accumulation zone has been broken upward, significantly increasing trading volumes and confirming the breakout.
5) This breakout has continued the momentum started by the November 21 candlestick until the end of the December 3 impulse. This causes a huge imbalance between buyers and sellers.
6) In my opinion, this equilibrium will be restored once a retracement of approximately 61.8% (from the Fibonacci retracement level) is made from the impulse described previously, which coincidentally is in the same zone as the psychological round number, both at the bottom of the main channel and as the last point at the top of the accumulation zone.

APPLE The Target Is DOWN! SELL!
My dear subscribers,
This is my opinion on the APPLE next move:
The instrument tests an important psychological level 278.82
Bias - Bearish
Technical Indicators: Supper Trend gives a precise Bearish signal, while Pivot Point HL predicts price changes and potential reversals in the market.
Target - 274.28
About Used Indicators:
On the subsequent day, trading above the pivot point is thought to indicate ongoing bullish sentiment, while trading below the pivot point indicates bearish sentiment.
Disclosure: I am part of Trade Nation's Influencer program and receive a monthly fee for using their TradingView charts in my analysis.
———————————
WISH YOU ALL LUCK

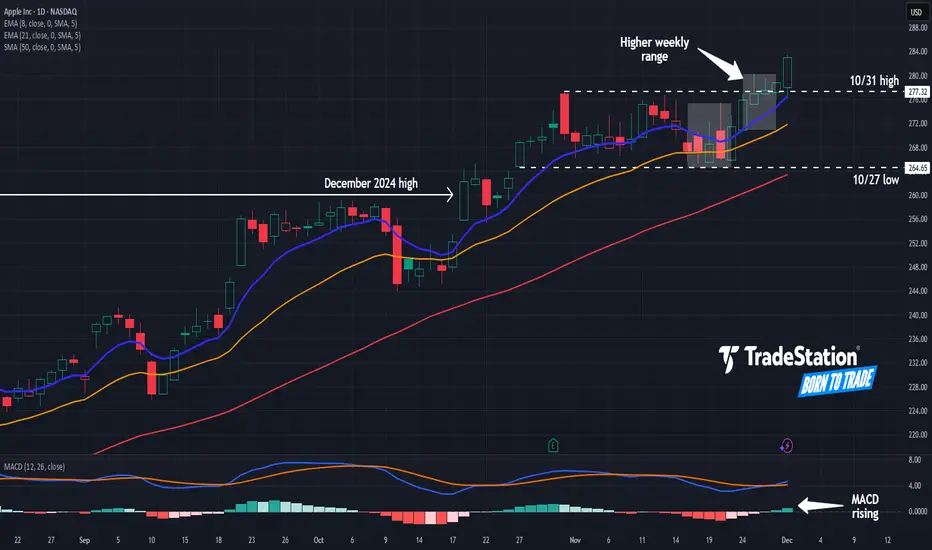
Apple May Be AcceleratingApple spent November quietly consolidating, and it may be accelerating in December.
The first pattern on today’s chart is the $260.10 level, a previous all-time high from December 2024. AAPL crossed above that price in late October and has remained there since, which could mean old resistance has broken.
Second, the smartphone giant made a weekly low of $264.65 on October 27. It’s remained above that level since. That may suggest that new support has been established.
Third, last week’s range featured a higher high and a higher low relative to the previous week. The stock also closed above a previous high of $277.32 from October 31.
Such price action is potentially consistent with a gradual breakout.
Next, the stock is above its 50-day simple moving average and its 8-day exponential moving average (EMA) is above its 21-day EMA. MACD is also rising. Those signals may reflect a bullish trend.
Finally, AAPL is a highly active underlier in the options market. (Its average daily volume of 808,100 contracts ranks fifth in the S&P 500, according to TradeStation data.) That may help traders take positions with calls and puts.
TradeStation has, for decades, advanced the trading industry, providing access to stocks, options and futures. If you're born to trade, we could be for you. See our Overview for more.
Past performance, whether actual or indicated by historical tests of strategies, is no guarantee of future performance or success. There is a possibility that you may sustain a loss equal to or greater than your entire investment regardless of which asset class you trade (equities, options or futures); therefore, you should not invest or risk money that you cannot afford to lose. Online trading is not suitable for all investors. View the document titled Characteristics and Risks of Standardized Options at www.TradeStation.com . Before trading any asset class, customers must read the relevant risk disclosure statements on www.TradeStation.com . System access and trade placement and execution may be delayed or fail due to market volatility and volume, quote delays, system and software errors, Internet traffic, outages and other factors.
Securities and futures trading is offered to self-directed customers by TradeStation Securities, Inc., a broker-dealer registered with the Securities and Exchange Commission and a futures commission merchant licensed with the Commodity Futures Trading Commission). TradeStation Securities is a member of the Financial Industry Regulatory Authority, the National Futures Association, and a number of exchanges.
Options trading is not suitable for all investors. Your TradeStation Securities’ account application to trade options will be considered and approved or disapproved based on all relevant factors, including your trading experience. See www.TradeStation.com . Visit www.TradeStation.com for full details on the costs and fees associated with options.
Margin trading involves risks, and it is important that you fully understand those risks before trading on margin. The Margin Disclosure Statement outlines many of those risks, including that you can lose more funds than you deposit in your margin account; your brokerage firm can force the sale of securities in your account; your brokerage firm can sell your securities without contacting you; and you are not entitled to an extension of time on a margin call. Review the Margin Disclosure Statement at www.TradeStation.com .
TradeStation Securities, Inc. and TradeStation Technologies, Inc. are each wholly owned subsidiaries of TradeStation Group, Inc., both operating, and providing products and services, under the TradeStation brand and trademark. When applying for, or purchasing, accounts, subscriptions, products and services, it is important that you know which company you will be dealing with. Visit www.TradeStation.com for further important information explaining what this means.
AAPL FlaggingNASDAQ:AAPL Flagging on the hourly, bouncing right off the 20-day EMA, expecting a push upwards to 280. If bulls can hold 280, looking for a move to the 286+ area. Watching this setup closely for a swing. Until then, some RSI-based supply and demand zones to keep an eye on, watching closely
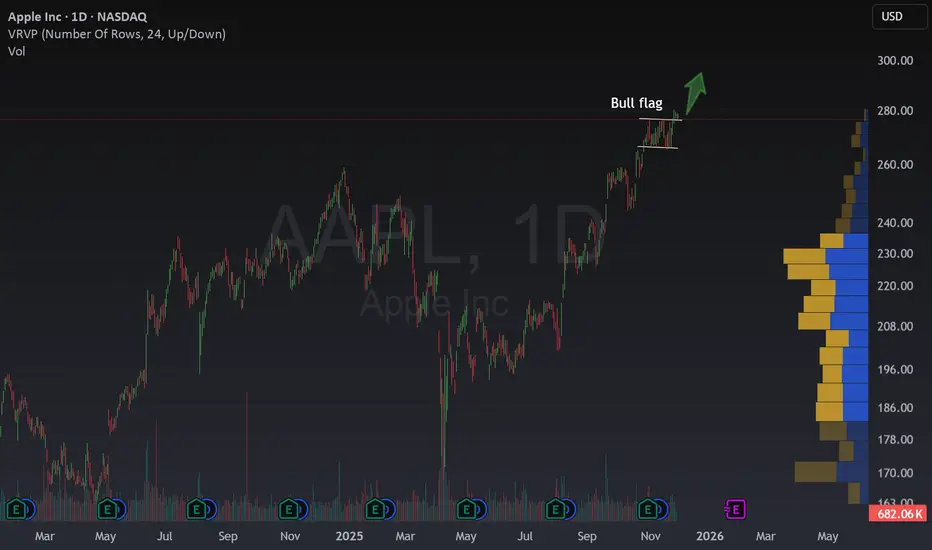
How To Trade a Bull Flag and The AAPL OpportunityHow To Trade a Bull Flag and The AAPL Opportunity
Have you ever felt stuck waiting for the perfect trade?
Apple just gave us a rare gift. After a strong rally, the price stopped and drew two parallel lines, each with two clear touches. This is what we call a bull flag. It looks simple, but it means a lot.
What Does This Pattern Tell Us?
A bull flag warns us that the market paused to take profits . It is a sign the bulls are resting, but planning to push again .
We got confirmation!
Apple made new highs, breaking out in a surprising way. The price pulled back, giving careful traders a low-risk chance to join.
This rarely happens so quickly.
If price drops below the bull flag, that’s a mega bearish sign, and a stop-loss is a must .
Above , there’s no clear limit. If stats play out, the move could be 5% or more in just a few days.
Why Is This Setup Special?
This is not our first bull flag. Recently, NYSE:JNJ flashed one and rallied 7% fast.
NYSE:LLY had an even bigger run, jumping 27% in under a month , and it still hasn’t stopped.
Bull flags are really simple but rare. If you find one, wait for confirmation, manage risk, and be ready to act fast.
In my profile, you will find guides to spot and trade bull flags easily , turning tough moments into real opportunities.
AAPL 1-Month Projection: Low-Volatility Neutral PatternAAPL QuantSignals Katy 1M Prediction 2025-12-08
QuantSignals Katy AI Stock Analysis
Analyzed 1 stock(s): AAPL
AAPL Analysis
Current Price: $276.54
Final Prediction: $276.97 (+0.16%)
30min Target: $277.86 (+0.48%)
Trend: NEUTRAL
Confidence: 49.3%
Volatility: 5.7%
Summary: Generated 0 trade signals from 1 successful analyses out of 1 symbols.

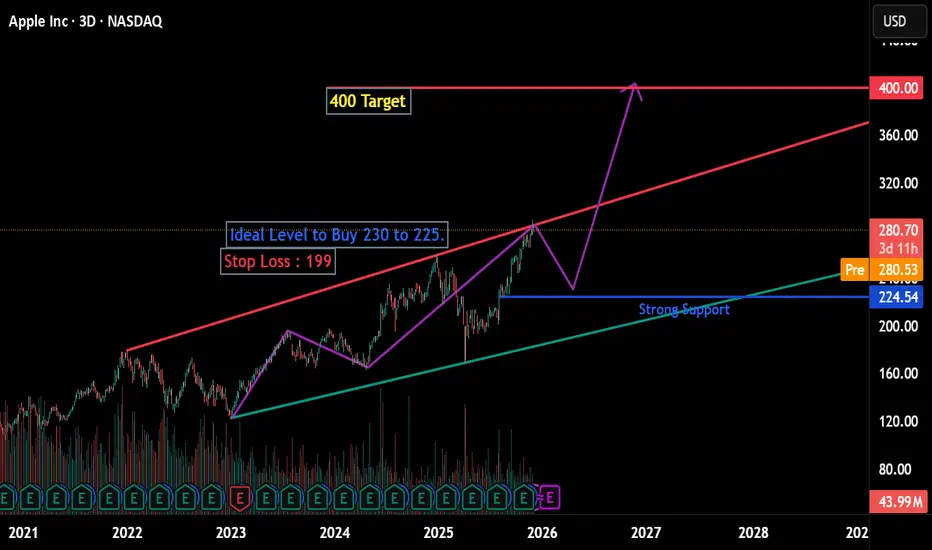
Apple : It is awaiting correctionCurrently it is at head to correction.
according to my chart reading.
ideal buy entry after correction to 225-230 if decline and come to those levels.
Target 400
SL : Below 199.
Manage your Risk .
I don't have anything to see to buy at current price.
And also I am not in favor of Short Sell.
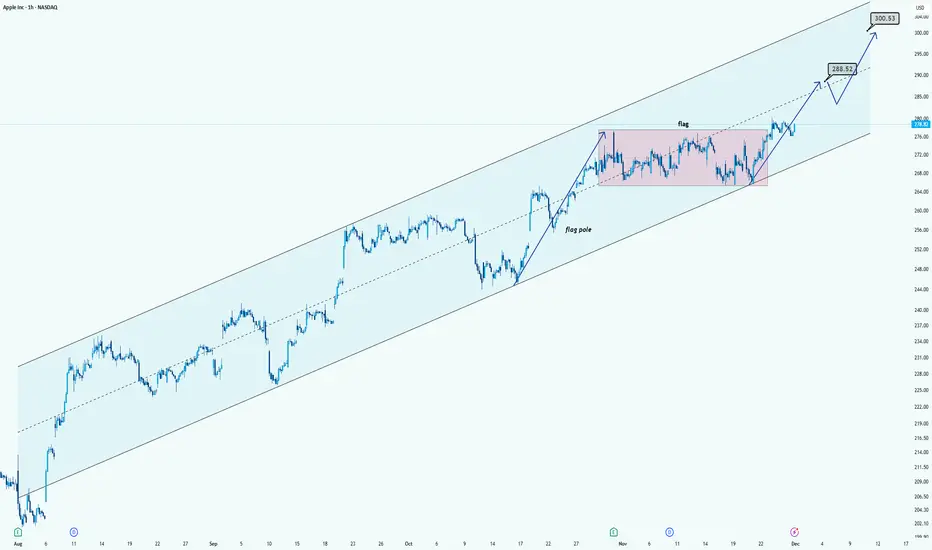
AAPL Chart AnalysisHi!
AAPL is trading inside a clean long-term ascending channel, showing a strong uptrend. Recently, the price formed a bullish flag (pink zone) after a sharp move up. The breakout above the flag signals continuation of the trend.
The chart projects two key upside levels:
$288.52 as the first target (flag breakout objective / mid-channel resistance)
$300.53 as the second target (upper channel boundary + psychological level)
As long as price stays above the flag range and respects the channel, the bullish structure remains intact.
I like AAPL for uncertain times -- long at 276.77First and foremost, I like AAPL here because the system I use likes AAPL here. It actually liked it 3 days ago, but I decided to wait and I'm glad I did because I'm getting a better deal here. I jumped in just before the end of the after hours session today because I couldn't wait any longer. The Fed meeting is a wild card tomorrow, but if the market rallies on it, i'd miss out if I waited. If it dumps, it'll just take longer to make my money. That's a risk/reward that favored going long today for me. I understand, though, why some would want to wait.
Since the beginning of the year, the 20 closed trades have netted a total of +41% on a stock that is up under 11% on the year. They've produced a per lot/day return of around 12 basis points, which is 3x the long term average return of SPY.
While AAPL struggled early in the year, it has gotten its footing and since mid summer has been a freight train chugging higher and higher as shown by that pretty little regression channel. It is trading above its 20, 50 and 200d MAs as well.
An underrated feature of AAPL in my opinion (although @matthias would take the opposite position, I think) is that they have a huge pile of cash. They are holding over $100B in cash and marketable securities right now. While long term, I'd rather have that cash be used to innovate, I do not like the looks of the economy right now, and I think that AAPL's huge cash hoard gives them a cushion that a lot of other stocks don't have right now. I like that safety.
If Chairman Powell can manage to not rattle the markets tomorrow with hawkish rhetoric, and if Trump can keep his little fingers from typing out threats against Fed independence if Powell doesn't lower rates (doubtful), I think this could be a quick turnaround trade, as AAPL is already down 5 days in a row (though that's not terribly unusual for AAPL).
If the trade isn't a quick one, I am as always, not averse to adding to my position and tactically taking profits while waiting for the original lot to make its curtain call.
As always - this is intended as "edutainment" and my perspective on what I am or would be doing, not a recommendation for you to buy or sell. Act accordingly and invest at your own risk. DYOR and only make investments that make good financial sense for you in your current situation.
BTW - ignore the pink arrows on the chart, those are part of something I'm working on and it was too cumbersome to go hide them all. Also, the green arrow is simply for my use in determining YTD return of the stock quickly. Ignore that, too. Also, I mistyped in the text box on the chart and I can't fix that. The average return per trade is 1.98%, not 1.94%. Not a big difference, but I like to be accurate. Sorry for that error.
Hitting Channel CeilingPotential downside? APPL is at the top of the range of an ascending channel, with bearish divergence forming in the RSI. Expected pull-back price to be $250s zone.
NOTE: We also have earnings in that period of time, which could further affect price action.
AAPL Alert: High-Risk Short & Explosive Call Opportunities This AAPL Weekly Signals | 2025-12-04
Short-Term Speculative PUT (2-Day Expiry)
Direction: PUT (Short)
Strike: $265.00
Entry: $0.03
Target 1 / 2: $0.05 / $0.08
Stop Loss: $0.01
Confidence: 56% (Low / Speculative)
Momentum: Neutral, bearish bias (-0.02% 1W)
Flow: Bearish, PCR 1.76
Risk: High – very small position (1% max) recommended
Notes: Katy AI shows 71% prediction points below current price, overriding weekly “BUY CALLS” guidance. High gamma risk.
Medium-Term CALL (8-Day Expiry)
Direction: CALL (Long)
Strike: $280.00
Entry: $3.30
Target 1 / 2: $5.00 / $6.50
Stop Loss: $2.00
Confidence: 57% (Low)
Momentum: Neutral (-0.13% 1W), MACD bullish divergence
Flow: Neutral, PCR 0.81
Risk: Moderate – position size 2%
Notes: Katy AI shows consistent upward trajectory to $283–$285 range. Conflict with weekly momentum; tight stop recommended.
AAPL SELLERS WILL DOMINATE THE MARKET|SHORT
AAPL SIGNAL
Trade Direction: short
Entry Level: 278.86
Target Level: 262.87
Stop Loss: 289.53
RISK PROFILE
Risk level: medium
Suggested risk: 1%
Timeframe: 6h
Disclosure: I am part of Trade Nation's Influencer program and receive a monthly fee for using their TradingView charts in my analysis.
✅LIKE AND COMMENT MY IDEAS✅

AAPL — WEEK 49 TREND REPORTNASDAQ:AAPL — WEEK 49 TREND REPORT
Ticker: NASDAQ:AAPL — 12/02/2025 @ 286.19$
Timeframe: WEEKLY
This is a reactive structural classification of NASDAQ:AAPL based on the weekly chart as of this timestamp. Price conditions are evaluated as they stand — nothing here is predictive or forward-assumptive.
⸻
1) Current Trend Condition
• Trend Duration: +22 weeks (Bullish)
• Trend Reversal Level (Bearish): 265.7$
• Trend Reversal Level (Bearish Confirmation): 241.24$
• Pullback Support: 237.27$
⸻
2) Structure Health
• Retracement Phase:
Uptrend (operating above 78.6%)
• Position Status:
Healthy (price above both structural layers)
⸻
3) Temperature
Warming Phase
⸻
4) Momentum
Bullish
⸻
5) Market Sentiment
Bullish
⸻
Author’s Note
This analysis is fully reactive, not predictive. Market conditions, trend structure, and behavior are classified as they appear in real time. The objective is to identify where directional shifts first occurred, where structural integrity remains intact, and where it would begin to weaken if key levels were breached.
Predictive analysis projects outcomes that do not exist yet. Without price confirmation, prediction is built on baseless assumptions. This framework avoids that entirely by responding only to verified structural changes and live conditions.
The levels shown simply identify where the current trend structure first shifted and where it would begin to lose integrity if breached. Recognizing these boundaries allows for clearer interpretation of market behavior without relying on forward guarantees, speculative projections, or unsupported assumptions.
⸻
Methodology Overview
This classification framework evaluates directional conditions using internal trend-interpretation logic that references price behavior relative to its structural layers. These relationships are used to identify when price movement aligns with the framework’s criteria for directional phases, transition points, or regime shifts. Visual elements or structural labels reflect these internal interpretations, rather than explicit trading signals or preset indicator crossovers. This framework is observational only and does not imply future outcomes.

$AAPL to 300The given parallels indicate a rising channel chart pattern, with 7 points, bouncing at the 7th indicating an uptrend breakout, my opinion is bullish.

AAPL Breaks Out: Bull Flag Targets Point to $287–$295!After a strong rally (black trendline), AAPL entered a descending corrective channel, which looks like a classic bull flag pattern.
Now the price is breaking above the upper boundary of the channel, suggesting that the correction may be over.
Bullish Scenario (More likely now)
If the price holds above the channel, continuation upward is expected.
Bullish Targets:
• $282
• $287
• $295 (extended target)
Bearish Scenario (Failed breakout)
If price falls back inside the channel, the correction resumes.
Bearish Targets:
• $273
• $268
• $262 (major support)
Stop Loss
• Long: Below $274
• Short: Above $280.50
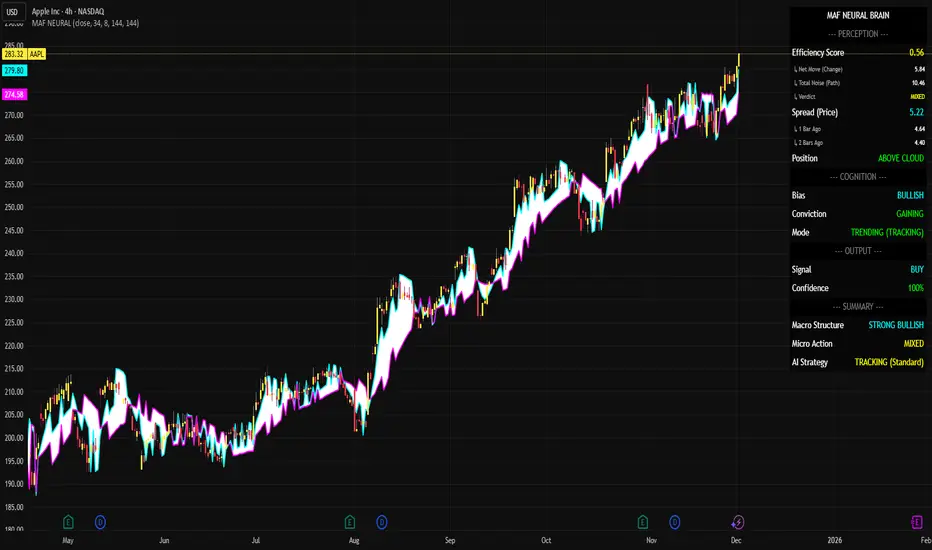
AAPL Listen to the "BRAIN"1. The "Breathing" Cloud (Changing Thickness)
The changing thickness of the White Cloud is the most important visual cue. Think of it as the "Lungs" of the Trend.
Expansion (Thickening Cloud):
What it means: The "Fast Core" (Cyan) is pulling away from the "Slow Core" (Magenta).
Analysis: This indicates Momentum Acceleration. The market is moving faster than its baseline. This is a "High Confidence" phase where you want to be aggressively holding or adding to positions.
On Chart: You can see massive expansions during the rallies (May, June, Oct). The cloud gets huge, signaling a "Power Trend".
Contraction (Thinning Cloud):
What it means: The cores are converging (pinching together).
Analysis: This indicates Momentum Deceleration or Consolidation. The market is "exhaling" or taking a rest.
On Chart: Notice how the cloud gets very thin before the trend either reverses or explodes again. A thin cloud is a "Decision Point".
2. Dashboard Analysis (The "Brain")
The Dashboard confirms what the Cloud is showing visually:
Spread (Price): 5.77: This is a Wide Spread.
Verdict: The trend is currently Expanded. It is not in a "compression" phase; it is in a "run" phase.
Efficiency Score: 0.56 (MIXED):
Verdict: While the trend is up, the price action isn't a straight line. It's a bit "choppy" or "grinding" (Mixed). It's not a "Clean Trend" (0.8+), but it's not "Noise" (<0.3) either.
AI Strategy: TRACKING (Standard):
Verdict: Because the trend is Strong (Wide Spread) but the action is Mixed, the AI decides the best course of action is simply to Track it. Don't get shaken out by the wiggles, but don't be too aggressive. Just trail your stop.
Summary
Current Status: STRONG BULLISH TREND. Action: HOLD. The Cloud is thick (High Momentum), and the Dashboard is signaling "Strong Bullish". Even though the Efficiency is "Mixed" (some minor chop), the sheer width of the cloud protects you from getting stopped out prematurely. Ride the expansion.
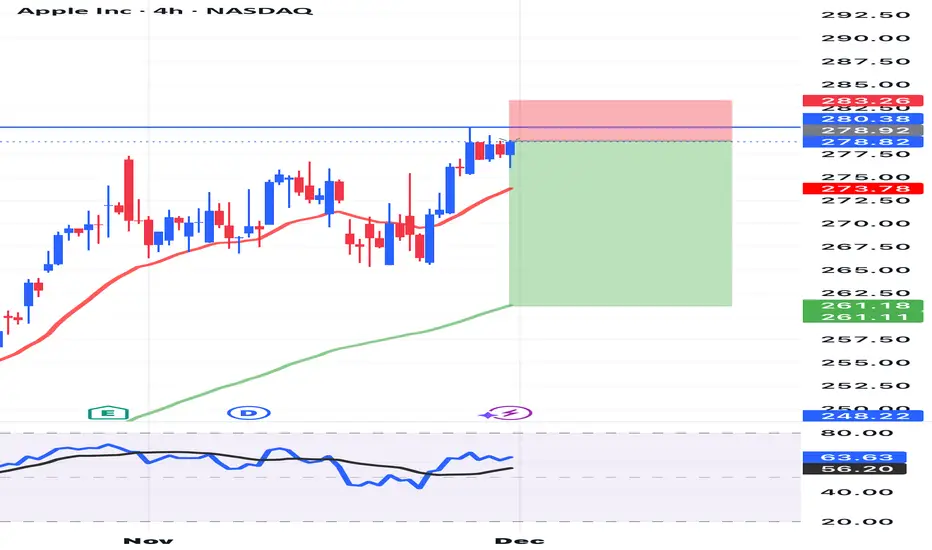
AAPL - Correction ahead?Bearish Scenario for AAPL (4H Analysis)
AAPL is currently trading at an extended level after a steep multi-week rally. The structure is forming a potential rising wedge, which typically signals trend exhaustion and an increased risk of a corrective move.
Key Breakdown Trigger
A confirmed break below 270 USD (4H close) would invalidate the current short-term uptrend and open the door for a deeper correction.
Downside Levels to Watch
260–262 USD
First major support zone. A retest here would be a normal pullback in the broader uptrend.
248–250 USD
Weekly orderblock + strong horizontal support.
If price reaches this zone, increased buying interest is likely — but if it fails, downside pressure accelerates.
237 USD
High-confluence structural level.
This is the most probable target in a more significant correction.
223–224 USD (Weekly Low)
Only relevant if the market enters a broader risk-off phase.
Bearish Confluence Factors
Sharp overextension from mid-trend support
Momentum weakening after parabolic move
Declining volume while making new highs
Rising wedge structure tightening
Summary
AAPL remains bullish on higher timeframes, but the risk of a larger corrective move is elevated. Losing 270 USD would likely trigger a multi-level retracement toward 260 → 250 → 237.

AAPLHow to become successful in forex and stock trading: 1.Master fundamentals and technical analysis. 2,Build and follow a solid trading plan. 3.Apply strict risk management (1–2% rule). 4.Stay disciplined—control fear and greed. 5.Record and analyze every trade. 6.Focus on high-quality setups only. 7.Diversify across assets and markets. 8.Keep evolving—study, adapt, and grow daily.
AAPL Outlook — Dec 1 to Dec 5AAPL Outlook — Dec 1 to Dec 5
(Price Action + Multi-Timeframe Story + GEX for Options Traders)
Weekly timeframe
The weekly chart still holds its long-term uptrend, but you can tell momentum is cooling off. The candles are getting smaller as price pushes toward the upper trendline, which usually means buyers are running into an area where profit-taking becomes more attractive. Nothing bearish yet—just a sign that the push is losing steam.
Daily timeframe
The daily view fits that slowdown perfectly. Price is sitting right inside a supply zone that was created during the last big push. Ever since AAPL entered this zone, the market hasn’t shown a strong follow-through candle. Instead, it’s been chopping inside 276–280.
The first little shift in character already appeared, which tells you sellers are at least testing the waters.
The weekly hints “momentum is fading,” and the daily basically confirms, “yes, we’re stuck under some pressure.”
1-Hour timeframe
Dropping into the 1H makes the battle more obvious. Price keeps rejecting the same ceiling near 279–280 again and again. Even though the trendline from below is still supporting the move, the highs are getting slightly lower each attempt. That’s usually the first sign that buyers are defending, but they’re not dominating anymore.
So now all three timeframes are telling the same story:
Uptrend intact → momentum slowing → pressure at the top.
15-Minute timeframe
The 15m chart is where you can really see how tight things have become.
Price is compressing right underneath that ceiling. Volume is tapering off, candles are getting smaller, and every bounce looks weaker than the last.
This kind of behavior usually means the market is coiling up for a move—either a clean breakout above 280 or a release to the downside if the base around 277.50 gives out.
The smaller the timeframe, the more it reveals what the bigger timeframes were already hinting.
Where GEX Fits Into All of This (the real edge)
Now here’s where everything clicks:
All timeframes point to the same resistance near 279–280.
When you overlay the options data, the biggest call wall also sits right there. That’s the level where dealers hedge the most aggressively, which naturally creates resistance—and it just so happens to line up with the zones that the charts have already shown.
Below that, the negative gamma area starts opening up around 276–274.
This means that if price slips under that base, dealers shift into selling hedges, which increases volatility and makes pullbacks move faster.
So the charts show the structure…
GEX shows the “fuel” behind the structure.
That’s why I like combining them: the price action tells the story, and GEX tells you who’s on the other side of the trade.
Trading Bias for the Week (Options + Price Action)
Upside idea
Only valid if 280 breaks clean. If that happens, the next magnet is around 282.5 where the next batch of calls cluster.
Downside idea
If 277.50 cracks, the move usually releases toward 276, then 274.
That lines up with both the lower timeframe CHoCH and the negative gamma pocket.
Final Thoughts
Each timeframe is showing the same thing, just in different levels of detail: the trend is still healthy, but buyers are clearly struggling at the top. GEX reinforces why price behaves that way and gives option traders the roadmap for the week.
Disclaimer:
This is not financial advice. This is just my personal market observation and for educational use only.

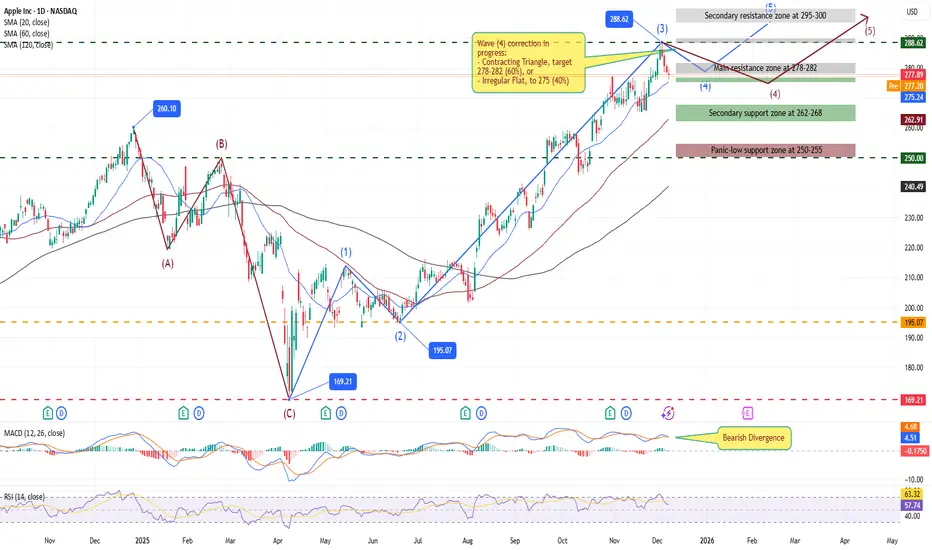
AAPL Elliott Wave Update: Wave 4 Triangle Nears Completion –$300AAPL Elliott Wave Update: Wave 4 Triangle Nears Completion – $300+ Wave 5 Targets Ahead
AAPL continues its bullish trajectory in a classic 5-wave impulse structure, originating from the April 2025 low of $169.21 following an ABC correction from late 2024 highs. This rally has delivered over 70% gains, confirming a higher-degree Wave ((5)) within the multi-year uptrend.
The impulse kicked off with Wave 1 surging to $213 (May high), followed by a shallow Wave 2 retracement to $195.07 (0.618 Fib), respecting the origin without overlap. Wave 3 then extended aggressively to $288.62 (December 3 high), measuring 1.618x Wave 1 and driving the strongest momentum since the blue-box low. Volume spiked during this extension, underscoring institutional buying.
We're now in Wave 4, a textbook sideways correction trading in the $276-282 range. Recent action suggests a Contracting Triangle (a-b-c-d-e pattern), with converging trendlines targeting a resolution near $277-282. Alternatively, an Irregular Flat could form if we probe $275 (0.382 Fib of Wave 3).
Bearish divergence on RSI (57.74) and MACD hints at waning momentum, but the 50-day SMA at $275.24 provides firm support. Critically, no overlap with Wave 1 high ($213) – a key invalidation level – keeps the structure intact.
Wave 5 targets align with Fib extensions: initial $290-293 (0.618 of Waves 1-3), standard $300-310 (1.0-1.618x). The parallel channel upper rail supports $305, fueled by AI tailwinds and upcoming Q1 earnings. Risk: Break below $270 channels a deeper pullback to $262, but VIX under 14 favors bulls.
Multi-month hold for longs above $275; add on triangle breakout with stops at $274. Structure remains bullish – Wave 5 could cap the year strong. What's your take?
Disclaimer: This analysis is for educational purposes only and is not investment advice. Please do your own research (DYOR) before making any trading decisions.