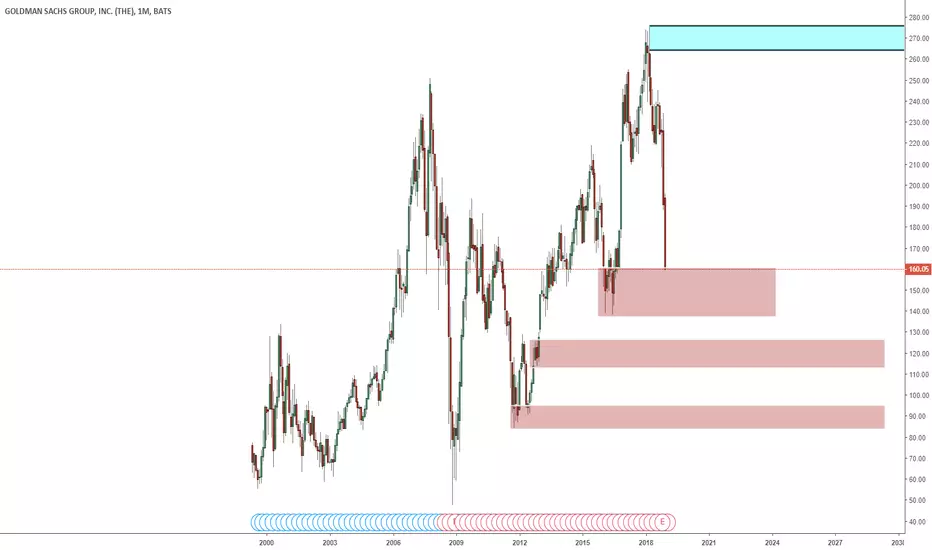
Global Growth Fears Goldman Sachs Prices have perfectly aligned itself with the Fib Ratio prices. As long as the price doesn't break above the Stop loss, I will be holding a Put.
Here is my Option Trade: (Keep in mind that I am not good at options, I just see good value here as a swing option trade)
GES $165 Put
EXP date: 2/22
I will be holding this option until days before the expiration date.
If I made you money, follow me !
GS trade ideas

Buy Goldman Sachs american stocks after hitting monthly demandGoldman Sachs GS american stock buy opportunities after reaching monthly demand level around 157. This monthly demand imbalance has gained control after a strong drop for a few months.
New weekly demand level is being create at $178 as a reaction to monthly demand level, shorts are not allowed on this stock. Long term long bias with bigger picture uptrend on all bigger timeframes. Very strong reaction on the monthly off that M demand level.
We don't really care what the fundamentals are saying about this american stock, we don't care if BlackRock and Goldman Sachs Asset Management both plan to temporarily move some British-based fund managers to New York in the event of a no-deal Brexit, two sources told Reuters. Or if neither of the firms, who together employ more than 10,000 people in London, expects a chaotic exit that would force them to carry out the emergency relocation, the sources said.
Goldman's asset management business GSAM, with 50 managers in London, has plans to send "a handful" to the U.S. financial capital until a framework is in place, the second source said, adding they too would eventually relocate to the euro zone.
Goldman Sachs has reached a bigger timeframe demand level, it's time to buy with a clear long term long bias, no need to pay attention to what the fundamentals are saying. Buy opportunities being created on weekly and daily imbalances on Goldman Sachs NYSE american stocks.


Looking at GS Option Strikes after big dayI'm looking at primary support and retracement levels as well as a shot at ascending at as sharp an angle as we descended in the last month-ish.
Strikes of interest to me:
$187.5 Put for 1/18 or 1/25
$215 Call for 1/25 or 2/1
$230 Call for Mar 1

Exploding into resistance after earningsGS is up 8% today following positive reports.
Notice the resistance zone that is waiting for GS between 200 and 210

Goldman Sachs: Bullish Call After Q4 Earnings AnnouncementGoldman Sachs (GS) and Bank of America delivered stronger-than-expected earnings results for the fourth quarter, sending the banks’ stocks higher.
Goldman reported fourth quarter adjusted earnings per share of $6.05, outpacing analysts’ estimates of $4.53. The firm posted revenue of $8.08 billion for the quarter, topping analysts’ forecasts of $7.54 billion.
"We are pleased with our performance for the year, achieving strong top and bottom line results despite a challenging backdrop for our market-making businesses in the second half," CEO David Solomon said in a statement.
Shares of Goldman spiked more than 4% in the pre-market.
However, Goldman’s fixed income trading posted a big miss, delivering revenue of $822 million, 18% lower than the fourth quarter of 2017. The firm said the results reflected “significantly lower net revenues in credit products and lower net revenues in interest rate products.”
Elsewhere in banking, Bank of America (BAC) reported record earnings on Wednesday, delivering adjusted earnings per share of 70 cents, beating analyst estimates of 63 cents.
Revenue for the fourth quarter came in at $22.7 billion, also beating estimates of $22.36 billion.
Shares of Bank of America popped more than 3.5% in the pre-market.

Goldman Sachs | Outlook & Earnings bearishLooking at Goldman Sachs chart.
The SQZ indicator continues to turn hard green. Indicating further down side.
The stock has been ascending on descending volume. Bearish sentiment.
The MacD is about to have a bearish crossover.
The chart follows the bearish sentiment that is seen across the market.


GS for Short (momentum weakening)My quant model predicts
Profitability: it has a high probability(62%) to rebound at this level.
Entry Level: 163.03
Worst Case Level: $183.5
Money Management: Bet no more than 15% of capital
Suggested Strategy: Short stock for 5 Days

$GSA break on 172ish resistance could take us to the 0.382 fib retracement for a dead cat bounce. IF that happens and 172ish support helds, will create a HL and with the previous HH could confirm a downtrend reversal.


GS Broke Out Of Major Support, Potential Drop!GS broke out of its major support turned resistance at 171.75 where it could potentially drop further to its support at 137.33 (horizontal swing low support).
Ichimoku cloud is also showing signs of downward pressure which contributes to our bearish bias.

GS Broke Out Of Major Support, Potential to Drop!GS broke out of its support-turned-resistance line at 171.75 (23.6% Fibonacci retracement) where it could potentially fall further to its support at 137.15 (horizontal swing low support).
Ichimoku cloud is also showing signs of downward pressure.

Dow Stocks Goldman Sachs (GS)A look at Goldman , this is a younger company than most and seem particularly vulnerable to a financial crash
I used mostly monthly resistance, very rare will weekly matter in this case


Goldman Sachs: Nice H&S ReversalBack to the low 170's? Seems reasonable. Poor sector performance, nice H&S pattern. We're going for it...


Decision Time for Goldman SachsThe H&S target has been reached, leaving GS at the rising trend line of the large rising wedge that has been in play since the 2008 crash. The RSI is showing that GS is oversold while the MACD is still taking a plunge. A MACD recovery and bullish cross would be a good sign. If the price closes under the rising trend line, I expect a large plunge to the 0.786 Fibonacci retracement. If the support holds, expect return to the top of the rising wedge .


GS Approaching Support, Potential Bounce!GS is approaching support at 171.75 (61.8% Fibonacci extension, 76.4% Fibonacci retracement, horizontal overlap support) where it could potentially rise to its resistance at 209.46 (horizontal pullback resistance).
Stochastic (89, 5, 3) is approaching support at 3.1% where a corresponding bounce could occur.
