GS trade ideas

$GS Trade Idea - Bank Stress Test With the Bank Stress Test showing positive results, here's a possible trade gameplan for GS into qEnd provided conditions are met and we have a bullish reaction to GDP + Unemployment numbers in pre-market tomorrow.
The path on the 15 min chart looks messy since that's the lowest resolution I can publish, so I've included a 5 min version in the screenshot below.
Ideal Gameplan:
1. Price opens above risky area shown on chart and holds above the orange rectangle on the pullback
2. Long 6/30 $325C or $327.5C
3. Can cut some at 10 am if you wish, or hold for the push into 11:30
4. On the first decent pullback after 10 am, grab some $330C "lottos" if you've scaled out Cost Basis from the initial call position
5. By 11:30, price should've made an HH that will only be exceeded near the EOD or on Friday morning (can trim most/all of $330C here if you want)
6. If above conditions are met and price continues to base above $327.50-328 during the afternoon session, can look to re-enter $330C for the late-day push, holding final runners for Friday, but keep in mind there will be theta burn overnight
Note:
If price opens in the orange box shown, or enters orange box during the initial pullback after open, it's best to wait until the orange box is safely cleared, as there is a chance we backtest the afterhours PA under $320

Goldman Sachs: Head and Shoulders at a Bearish Butterfly PCZThere is a Head and Shoulders pattern that has formed at the PCZ of a Bearish butterfly; it is also breaking down the trend line of a Bearish Dragon and the likely target seems to be $129.

GS Long-term BuyOn GS, we have done the following:
- Hit the 50% retracement level
- Broken bearish structure
- Tested the 200 ema
- Formed demand levels

Goldman ShortTextbook initiation of resistance with a successful retest/rejection by a bearish engulfing pattern. Stop just above pattern and resistance and I'm just looking for a simple 1:2RR down at the most recent low. Let's see how it plays out...

Goldman looking BullishGS looks to be regaining an uptrend as seen from the crosses on my premium indicator.
Also, it caught out of the bottom, this could see a lot of upsides.

Goldman Sachs-Bullish BAT, High Volume Area and Channel Support In case of banking crisis panic is over and Financial Sector is oversell..

GS to 330As we can see, there was a stron selling, but right now I think is finishing and we can see a pullback to 330 area
Entrance= 323.68 or above
SL=315.38
TP= 330.00
Remember always using a stop loss!

GS AnalysisThis trend from last year's "MAY"(2022) follows a perfect support pattern at the above-mentioned levels. We can also notice the Head and shoulder pattern formed here.
Now, after forming the H&S pattern, it has again retested the support quickly which means that there is a high probability that it is gonna be "bearish". If it falls the below the support line(around $312.60), then our next support would be $303, followed by $286.
If it goes the other way, I mean if it again retests the support(around $312.60) and shoots up, then our first take profit should be around "$338".
This is what it looks like based on my analysis and chart pattern
Please do your own analysis and trade wisely folks - Thanks ;)
Note: You don't need to know all the chart patterns/technical indicators/oscillators to be a good trader/pro. You can be a successful trader with just support and resistance chart patterns/ and a few commonly used indicators. I support my above statement by telling if a stock needs to move in a certain direction, it is only possible when a good bunch of people uses that pattern/indicator. So when we learn the common indicators we can master the trade
Even though you learn some very good indicator analysis and when another good bunch of people don't use it or know, you will still make a bad trade as other people won't follow that pattern, and you go in different directions when the good bunch goes in another direction.
Just thought of sharing this piece of information with you all folks. Agree/disagree ?

Short Goldman SachsNYSE:GS
Whatever, whatever.... forks and stuff.
energy point, somewhere around $200
yuh
Fat_Fat

Goldman Sachs forming a head and shouldersWith the banking crisis, while the smaller banks are getting hammered, keep an eye on the larger ones too. I would start a short under 325 with intial targets of 320 and if 319 breaks then the neckline of 305.

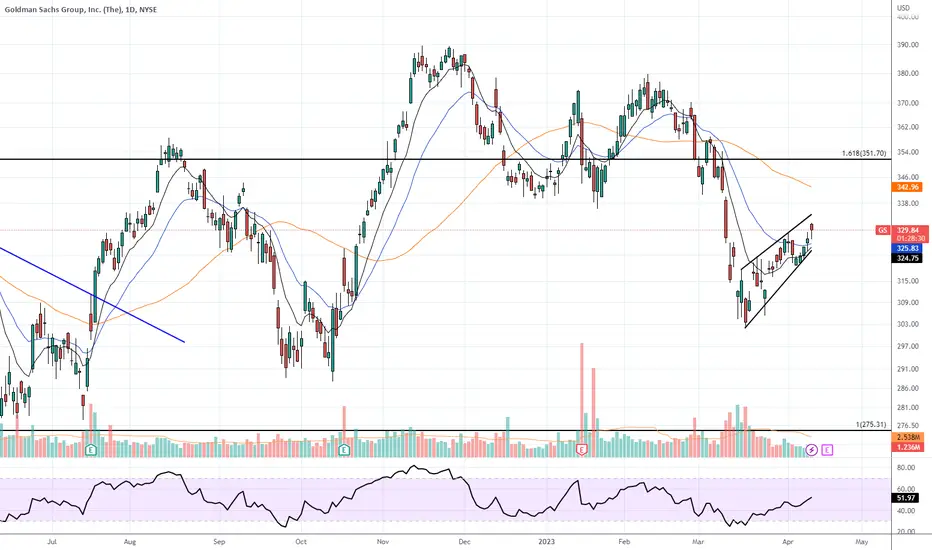
GS Bear FlagGS bear flag formation and double top pattern, with a clear RSI bearish divergence in formation.
Goldman Sachs has been making a series of higher lows on the 2H time frame and had shown no sign of weakness. However, after the recent failure of First Republic Bank, FRC, the spotlight is back on the banking sector. FRC assets were sized by the FDIC the past week and JPMorgan stepped in to buy the failed bank. And while the President assures all deposits are fine, and Jerome Powell assures the banking industry is solid; we also have Warren Buffet and Charlie Munger shedding huge positions in banks and sounding the alarm on the banking industry.
Goldman Sachs looks bearish on a break below $338.50. Demand area at $338.50-$340. Resistance at $345. A stock to have on watch this week as we have the interest rate decision this week and FOMC!
Our OptionsSwing Terminal picked up bearish activity on the $332.50 strike for this week at $0.85.

$GS with a bullish outlook following its earnings #StocksThe PEAD projected a bullish outlook for NYSE:GS after a positive under reaction following its earnings release placing the stock in drift A with an expected accuracy of 71.43%.

GOLDMAN SACHS IS IN A BULLISH TREND GOLDMAN SACHS is in a bullish trend as it is printing higher highs and higher lows. with the price entry near the trendline and the Fibonacci number 0.38 is the same.

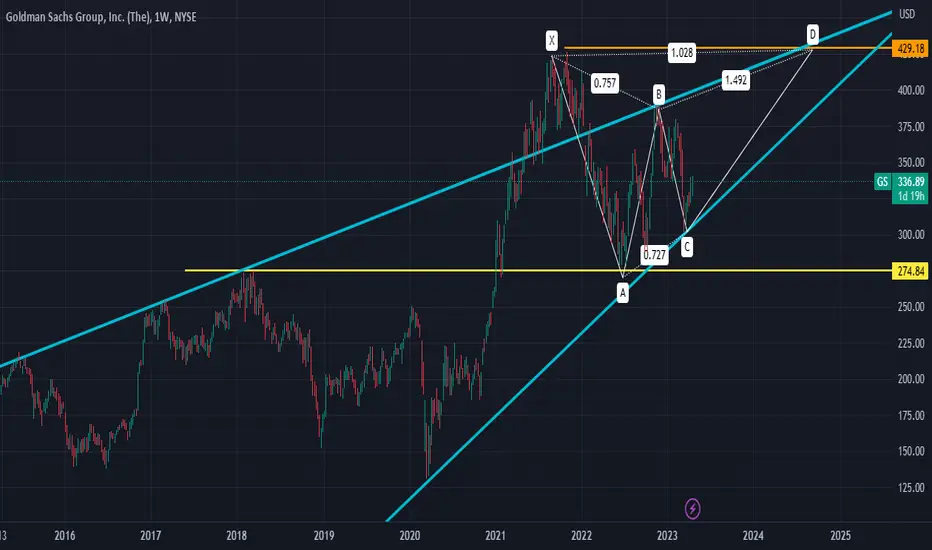
430 target looking to retest all time highslooking for price action to stay within the 2020 trendline and rise from C wave to D leg, at that time many will think of selling, but its building a nice base. this is actually a bull flag in disguise.
BATCaution: There is a Rising Wedge at 240ish that has not been broken so it is not valid.
Rising wedge are bearish but price is well above it at this time.
M pattern that terminated at the .886. Peak 2 is lower than peak 1.
Price is trying to bust through the .382 fib level today.
Price is at a horizontal Resistance level today.
Targets are above resistance levels so these must be broken or targets are invalidated.
No recommendation.
52 Week Range
277.84
389.58
Day Range
331.67
335.61
EPS (FWD)
31.98
PE (FWD)
10.44
Div Rate (FWD)
$10.00
Yield (FWD)
2.99%
Short Interest
1.01%
Market Cap
$117.24B
Volume
1,365,771

GS Goldman Sachs Options Ahead of EarningsAfter the last Price Target was reached:
Now analyzing the options chain of GS Goldman Sachs prior to the earnings report this week, I would consider purchasing
Calls with a 350usd strike price and an expiration date of 2023-5-19, for a premium of approximately $5.75.
If these options prove to be profitable prior to the earnings release, I would sell at least half of them.
I am interested to hear your thoughts on this strategy.

GSBear flag on the daily. Earnings next week. Grabbed a small 04/21 put position up here, stop above today's high.
GS ( Advancing Phase) Harmonic XABCDThe Trend was Bearish then i noticed Divergence, then the Trend start making Higher Highs and Lows. Took the Entry at 318 and the share price is still moving towards it's Target Price.

GS GOLDMAN Daily BULLISH Reversal - HarmonicsNYSE:GS
GOLDMAN Sachs GS Daily is looking at a BULLISH Reversal . Here Harmonics Bat Pattern is followed by a series of HH and HL. Buy stop Order at the break of last HH will be the way to go. R:R is 1:1 at least.

Goldman Sachs Hourly AB:CDBearish Flag continuation till point D
Look for bullish reversal at point D

GS GOLDMAN SACHS HARMONICS BULLISH REVERSAL PATTERNTrading Goldman Sachs (GS) using Harmonics Bullish Reversal Pattern.
Entry once price cross up point B @336.47
Stop Loss is below point D @301.48
TP1 372.61
TP2 407.58
Point to notice is Potential Reversal Zone at point D, once trend changes and Higher Highs and Highs and Higher Lows are printed use Buy stop order above point B.
There is a clear divergence at point D which strongly indicates that the trend change is almost imminent.

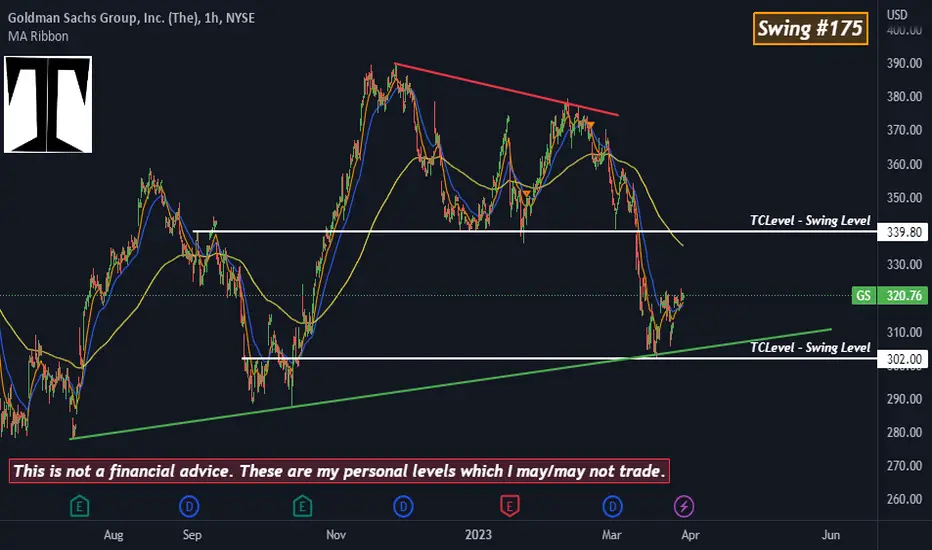
$GS, Swing Levels$GS is approaching a bullish cross on the fast EMAs.
On the long run, there is positive price action while that lower high shows kind of weakness on the short run.