Getting Support and Resistance Levels using optionsI describe a creative method to use external options data to then plot support and resistance levels directly on the chart. Up to 30 tickers supported at once and updates as frequently as you want.
NVDA trade ideas


Nvidia plummets ~3% afterhours! Buy the dip or sell the rally?Nvidia delivered another strong quarter, beating expectations on both revenue and EPS. However, shares dropped after hours to around $175, as data centre revenue narrowly missed forecasts and China sales remained absent due to regulatory uncertainty.
Technically, if NVDA breaks below $175, bears may target the $170 double bottom support in a dead-cat-bounce fashion, with a risk of further downside if that level fails. However, if the stock holds above $179 and reclaims $185, bulls could see a rally toward $193 and potentially $220 in the medium term, which could still materialise after a short-term decline toward $170.
This content is not directed to residents of the EU or UK. Any opinions, news, research, analyses, prices or other information contained on this website is provided as general market commentary and does not constitute investment advice. ThinkMarkets will not accept liability for any loss or damage including, without limitation, to any loss of profit which may arise directly or indirectly from use of or reliance on such information.

NVDA eyes on $183.72 again: Golden Genesis Fib about to Break? NVDA looks ready for a break out to new highs.
Beating against the Golden Genesis at $183.72
Looking for a Break-n-Run, maybe no retest even.
$195.01 is first target and should be quick.
$201.51 is next target maybe after a dip.
$177.82 is high support for bulls to hold.
.
Previous analysis that gave EXACT Shorts from this Fib:
Hit BOOST and FOLLOW for more such PRECISE and TIMELY charts.
=========================================================
.
NVDA LONG TRADING PLANDivergence on 1H RSI. He is Making a Support there. So there is o much chance it will brake the HH. But i am my canceling my Main order. i will wait if at my Entry there is Divergence or any news then i will Short there. Question me i will answer.

NVDA Support and Resistance Lines Valid from July 1 to 31st 2025Overview:
These purple lines act as Support and resistance lines when the price moves into these lines from the bottom or the top direction. Based on the direction of the price movement, one can take long or short entries.
Trading Timeframes
I usually use 30min candlesticks to swing trade options by holding 2-3 days max. Anyone can also use 3hr or 4hrs to do 2 weeks max swing trades for massive up or down movements.
I post these 1st week of every month and they are valid till the end of the month.

AI GAIN Act: A Shot in the Foot for the Chip Industry?By Ion Jauregui – Analyst at ActivTrades
The debate over Western leadership in artificial intelligence once again centers on Washington. The new AI GAIN Act, integrated as part of the National Defense Authorization Act (NDAA), establishes that any chip with performance above 4,800 TOPS will require an export license. The measure also stipulates that semiconductor manufacturers must prioritize deliveries to U.S. companies before exporting advanced chips abroad. Framed as a strategy to reinforce national security and curb China, the legislation has sparked alarm across the industry. In short: if U.S. companies are waiting for chips, China and other countries move to the back of the line.
Nvidia raises the alarm
Nvidia (NASDAQ: NVDA.O), the undisputed leader in GPUs for AI, has warned that the law would stifle global competitiveness and slow innovation in artificial intelligence. According to the company, there is currently no domestic supply shortage that justifies restricting access for foreign clients. The criticism recalls the controversial AI Diffusion Rule, pushed by the Biden administration in early 2025 and eventually revoked before coming into force. At the time, restrictions also aimed to control the export of chips and AI models but were discarded for being excessively rigid.
Impact on the semiconductor sector
The reach of the AI GAIN Act goes beyond Nvidia:
• AMD, with its growing exposure to AI accelerators, faces similar risks in its international operations.
• Intel, with a stronger domestic presence, may be less affected, as its profile aligns with the strategic goal of boosting local production.
• Broadcom and Qualcomm, highly dependent on global client networks, would face tighter constraints on commercial flexibility.
The most likely outcome is a double-edged sword: ensuring the U.S. always has priority in the supply chain, but at the cost of undermining the global business model that sustains sector margins. In short: the risk is that the cure ends up being worse than the disease, slowing global competition.
Technical analysis of Nvidia
Nvidia’s stock remains close to record highs after holding above USD 164 yesterday and closing at USD 168.31. Price action shows the loss of the 50-day moving average and movement toward the 100-day. A clear trend reversal has not yet materialized, even though the RSI is in oversold territory at 39.44, while the MACD is shifting into negative territory, crossing into the lower part of the histogram.
Another relevant factor is a price bell that has moved strongly between USD 152.89 and USD 126.84, with its Point of Control (POC) around USD 138.17, slightly below the accumulation zone that fueled the rally to all-time highs. The ActivTrades US Market Pulse currently signals Extreme Risk-On conditions in U.S. markets, highlighting a phase of exuberance on Wall Street where macro or geopolitical risks seem ignored. This new law could act as a catalyst for sector pullbacks.
If the current support at USD 164.58 and the next level at USD 152.89 fail, a return to the POC would be likely. On the other hand, if prices hold and consolidate, a new rally toward highs is possible. Such regulatory moves can trigger trend shifts, but if the market absorbs them, upside momentum could resume. From a wave structure perspective, bullish waves remain intact, suggesting this may be only a temporary pause.
• Resistances: All-time high at USD 184.48
• Supports: 164.58, 152.89, and POC at 138.17
• Indicators: RSI at 39.44, signaling oversold and potential consolidation
• MACD: Negative territory
• Moving averages (50/100/200): No trend change yet, though the 50-day is approaching the 100-day
• ActivTrades US Market Pulse: Extreme Risk-On
Conclusion: Trump vs. AI
The Trump administration’s protectionist measures aim to secure national access to silicon and reduce dependence on foreign suppliers, in order to safeguard U.S. leadership in AI. However, Nvidia’s warnings—echoed by the broader sector—underscore fears that overregulation could erode the international competitiveness of American tech giants, especially against China and other emerging innovation hubs. In this race for AI dominance, building walls may end up slowing down your own runners.
*******************************************************************************************
The information provided does not constitute investment research. The material has not been prepared in accordance with the legal requirements designed to promote the independence of investment research and such should be considered a marketing communication.
All information has been prepared by ActivTrades ("AT"). The information does not contain a record of AT's prices, or an offer of or solicitation for a transaction in any financial instrument. No representation or warranty is given as to the accuracy or completeness of this information.
Any material provided does not have regard to the specific investment objective and financial situation of any person who may receive it. Past performance and forecasting are not a synonym of a reliable indicator of future performance. AT provides an execution-only service. Consequently, any person acting on the information provided does so at their own risk. Political risk is unpredictable. Central bank actions can vary. Platform tools do not guarantee success.

NVDIA SHORT TRADING PLANSWhy:
Weekly Divergence
Field BOS in 4H
Focus on Daily
My Entry is only discounted Price : FIB Values
if you want to enter you can entry after the BOS and SL will be the

Nvda volume spike at top?Bearish argument:
Volume spike at the top on the daily
No daily reversal seen as of Monday Sept 1st
Daily bearish divergence
Monthly indecision candle
TP: Last week's low
Daily RSI 30
Daily bullish divergence
160 gap
Last year's high
Bullish arguments:
High volume on Friday's dump on QQQ
Need to monitor for QQQ daily reversal
Conclusion: Probable chance of continued dump on NVDA.
Most likely price target is NVDA or when QQQ reaches last week's low as it coincides with a previous high volume spike level.

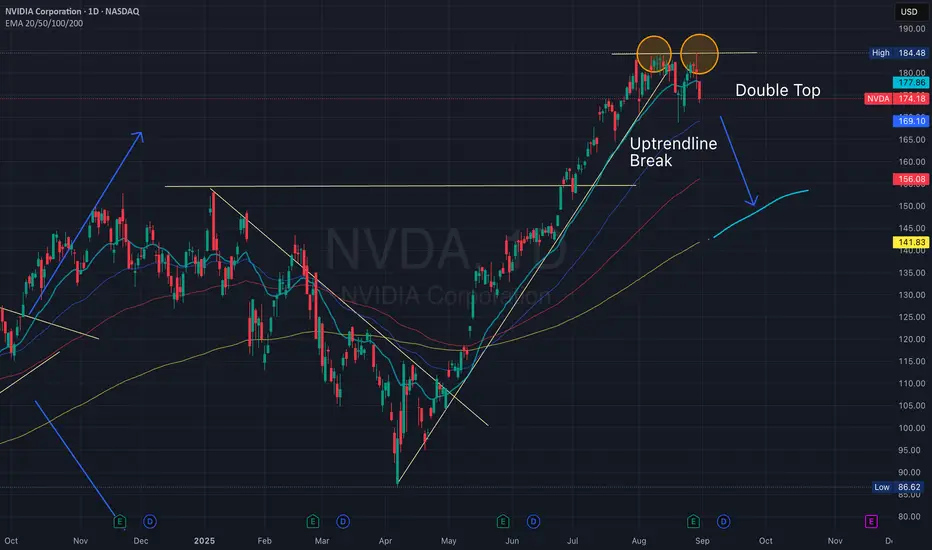
NVIDIA Has Some Reversal SignsNVDA has formed a double top and stochastic oscillator divergance on the dailyt chart. ON the monthly chart it has a it has formed a shooting star candle.
Good luck for all of you
Markets Titan

Hello trader, for tomorrow, February 9, 2025.NVDA: Bullish entry at 176.00. Possible profit-taking at 180.00. If there is no rejection at 180.00, for a next bullish entry, we should wait for a breakout of the double top at 184.00, taking a new bullish entry at 186.00.
For the bearish entry: 172.00/170.00. This last one could act as a rebound zone because it would form a double bottom. Use the VWAP indicator for your stops.
NVDA - Short for ShorttermNVDA shows double resistance around $185. Price is going flat and double on resistance. Price is also far away from 200 EMA on Day TF and it must meet in near future. There will some slowness on stock movement and retracement will take it towards 200 EMA on D TF. Short term short price target of $150
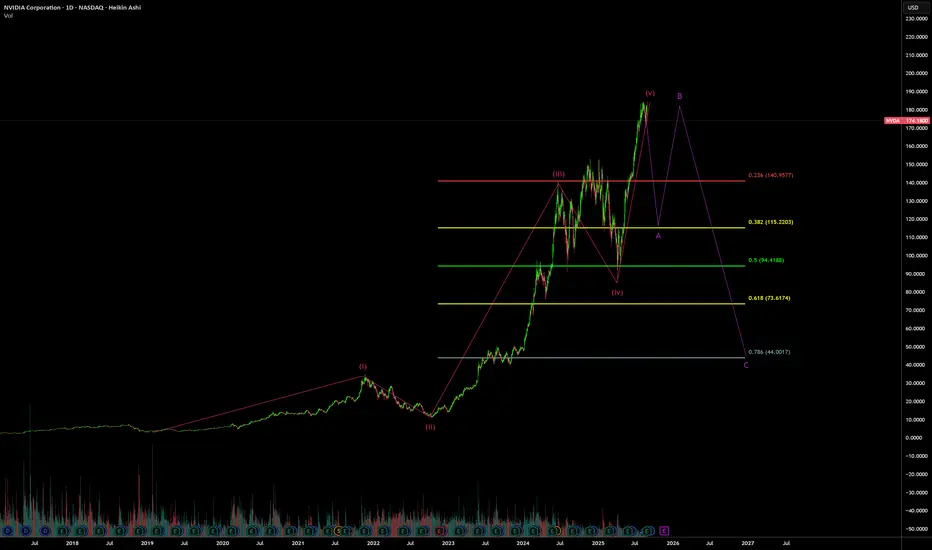
Nvidia, possible correction?I'm not presently invested in nvidia, but present this as possible deep value entries.
Looking at elliot wave and fib levels, I would expect to see a 3-3-5 correction with a double top and bottom at either .618 $72 or .786 at $44.
After a bottom is found then expect a short accumulation period of 3 higher highs then a mark up in price.
I usually always leave out time a bias, but in this case with the upcoming fomc meeting in September, I could see this correction happening and finishing fast.
Obviously, if these deep value targets are met, I will realign my portfolio to heavy in nvidia.
You wanna bet against NVDA? Go ahead. Not me, though.This is now my 7th idea for NVDA. It's been a while, and I don't really know why. I guess maybe it seems tiresome posting ideas about the same stocks over and over again. But you know what isn't tiresome? Making money on those same stocks over and over again.
The yellow circles represent the entries for my previous ideas. Those trades were made during one of the worst 4 month stretches for NVDA in a LONG time. It lost about 19% for buy and holders during that time. I won't make you go back and data mine the results of my trades in that span. Here are all 12 lots I traded in those 6 ideas:
+8.1% in 6 trading days
+9.90% in 5 trading days
+14.50% in 3 trading days
+4.89% in 1 trading day
+0.74% in 1 trading day
+0.50% in 1 trading day
+1.80% in 1 trading day
+2.30% in 2 trading days
+3.40% in 1 trading day
+8.80% in 1 trading day
+2.60% in 9 trading days
+12.31% in 4 trading days
I trade equal dollar lot sizes so those 12 trades produced a total non-compunded return of just under +70% WHILE the stock was falling 19%. That's not self-promotion, that's a prelude to what comes next.
I'm not afraid of the stock dropping from here. If I was, I would not make the trade. The reality is that the way I trade actually works better when stocks move sideways or are falling than when they are in strong uptrends. Since April, my algo has only generated 5 signals on NVDA. I've only traded 2 of them before this, but all 5 are marked with white arrows. Add those to the ones from previous ideas and we are looking at a total gain of +92% or so since November.
While the most recent signal prior to this one is a loser SO FAR, it actually presents a better opportunity. Historically, the returns on the 2nd entry (adding to an existing trade) are MUCH better than the initial entry returns. Luckily, I didn't trade that most recent signal, so I get to try to grab more juice with less squeeze.
I won't lie, if employment falters after that inflation read we got today, it could be the beginning of a rough period for stocks. But I also know that virtually nobody can predict macro with any degree of success, least of all me. I'd also rather hitch my wagon to NVDA than to the vast majority of stocks in a generally overpriced market.
Add to all that the fact that they are pulling in over $500m a DAY in revenues, roughly 50% more than a year ago - and Wall St. is sad about that, apparently.
The stock also is resting RIGHT on near term support and there is more close by, which makes me take this trade enthusiastically. A word of caution, though. If the whole market goes down, NVDA will too and that could lengthen the time it takes to close here. I only trade the stock, so time isn't really an issue for me. For someone trading short dated options, it would be a disaster if this runs for a while.
My long entry price is 174.18 at the close today. I can and will add to the position tactically if good opportunities present themselves and I will update this idea whenever I add or sell lots.
As always - this is intended as "edutainment" and my perspective on what I am or would be doing, not a recommendation for you to buy or sell. Act accordingly and invest at your own risk. DYOR and only make investments that make good financial sense for you in your current situation.

NVDA LIVE 27 AUG 2025This is my analysis for NVDA . i am not touching it all. I have discussed my reasons as per data. If you have any doubts, feel free to DM me
NOTE: AVOIDING NVDA

I believe NVDIA will...I think NVIDIA is in a consolidation phase and we may see a pull back into the liquidity zone before its next run and I believe that this is a buying opportunity, to see let profits run. According to the Fibonacci retracement tool that we are using it was going to have a pullback. The way in which it is set up in a way where I am able to tell. It you look at my recent bitcoin publication you would see how it works. It's able to essentially tell you if the asset is going to be bearish or bullish based on its pull backs. Now I am always one for fundamental and I am still experimenting with this strategy. So, I guess we will see.
ALWAYS REMEMBER THIS IS NOT FINANCIAL ADVICE. I PRAY THAT YOU (THE READER) RECIEVE YOUR BLESSING WITH THIS TRADE.

$NVDA big move comingWatching NASDAQ:NVDA close the month with a long legged Doji at the top is leading me to believe that some bigger news will be coming out to drop the stock to the downside. I would expect a nice discount coming for potential longer term entry.
Potentially something like China is rejecting their chips or an international market rejection or lawsuit to come into play.

NVDA TRADE AFTER LONG WEEKENDI am looking at NVDA and took Call option expiring sep 5, strike price $170 @$3.40.

NVIDIA to $900? That’s what an AI debate tool just told meSo I stumbled on this AI tool named "AI Debate" that analyzes stocks.
At first, I tried Apple and Microsoft — the results were solid, very thorough, but nothing shocking.
Then I plugged in NVIDIA.
And the “AI experts” came back saying that at current levels, there’s still a 4–5x upside. From around $180 to a target above $900.
My jaw dropped. Honestly, it feels unbelievable.
But here’s the thing: I kinda trust this more than random human “gurus” with agendas. At least the AI is pulling fundamentals, technicals, sentiment, and laying it out objectively — no one is pumping their own bags.
Can I try buying some NVDA?
Or can you break down where the AI analysis might be flawed?
Below is the evidence:
Analysis log:
AI Warren Buffett:
NVIDIA is a remarkable company with outstanding profitability and growth—its return on equity is over 115%, net margins exceed 50%, and revenue is growing at a blistering pace. The business is financially sound, with a strong balance sheet and ample free cash flow. If you look at the numbers alone, it’s easy to see why so many investors are excited. However, as I’ve often said, 'Price is what you pay, value is what you get.' At a P/E of 58 and a price-to-book over 50, you’re paying a very steep price for future growth. This is a classic case where the business is excellent, but the stock may be ahead of itself. If growth slows even a little, the stock could face a sharp correction. I generally avoid technology companies outside my circle of competence, but NVIDIA’s dominance in AI chips gives it a real, though possibly temporary, moat. For investors with a high risk tolerance and a long-term horizon, it may be worth a small position, but I would insist on a significant margin of safety. My target price is based on a discounted cash flow approach, assuming continued strong growth but building in a 25% margin of safety. The 12-month target price range is $650 (conservative) to $800 (reasonable), with $900 as an optimistic scenario if growth persists. At current prices, caution is warranted—sometimes the best thing to do is wait for a better pitch.
AI Peter Lynch:
When you look at NVIDIA, you’re staring at a company that’s firing on all cylinders—profitability, growth, and financial health are all top-notch. I mean, a 115% ROE and net margins over 50%? That’s the kind of stuff you dream about as an investor. Revenue is up nearly 70% year-over-year, and earnings are still growing at a healthy clip. The balance sheet is rock solid, with a current ratio of 3.46 and manageable debt. If you’re looking for a company with a great story, just look around: AI, gaming, data centers—NVIDIA’s chips are everywhere, and if my kids are talking about it, you know it’s mainstream. But here’s the rub: the valuation is sky-high. A P/E of 58, P/B over 50, and P/S close to 30? That’s a lot of future growth baked into the price. The PEG ratio is well above 1, so you’re not getting a bargain here. This isn’t the kind of stock you buy for a quick double; you’re betting on NVIDIA becoming even more dominant in the years ahead. The technicals are still bullish, but momentum is cooling off, and the social buzz is pretty quiet—maybe folks are waiting to see if the next earnings report justifies the price. So, is this a ten-bagger from here? Probably not, given the current valuation. But if you’re a growth investor with a strong stomach for volatility, NVIDIA’s fundamentals make it a compelling long-term hold. Just don’t expect a smooth ride, and be ready for some bumps if the market decides the price is too rich. Target Price Logic: With a forward EPS estimate of around $20 and a more reasonable growth-adjusted P/E of 40 (still a premium, but justified by leadership in AI and data centers), the 12-month target price comes to about $800. That’s factoring in continued strong growth, but not assuming another explosive year like the last one. If growth slows or the market re-rates tech stocks, downside risk is real.
AI Cathie Wood:
NVIDIA is the quintessential example of a company at the forefront of disruptive innovation, driving the AI revolution and transforming industries from data centers to autonomous vehicles. Its GPU and AI accelerator technologies are not only powering exponential growth in cloud computing and generative AI, but also expanding the total addressable market (TAM) into trillion-dollar territory as enterprises and governments race to adopt AI infrastructure. The company's fundamentals are outstanding: ROE at 115.5%, net margin at 51.7%, and revenue growth of 69.2% YoY signal a rare combination of profitability and hypergrowth. NVIDIA's R&D intensity and relentless innovation pipeline have created a technological moat that is widening as AI adoption accelerates globally. Over a 5-10 year horizon, we see NVIDIA capturing a disproportionate share of the expanding AI and accelerated computing markets, with potential for TAM expansion as new applications emerge. However, the current valuation is extremely rich (P/E 58, P/S 29.5), reflecting high expectations and introducing volatility risk if growth decelerates. While short-term technicals and muted sentiment suggest caution, the long-term exponential growth trajectory remains intact. Our 12-month target price is derived from a forward EV/Revenue multiple of 30x on projected FY2026 revenues, reflecting continued AI adoption and market leadership, but we emphasize the need for risk management given the premium pricing.
Nvidia (NVDA) Shows Bearish Signs After Earnings ReleaseNvidia (NVDA) Shows Bearish Signs After Earnings Release
On Wednesday, Nvidia published a fairly strong quarterly report:
→ Revenue for the second quarter came in at $46.74 billion (record), up 56% compared with the same period last year;
→ Adjusted earnings per share (EPS) were $1.05, a 54% year-on-year increase and above analysts’ expectations of $1.01–$1.02.
However, in the Data Centre segment (closely watched by the market), results fell slightly short of Wall Street forecasts, which may suggest a slowdown in capital flows into AI infrastructure. This factor could explain why Nvidia (NVDA) underperformed the index later in the week: for instance, the S&P 500 hit a record high on Thursday, while NVDA closed lower.
Technical analysis of Nvidia (NVDA) chart
Six days ago, we:
→ Drew an upward channel (shown in blue), capturing NVDA’s price swings after the bullish surge at the end of June;
→ Highlighted the importance of support at $170 and resistance at $183.
Indeed, $183 looks like a solid barrier:
→ The numbers (1, 2, 3) mark failed attempts by the bulls to break through this resistance, giving grounds to view the chart in the context of a triple top pattern.
→ The third peak only slightly exceeds the previous highs, which resembles a bull trap and the Upthrust After Distribution (UTAD) pattern in Richard Wyckoff’s methodology, signalling the prospect of lower prices. A bearish gap the following day (shown by the red arrow) and a weak Friday close underline the bears’ aggression.
Given the above, we could assume that the bulls may try to keep the price within the channel, relying on support at its lower boundary. Yet the mentioned signals suggest that the bears are intensifying pressure. If we see only a weak rebound from the lower boundary at the start of September, the current channel could be at risk. In the event of a bearish breakout, a move down to test the $170 support could happen.
This article represents the opinion of the Companies operating under the FXOpen brand only. It is not to be construed as an offer, solicitation, or recommendation with respect to products and services provided by the Companies operating under the FXOpen brand, nor is it to be considered financial advice.

NVDA IS A SELL+++ $136.25 targetNVDA tends to retrace to .5 and .618 fib on each previous correction before making another bull run. We are also on an exhausted Eliot Wave impulsive number 5 overextended. Dont get suckered into the bounces until the selling has been exhausted to the downside. It should bounce off $152.98 support before resuming lower

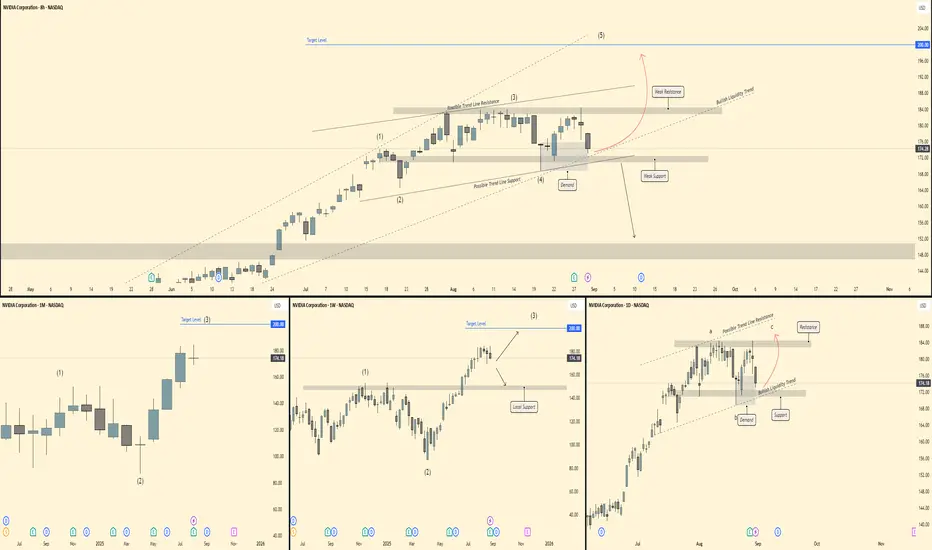
NVDA - Critical Point right now! Back to 150 OR we make new high📊 NVDA – Multi-Timeframe Outlook
🔎 Monthly (1M)
Strong bullish structure with clear Elliott Wave progression (1)-(3) unfolding.
Current candle shows retracement after a parabolic push, but higher timeframe structure remains intact.
Target level stands at 200 USD, aligning with Wave (3) completion zone.
🕰 Weekly (1W)
NVDA completed Wave (3) near 184, now pulling back into a local support zone ~160 – 165.
Structure suggests a corrective Wave (4) before potential continuation higher.
As long as support holds, expectation remains for a Wave (5) push towards 200+.
⏱ Daily (1D)
Price coiling inside a corrective a-b-c structure under trendline resistance.
Demand/support zone ~170 – 172 is acting as the base.
Break above 184 resistance confirms bullish continuation, while loss of support opens risk towards 152 (deeper retrace).
⏳ 8H
Clear retracement into demand after Wave (3) high.
Price holding trendline support + demand confluence.
If buyers step in, expect a rally into Wave (5) targeting 190 – 200.
Breakdown of demand would shift momentum bearish short-term.
🎯 Trade Plan
Bias: Bullish continuation (Wave 5 setup)
Entry Zone: 170 – 175 (demand/support)
Targets: 184 (short-term), 200 (medium-term)
Invalidation: Break & close below 160 support
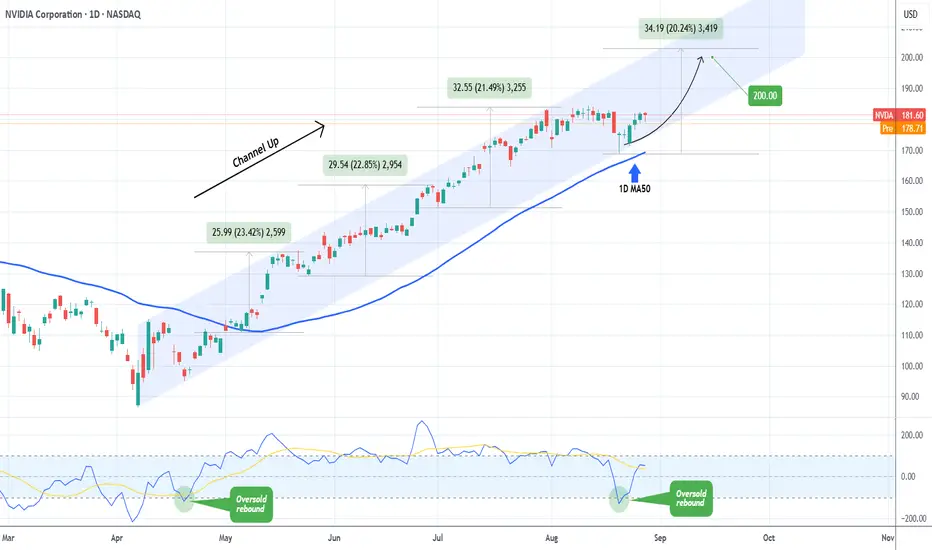
NVIDIA Is it still a buy after its Earnings release?NVIDIA Corporation (NVDA) delivered stronger-than-expected second-quarter earnings on Wednesday, but its data center revenue came in slightly below forecasts as U.S. restrictions on H20 chip sales to China weighed on results. The result was a 3.1% fall on the company's stock in after-hours trading following the report.
The obvious question is this: Is it still a buy?
The answer can be given by purely looking at the technicals. Based on the bigger picture, the stock's 5-month pattern remains a Channel Up since the April 07 bottom, and in fact the recent dip on August 20 was a Higher Low exactly on the pattern's bottom and almost on the 1D MA50 (blue trend-line), which has been intact since May 06.
Given also the fact that the 1D CCI rebounded with aggression after marginally breaking below its oversold level (-100.00), similar to April 21, we expect NVIDIA to resume the bullish trend and extend this new Bullish Leg.
Since the last three Bullish Legs have all increased by a little more than +20%, we expect the price to easily reach our $200.00 long-term Target, before the next technical correction occurs.
-------------------------------------------------------------------------------
** Please LIKE 👍, FOLLOW ✅, SHARE 🙌 and COMMENT ✍ if you enjoy this idea! Also share your ideas and charts in the comments section below! This is best way to keep it relevant, support us, keep the content here free and allow the idea to reach as many people as possible. **
-------------------------------------------------------------------------------
💸💸💸💸💸💸
👇 👇 👇 👇 👇 👇