TESLA - LONGSAs you can see - our indicator works on any and all instruments you would like to trade....
You can search for the indicator - as we made a DEMO version available.
However to get the full version - you will need to follow and contact us!
TSLA trade ideas
Tesla Shares (TSLA) Hit Two-Month HighTesla Shares (TSLA) Hit Two-Month High
During Friday’s trading session, Tesla shares briefly rose above the $300 mark — the first time in over two months. Although the daily candle closed below this key psychological level, TSLA still outperformed the broader stock market.
This move was supported by:
→ Investor approval of Elon Musk’s late-April pledge to spend less time on the Department of Government Efficiency (DOGE) and focus more on his role at the company.
→ A recent announcement from the Trump administration regarding a trade deal with the UK, alongside hints that more agreements may follow — potentially alluding to US-China negotiations.
Technical Analysis of TSLA Shares
In our previous analysis of TSLA’s stock price, we:
→ Highlighted the key support level around $220, which prevented deeper declines in early April even as broader indices saw more bearish trends;
→ Identified a descending channel (marked in red).
This channel remains relevant for now, but the price has already approached its upper boundary. It’s reasonable to assume that this level could act as resistance — similar to the midline of the channel (as indicated by arrows) — especially when reinforced by the psychological $300 level.
However, bulls may find strong support from any further details on a US-China trade deal (as discussed earlier today). A bullish breakout of the red channel in the coming days cannot be ruled out, potentially confirming the relative strength of TSLA stock and extending the trajectory marked by the blue lines.
This article represents the opinion of the Companies operating under the FXOpen brand only. It is not to be construed as an offer, solicitation, or recommendation with respect to products and services provided by the Companies operating under the FXOpen brand, nor is it to be considered financial advice.

OptionsMastery: Looking for an immediate buy on TSLA! 📣Make sure to watch fullscreen!📣
Thank you as always for watching my videos. I hope that you learned something very educational! Please feel free to like, share, and comment on this post. Remember only risk what you are willing to lose. Trading is very risky but it can change your life!


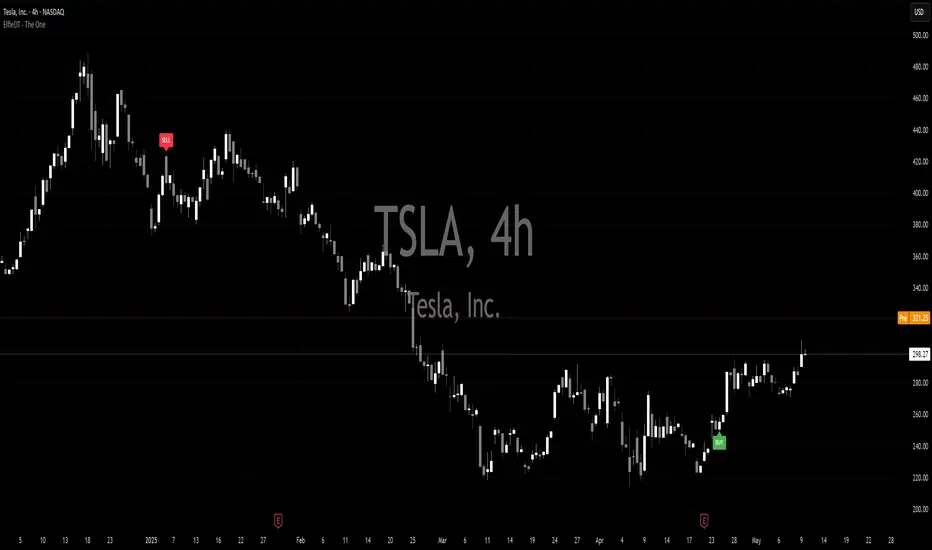
TESLA Set To Fall! SELL!
My dear subscribers,
This is my opinion on the TESLA next move:
The instrument tests an important psychological level 298.27
Bias - Bearish
Technical Indicators: Supper Trend gives a precise Bearish signal, while Pivot Point HL predicts price changes and potential reversals in the market.
Target - 288.52
About Used Indicators:
On the subsequent day, trading above the pivot point is thought to indicate ongoing bullish sentiment, while trading below the pivot point indicates bearish sentiment.
Disclosure: I am part of Trade Nation's Influencer program and receive a monthly fee for using their TradingView charts in my analysis.
———————————
WISH YOU ALL LUCK

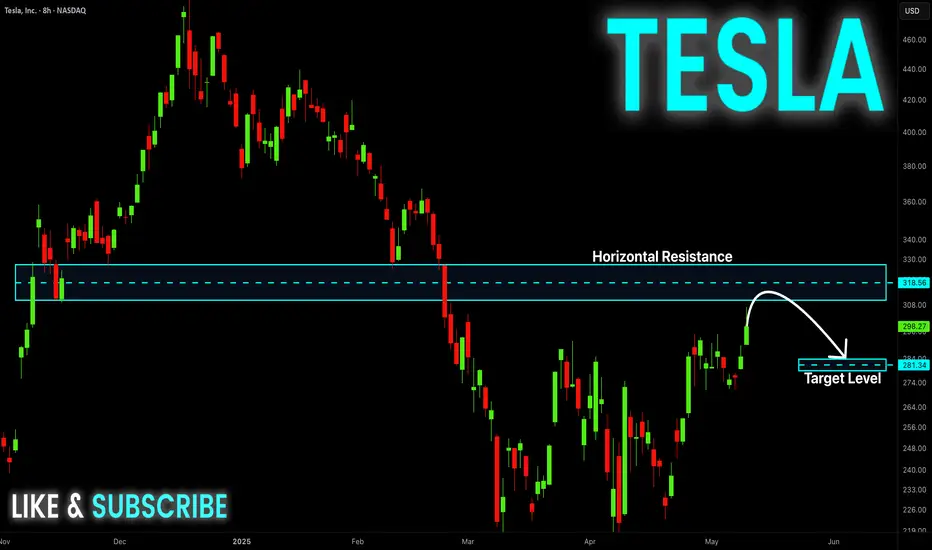
TESLA Resistance Ahead! Sell!
Hello,Traders!
TESLA stock is growing
And we are bullish biased
Mid-term but the price is
About to hit a horizontal
Resistance of 322.00$
So after the retest we
Will be expecting a local
Bearish correction
Sell!
Comment and subscribe to help us grow!
Check out other forecasts below too!
Disclosure: I am part of Trade Nation's Influencer program and receive a monthly fee for using their TradingView charts in my analysis.
TESLA: Short Trade with Entry/SL/TP
TESLA
- Classic bearish formation
- Our team expects fall
SUGGESTED TRADE:
Swing Trade
Sell TESLA
Entry Level - 298.27
Sl - 310.31
Tp - 265.48
Our Risk - 1%
Start protection of your profits from lower levels
Disclosure: I am part of Trade Nation's Influencer program and receive a monthly fee for using their TradingView charts in my analysis.
❤️ Please, support our work with like & comment! ❤️

Trade Review (TSLA)Trade Review (TSLA)
key notes
- displacement -> consolidation. no bearish CISD or MSS on higher time frames
- pullback into OTE of original displacement
- unswept liquidity targets
- 4hour bullish market structure shift
- displacment, creation of a HTF fair value gap and retracement into fair value gap (Entry)
- exit at internal buyside liqudity

TSLA about to rip!Closed above the 200 SMA and flipped supply into demand. 325 on deck possible next week

Tesla May 9th 2025 this is a follow-up on Tesla it just made a minor new high and now it's going to expand and go a lot higher.

TSLA double bottomAlthough very bad bad last quarter report regarding the Revenue, TSLA in terms of technical analysis has just made double bottom and has broken a critical price range of 270.
Calculated risk of 5-10% of the portfolio can be good for this trade imo, however looking for a strong buy signal that is supported by buying volume.

Tsla Look GoodTsla 294 first resist but I can see it pass 300. IMO. clean break and held with volume once rest

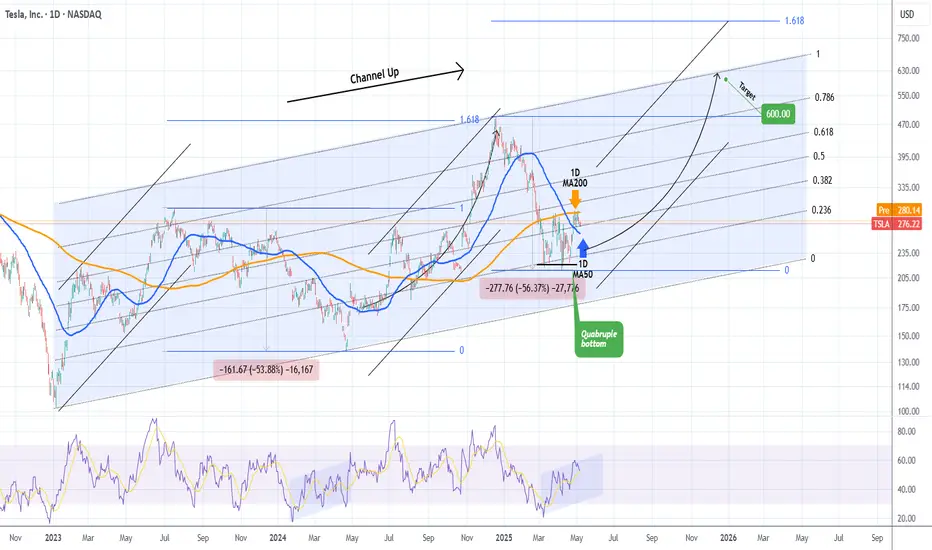
TESLA Is a $600 price tag a pipe dream?Tesla (TSLA) is seeing a steady recovery from the April 21 2025 Low, which has been a Quadruple Bottom, and has found itself consolidating the last 10 days within the 1D MA200 (orange trend-line) and the 1D MA50 (blue trend-line).
The 2.5 year pattern is a Channel Up and this Quadruple Bottom took place exactly on its 0.236 Fibonacci level, with a 1D RSI sequence that resembles the Bullish Divergence of its previous bottom on April 22 2024. The similarities don't stop there as the Bearish Legs that led to those bottoms have almost been identical (-53.88% and -56.37% respectively).
As a result we can technically assume that the current Bullish Leg that will be confirmed with a break above the 1D MA200, will be symmetrical to the previous one, which made a Higher High on the 1.618 Fibonacci extension from the bottom. That is now at $823 but falls outside of the 2.5-year Channel Up, so our long-term Target for the end of the year is $600, which is right at the top of the pattern.
-------------------------------------------------------------------------------
** Please LIKE 👍, FOLLOW ✅, SHARE 🙌 and COMMENT ✍ if you enjoy this idea! Also share your ideas and charts in the comments section below! This is best way to keep it relevant, support us, keep the content here free and allow the idea to reach as many people as possible. **
-------------------------------------------------------------------------------
💸💸💸💸💸💸
👇 👇 👇 👇 👇 👇
An Example Of How To Trade When You Live A Busy LifeIn this video, I demonstrate a swing trading approach that requires very little time in your day.
This type of trading, using limit orders, allows you to locate a strategy set-up, place your order in the market, set an alert, and then just let the market do it's thing.
I hope it's insightful!
The Meditrader


Tesla - TSLA - moving to $328 Step on up, buy your July Tesla $330 calls! Right here folks, step on up!
Tesla about to surge, what will the NPC News say is the reason? Tariff Deal?
GO Murrey
GO Elliott
GO Gann
GO Kumar

$acmr has the same price action as $tesla did a few months agoIt Wouldn't suprise me if ACMR research would break out in the coming months out of the inverted H&S pattern!

$TSLA NASDAQ:TSLA Outlook:
Tesla remains at an attractive price level. Bullish momentum may continue, driven by Elon Musk’s strategic satellite investments via Starlink. Additionally, steady Cybertruck demand and advancements in autonomous technology projects are supporting long term growth potential.
Tesla Target: $1500Tesla Mega Setup Alert
NASDAQ:TSLA is forming a rare double cup & handle on monthly chart
Accumulation phase ending
Entry zone: $270–280
Target: $1500–$2000 in 2 years
10x potential if structure plays out!
Don't blink 👀
#Tesla #TSLA #ElonMusk #StockMarket #Investing

TSLA Setting Up for a Big Move?🔎 Big Picture (1D Chart)
TSLA had a solid bounce off that $138–$140 range back in April, and we finally got the trendline break to the upside. But right now… we’re kinda pausing. Price stalled below $280, and the MACD looks like it's rolling over a bit. Also noticed Stoch RSI curling down — not great if you're expecting momentum continuation.
We’re sitting in this tight range just above prior structure — it feels like the market is waiting for something.
🕒 Zooming In (1H Chart)
1H shows a bit more chop than I’d like. There’s clearly some pressure under $278 and buyers haven’t stepped in aggressively. That trendline break we had from April is still valid, but price is walking sideways. Kinda reminds me of distribution vibes unless we reclaim that $284–$286 area quick.
MACD is flat, and Stoch RSI bounced from oversold but isn’t convincing just yet.
🧠 Options Flow + GEX Insight
This is where it gets really interesting…
* Gamma Wall / Call Resistance: $297.50–$300 is the GEX lid. Tons of calls stacked there — if TSLA starts squeezing, that’s the magnet.
* PUT walls: Strongest net negative GEX is at $270, followed by $260. That makes $270 my short-term line in the sand — if we lose it, volatility probably spikes fast.
* HVL (High Volume Level): Lined up with $275–$278 zone. That’s right where price is dancing now.
💡 So the GEX map shows we’re trapped between a wall and a floor. Could be a coil before a breakout — or a fakeout flush before a rip.
💬 My Game Plan
Honestly, I'm playing this one day by day. Here’s how I’m thinking about it:
Scenario A – Breakout
* Entry: $285+ reclaim with volume
* Target: $297.50, then $300
* Options idea: Weekly 290C or 295C lotto if IV stays tame
Scenario B – Breakdown
* Entry: Below $270 with momentum
* Target: $260 zone
* Options idea: 265P or a debit put spread targeting $260 if VIX is friendly
Neutral Trade
* I might scalp inside this range ($270–$280), but it’s tricky. If I see chop, I sit. No reason to force it.
📌 Final Thought
TSLA looks like it’s prepping for something — we’re at a balance point between option pressure and fading momentum. If you’re a scalper, be nimble. If you’re swinging, this might not be the cleanest entry just yet. But when it moves, it’ll move fast.
Trade smart. Protect your capital.
This post is just my view — not financial advice. Do your own research and stay sharp out there!

TSLA daily trading (option)1. Key Level: TSLA was at a risky spot — it hit resistance and has been moving sideways, with about a 50/50 chance of going up or down.
2. Strategy Triggered: It dropped and then retested the 50 SMA on the H1 chart.
3. Pattern Observed: An uptrend breakdown.
➡️ I think TSLA could go up in the long term (next 1–2 weeks), but we might see a red candle tomorrow or Monday

Tesla Grabbing Liquidity Market Context 🚩
1-Month Move: +7.3% (from $261.30)
1-Year Move: +45.6% (from $192.50)
Technicals
RSI: ~68.4 (nearing overbought )
Moving Averages: Above 20-day, 50-day, and 200-day MAs (uptrend, but showing signs of exhaustion )
MACD: Bearish crossover forming (momentum fading, potential pullback )
Trade Setup
Instrument: TSLA ❌
Direction: PUT
Entry Price: $280.21
Take Profit 1 (TP1): $270.00 (~3.6% gain ) 🟢
Take Profit 2 (TP2): $260.00 (~7.2% gain ) 🟢
Expected Move: ~8–10% downward
Best AI Signals on the market.

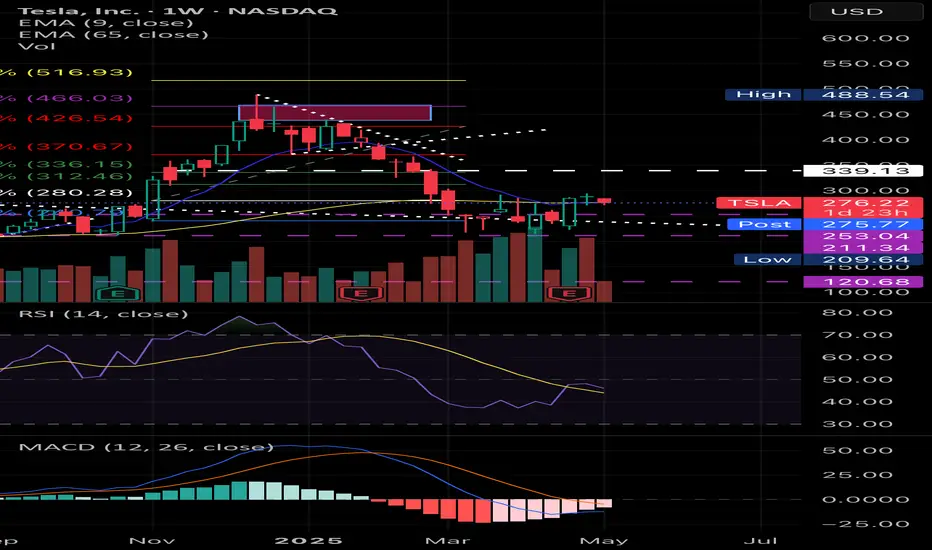
TSLA Eiffel Tower Not CompleteEiffel tower patterns are rare but very powerful TA structures when they develop.
They are very hard patterns to short since we can never know when the wave up ends. However, there is so much information we can extract from them during and after the collapse.
When they are rising and going vertical, and you happen to be in it. The benefits will be great! As the price action sucks in everyone all at once with virtually no sellers.
So, what info can we learn?
On the way up, when this is happening, you should have the ability to recognize it at some point without worrying if you got the top. Take your money and RUN!
Never try to get back in and try to chase it up!
Never try to short it, thinking it is too high, this is the top!
When it tops out, never buy the dip! Bc you know how this structure will end.
Never buy based on some silly FIB or bc it's down too much!
Never buy the base thinking it will go back to new all-time highs, and it is now safe to get back in bc it will only keep going lower, more through time, frustrating you until you puke it up.
So remember this gimmicky sound bite.
"If they don't scare you out, they will wear you out!"
Ain't nobody got time for that! Your money has a much better place to be allocated to make you money instead of being fixated on a chart like this.
The reason people get stuck is bc the move provoked emotion! Then, when they get involved thinking they will be Buffett tomorrow from this one trade, they will experience Euphoria, sadness, anger etc., further provoking even more emotions to the point they become obsessed! Guessing, waiting, hoping, doubling down on and on...
Ask me how I know! hahaha!
While I made a lot of money shorting GME, here is an example of an Eiffel tower with many, many people that have this trading disease I just spoke about.
In conclusion, anyone who believes that TSLA will hit $1,000 blah blah blah and suckered into buying it. You now know you are being honey dicked by a bunch of armatures and bots on X. Beyond TSLA there are many such charts out there tight now that have formed the beginnings of ET. As such, you should know how to recognize it quickly and avoid the pitfalls out there.FYI I called the Top on TSLA ))
Click Like, Follow, Subscribe to learn much more about real macroeconomics and technical analysis. Let me help you navigate these crazy markets.
