Tesla - Technicals are pretty clear!🚨Tesla ( NASDAQ:TSLA ) respects the triangle:
🔎Analysis summary:
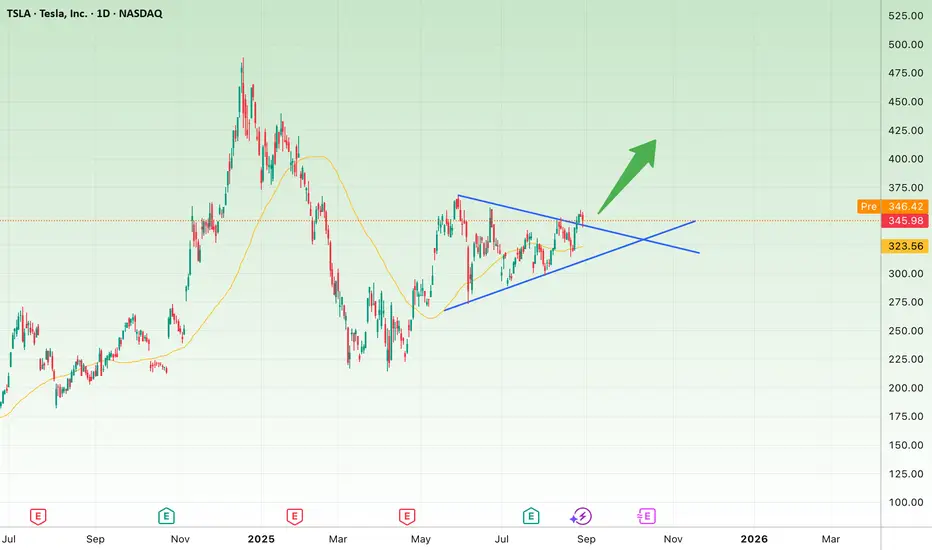
Ever since Tesla was listed on the Nasdaq, we saw perfect cycles playing out. Since 2021, Tesla has once again been consolidating within a bullish triangle pattern. Therefore with the recent bullish break and retest, it becomes more and more likely that Tesla will break out soon.
📝Levels to watch:
$400, $250
SwingTraderPhil
SwingTrading.Simplified. | Investing.Simplified. | #LONGTERMVISION
TSLA trade ideas

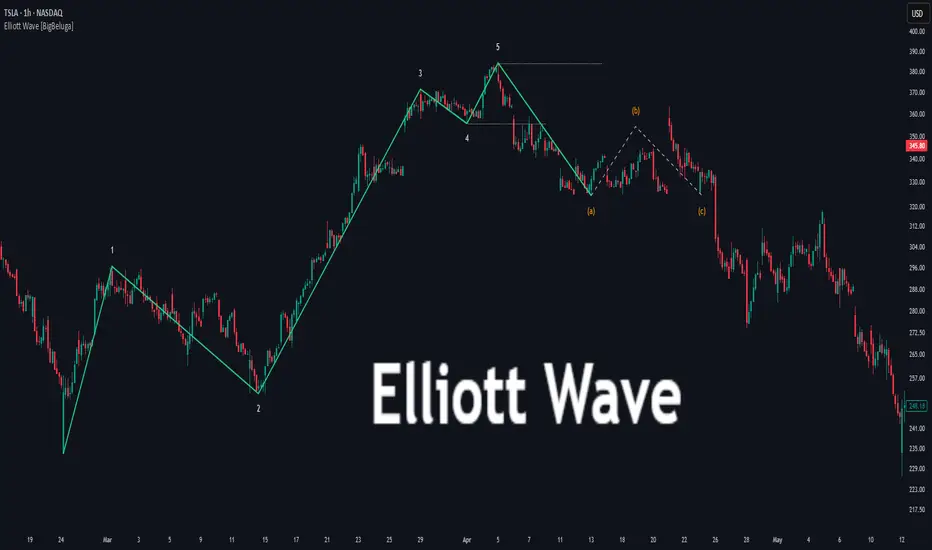
Mastering the Elliott Wave Pattern🔵 Mastering the Elliott Wave Pattern: Structure, Psychology, and Trading Tips
Difficulty: 🐳🐳🐳🐋🐋 (Intermediate+)
This article is for traders who want to understand the logic behind Elliott Waves — not just memorize patterns. We’ll cover the structure, trader psychology behind each wave, and practical tips for applying it in modern markets.
🔵 INTRODUCTION
The Elliott Wave Theory is one of the oldest and most respected market models. Developed by Ralph Nelson Elliott in the 1930s, it proposes that price doesn’t move randomly — it follows repeating cycles of optimism and pessimism.
At its core, Elliott Wave helps traders see the bigger picture structure of the market. Instead of focusing on one candle or one setup, you learn to read the “story” across multiple waves.
2021 BTC TOP
TESLA Stock
🔵 THE BASIC 5-WAVE STRUCTURE
The foundation of Elliott Wave is the Impulse Wave — a 5-wave pattern that moves in the direction of the trend.
Wave 1: The first push, often driven by smart money entering early.
Wave 2: A correction that shakes out weak hands but doesn’t retrace fully.
Wave 3: The strongest and longest wave — fueled by mass participation.
Wave 4: A pause, consolidation, or sideways correction.
Wave 5: The final push — often weaker, driven by late retail traders.
🔵 THE CORRECTIVE 3-WAVE STRUCTURE
After the 5-wave impulse comes a 3-wave correction , labeled A-B-C.
Wave A: First countertrend move — often mistaken as a dip.
Wave B: A false rally — traps late buyers.
Wave C: A stronger decline (or rally in bearish market), often equal to or longer than Wave A.
Together, the impulse (5) and correction (3) form an 8-wave cycle .
🔵 PSYCHOLOGY BEHIND THE WAVES
Each wave reflects trader psychology:
Wave 1: Smart money positions quietly.
Wave 2: Retail doubts the trend — “it’s just a pullback.”
Wave 3: Mass recognition, everyone piles in.
Wave 4: Profit-taking and hesitation.
Wave 5: Final retail FOMO.
A-B-C: Reality check, trend unwinds before cycle resets.
🔵 TRADING WITH ELLIOTT WAVES
1️⃣ Spot the Trend
Identify whether the market is in an impulse (5-wave) or correction (A-B-C).
2️⃣ Use Fibonacci for Validation
Wave 2 usually retraces 50–61.8-78.6% of Wave 1.
Wave 3 often extends 161.8% of Wave 1.
Wave 5 is often equal to Wave 1.
3️⃣ Trade the Highest-Probability Waves
Wave 3 (trend acceleration) and Wave C (correction completion) are often the cleanest opportunities.
4️⃣ Don’t Force It
Not every market move is Elliott Wave. Use it as a framework, not a rulebook.
🔵 COMMON MISTAKES
Over-labeling: Trying to force waves where they don’t exist.
Ignoring timeframes: Waves may look different across scales.
Trading every wave: Not all waves are high-probability setups.
🔵 CONCLUSION
The Elliott Wave Theory isn’t about perfection — it’s about perspective. It helps traders understand market cycles, recognize crowd psychology, and anticipate major turning points.
Use Elliott Wave as a map , not a prediction tool. When combined with confluence — volume, liquidity zones, or trend filters — it becomes a powerful edge.
Do you trade with Elliott Waves? Or do you think they’re too subjective? Share your experience below!
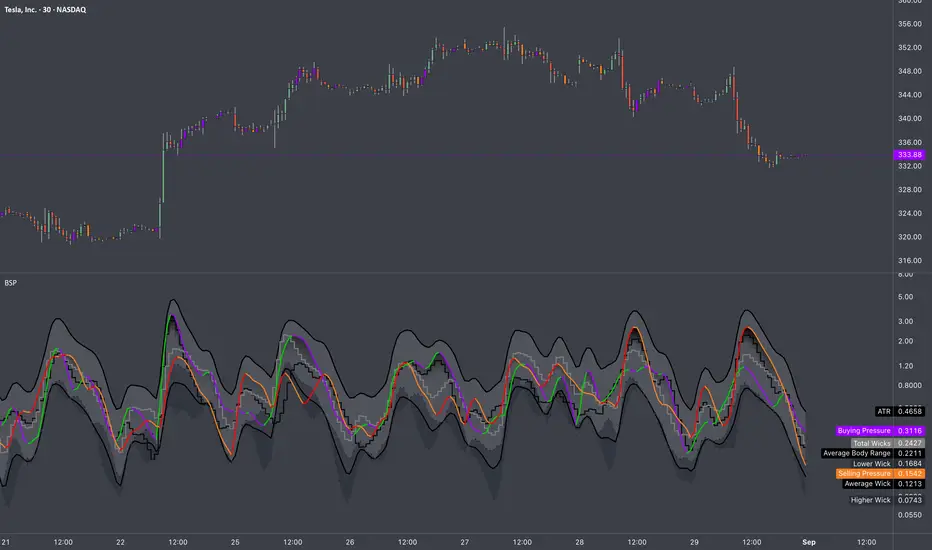
Candle Metrics: BSP Guide🏛️ RESEARCH NOTES
Buying & Selling Pressure measures the internal dynamics within a candlestick that shapes the trends. It dissects each OHLC range into distinct components made of Body Range, Higher & Lower Wicks, making it possible to quantify bullish & bearish parts of bar range. BSP doesn’t just point direction, it reveals magnitude - how much buyers or sellers injected into the move, and whether that push is accelerating or running out of steam.
Unlike Average %Δ , which uses separate conditional averaging by "count", BSP processes candles through periodic averaging that makes it more responsive for important transitions like: divergence from volatility benchmarks. incentive change (spotting early reversals after impulsive move), filtering false breakouts, confirming trend strength, etc.
⚖️ Candle Metrics
Buying Pressure (BP)
Represents the degree of upward displacement relative to prior reference points.
🟢 Rising BP: Signals growing demand absorption and accumulation, often preceding sustained advances.
🟣 Falling BP: Indicates waning participation from buyers; persistent declines while price rises suggest trend fatigue and elevated risk of retracement.
Selling Pressure (SP)
Captures downward displacement relative to highs and prior closes.
🔴 Rising SP: Reflects heightened distribution activity, consistent with institutional supply or hedging flows.
🟡 Falling SP: Suggests sellers are withdrawing liquidity; commonly observed near troughs as downside momentum exhausts.
Average True Range (ATR) Rising ATR = higher volatility, falling ATR = calm markets. High BP in low ATR = stealth accumulation.
Body Range (BR) Large bodies show conviction, small bodies = indecision. Strong BR + rising BP = solid bullish trend.
Higher Wick (HW) Long HW means rejection at highs (supply). Falling HW means buyers are holding gains.
Lower Wick (LW) Long LW means rejection at lows (demand). Falling LW signals less defense from buyers.
Total Wicks (TW) More wick length = intrabar battles. Expansion of TW with small bodies often precedes reversals.
Average Wick (AW)
Rising AW = more volatility both ways. Falling AW = cleaner, directional trend.
Darkened Tops
Tracks the strongest side (BP or SP) over the lookback period. Its primary function is to dynamically highlight moments of extreme pressure. When either the Buying or Selling Pressure value reaches the level, the tops would . This provides an immediate visual cue for:
Black Colored Plot: A signal that the current buying or selling pressure has hit a significant level relative to recent history, often pointing to climactic activity or a potential exhaustion point.
◇ Practical Interpretation
Trend Confirmation BP ↑, SP ↓, BR ↑, ATR steady → sustainable directional advance.
Exhaustion BP ↓, SP steady or rising, HW ↑ = buyers tiring at resistance, overextended into supply.
Accumulation BP ↑, LW ↑, TW ↑ but ATR low = stealth buying before breakout.
Distribution SP ↑, HW ↑, TW ↑ = sellers unloading into strength. supply emerging into strength, caution warranted.
Tesla Short: Expecting Wave 3 of 3 DownIn this video, I go through the Elliott Wave Analysis for Tesla in detail and talk about how the final corrective wave may not be ideal but is still al valid place for a short. In essence, I think that Tesla should be going for a wave 3 of 3 down that will see it going to $273 for a short-term target and even below $214 based on the general market condition that I have previously discussed.
The stop loss for this idea is above 349.54 but I recommend setting it higher around 351.85.
Good luck!

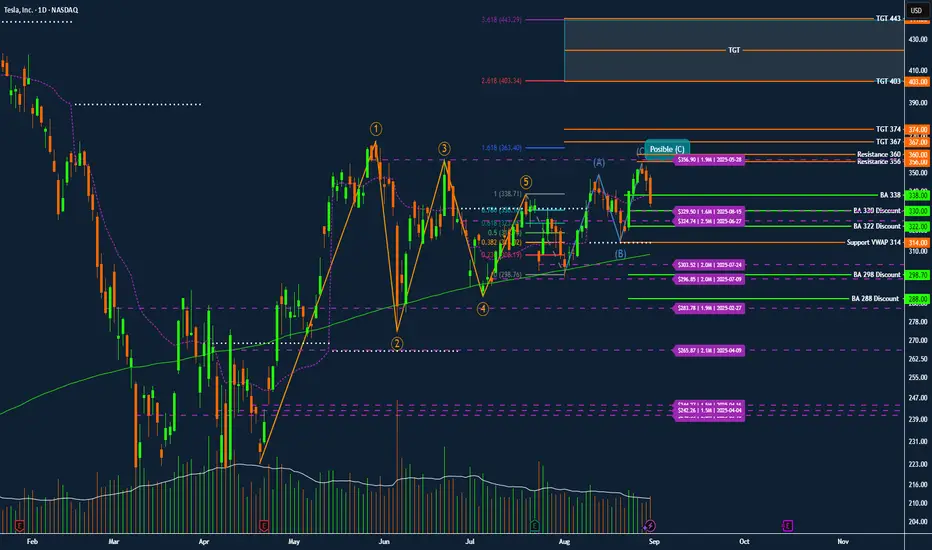
TSLA TESLA Institutional Roadmap for September Discount ZoneTesla NASDAQ:TSLA – Institutional Roadmap for September: Discount Zones, Breakout Triggers, and Squeeze Targets
Tesla continues to trade as one of the clearest institutional battlegrounds in the market. The footprints in option open interest, dark pool levels, and anchored VWAP create a very precise map for swing traders who want to follow the flow rather than fight it.
Elliott Wave Context
Tesla completed a clean 1–5 impulse wave earlier in the year. The stock has since been retracing in an A–B–C corrective structure, with wave (C) still tentative. The rejection near 348–350 matches heavy open interest and serves as a possible end of (C). However, the high-volume sell candle at 333 suggests the correction may continue lower into discount zones before the next advance.
Institutional Discount Zones
330–332: first defense level, with recent dark pool support
322: deeper discount aligned with the 0.618 retracement
314: anchored VWAP level, a frequent institutional reload zone
298–300: July dark pool activity and strong confluence support
288: extreme discount zone from February
Breakout Triggers
BA 338: first bullish-above confirmation trigger, but only valid if defended by volume
356–360: the real battleground. Massive call open interest is stacked here. A clean break above confirms institutional participation
Upside Targets
367–374: first expansion target and resistance magnet
403: Fibonacci 2.618 extension
443: Fibonacci 3.618 extension
467: Fibonacci 4.236 extreme target if momentum continues
Flow and Volume Notes
Options flow shows concentrated put open interest between 300–320, confirming institutional defense of that floor. Call interest is stacked heavily at 350–360, which explains the recent rejection zone. The latest sell-off candle came with above-average volume, reinforcing the probability of a deeper retest into 330–322 or even 314 VWAP.
Trading Roadmap
If Tesla holds 330–332, expect a potential reversal with BA 338 as confirmation.
If 330 breaks, expect a move into 322 or 314, and a flush to 298 remains possible.
If 356–360 is reclaimed with volume, the squeeze path opens toward 367–374.
Breaking above 374 accelerates directly into 403 and later 443.
Conclusion
Tesla remains a classic institutional shakeout pattern rather than a breakdown. The map is clear: watch the discount zones for accumulation, use BA 338 and the 356–360 battleground as confirmation triggers, and follow the roadmap toward 374, 403, and 443 once the breakout validates. Patience is edge. Institutions will reload near VWAP and dark pool levels, while retail chases 350. Follow the Darkpools not the noise.
TESLA RISING SUPPORT|LONG|
✅TESLA is trading in an uptrend
Along the rising support line
Which makes me bullish biased
And the pair is about to retest the rising support
Thus, a rebound and a move up is expected
With the target of retesting the level above at 350$
LONG🚀
✅Like and subscribe to never miss a new idea!✅

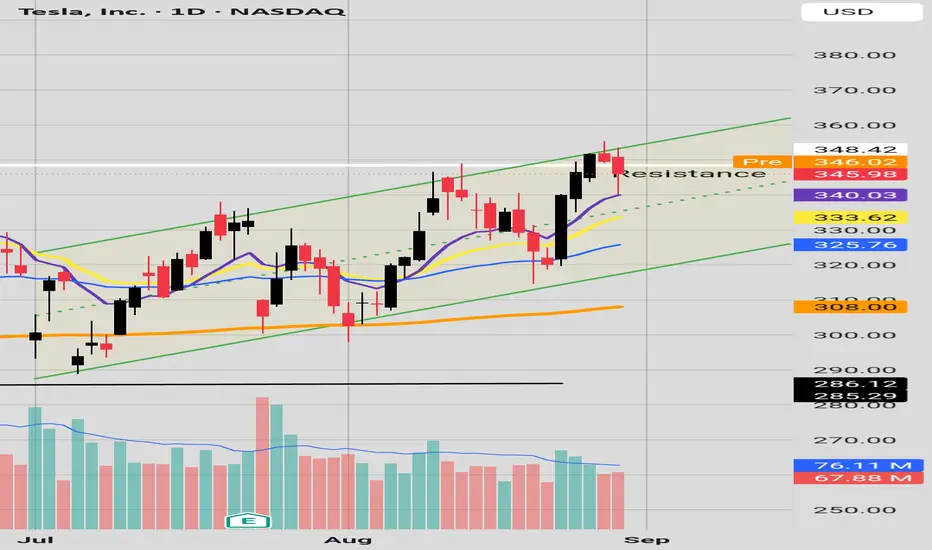
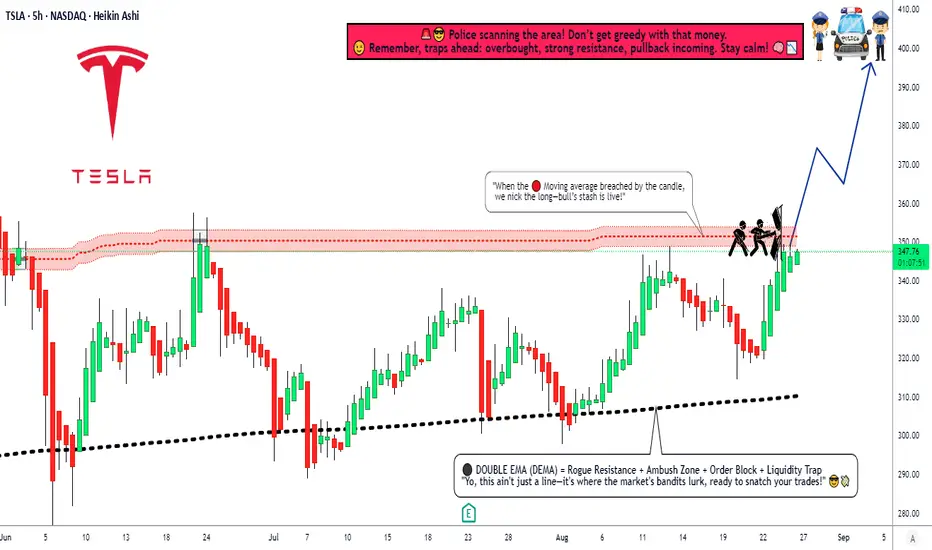
Parallel ChannelWe have Tesala facing resistance on the daily at 345.98 and also resistance in the upward parallel channel. However, the EMA's are lined up nicely 10 in purple 21 in yellow and 50 in blue and 200 in orange. If we get a pullback, hopefully it would just be to the 21 EMA 333.62 and maybe the pull back is over?Let's see if we get a bullish candle on the 10 EMA.
Have a nice day
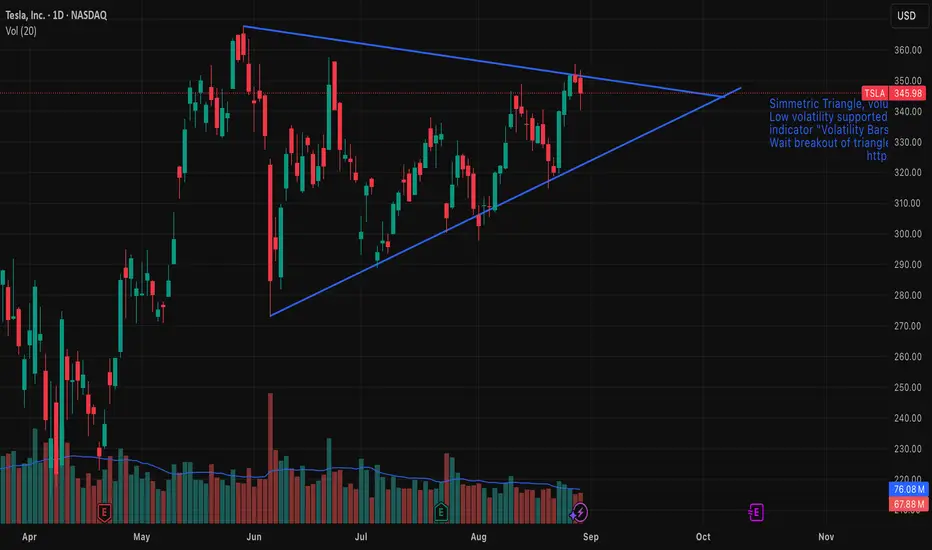
Tesla (TSLA) Breaking Out – Is the Next Bull Run Starting?📊 TSLA Technical Analysis (Daily Timeframe)
After a period of consolidation inside a Symmetrical Triangle, Tesla’s price is now showing a potential breakout to the upside. This could be an early signal for the beginning of a new bullish wave.
🔹 Key Support: $323 – $325
🔹 Next Resistances: $375 and, if broken, higher targets at $400 – $420
The 50-day moving average is currently supporting the uptrend, and a confirmed close above the $346 level would strengthen the bullish outlook.
⚠️ However, if the price fails and breaks below $323, the bullish scenario may lose validity and a corrective move could follow.
Long way to go - BEARISHNASDAQ:TSLA still has a long runway before robotaxis deliver meaningful revenue or global car sales improve (if at all). Lower rates are a prerequisite and execution from Musk remains critical. Despite the chatter, this is not a bullish breakout. It’s a large symmetrical triangle forming as we enter seasonally weak months, with global EV sales slowing, robotaxi rollout lagging, and ongoing political overhang.

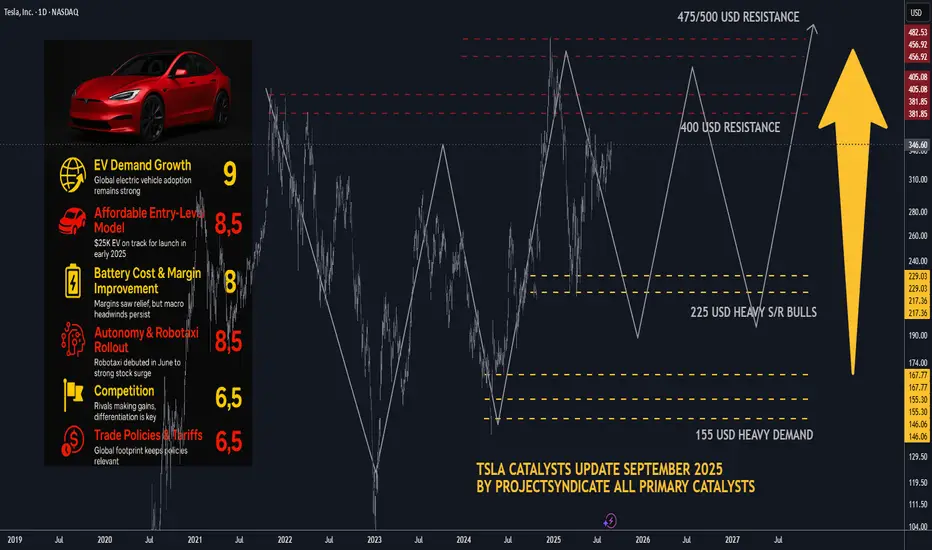
TSLA Catalysts Ranking: September 2025 update and Path ForwardHere's an updated/revised outlook for TSLA including all the primary
catalyst ranking and analyst ratings and overview of latest developments
this was updated for September 2025 with all the viable market data.
🤖1. Autonomous & Robotaxi Execution (↑ from 8.5 to 9/10)
• Why it matters: Tesla officially launched its Robotaxi service in Austin on June 22, 2025, deploying a small fleet of 10–20 invite-only Model Ys operating within a geofence and featuring human safety monitors..
• The stock rallied impressively—up 9%–11% on launch day..
• Regulatory scrutiny intensified as the NHTSA launched probes into delayed crash reporting and other safety concerns..
• Musk also touted FSD v14 as 2–3× safer than humans, with v15 aiming to be 10× safer—but cautioned debugging would take "several months.".
• Why the bump to 9/10? The real-world rollout is finally underway, drawing heavy investor focus—even amidst safety questions.
________________________________________
🌍2. EV Demand Growth & Geographic Recovery (holds at 9/10)
• Despite a 13% year over year global sales drop in H1 2025, future demand hinges on Amazon of lower priced models and tax credit extensions..
• Strong upward investor sentiment: TSLA is up 54% over the past year, despite being down ~16% YTD..
• Why still 9/10? Long-term EV momentum remains solid; a rebound may follow new launches or incentive shifts.
________________________________________
💸3. U.S. EV Tax Credits & Incentives (↑ from 6 to 7.5/10)
• The $7,500 EV tax credit—set to expire September 30—has been extended: now, buyers can qualify with a signed purchase agreement, even before delivery..
• However, expiration still looms and could dampen demand..
• Why bump to 7.5/10? The extension buys breathing room and could stabilize near-term demand.
________________________________________
📉4. Fed & Interest Rates (↑ from 5 to 6.5/10)
• On August 22, Tesla led a mega cap tech rally (up 6%+) after Fed chair hinted at possible rate cuts—lower borrowing costs may aid EV financing..
• Why improved score? Lower rates remain a key catalyst for big-ticket items like EVs.
________________________________________
🎭5. Affordable Entry-Level Model / Next-Gen Platform (holds at 8.5/10)
• Musk revealed the upcoming affordable model may resemble a Model Y and could launch slower than expected post tax credit expiration..
• The “next gen” platform—including the so called “Model 2/Q” or Cybercab—targets mid 2025 production..
• With delays likely, expectations remain high but execution risk persists.
________________________________________
🔋6. Battery Cost & Margin Improvement (holds at 8/10)
• Q2 margins improved modestly, supported by cost cuts and energy business growth..
• Yet, regulatory credits continue to decline (–51%), pressuring margins..
________________________________________
🤖7. Energy & AI Upside (new 8/10)
• Tesla is doubling down on autonomy and energy. Musk highlighted robotaxi, energy storage, and its humanoid Optimus robot, slated for early 2026..
• Wedbush’s Dan Ives sees Tesla as an “embodied AI compounder,” while William Blair estimates self driving could be worth nearly $1 trillion..
• This iterative AI and energy focus is a compelling re-rating vector.
________________________________________
📊 8. Safety, Regulatory & Governance Risk (↑ to 7/10)
• NHTSA’s probe into crash-report delays, plus ongoing FSD safety concerns, elevate tail risk..
• Musk’s political entanglements have had adverse brand impacts; while stepping back from new political initiatives helped marginally, skepticism persists..
• Added governance scrutiny and Musk’s external ventures continue to weigh on sentiment.
________________________________________
🚩9. Competition & Global Sales Slump (holds at 6.5/10)
• EV rivalry heats up, and Tesla’s European and Chinese market share slumped significantly.
• Still a notable headwind.
________________________________________
✅10. Commodities & Raw Material Costs (holds at 5.5/10)
• Volatile raw material prices continue to affect margins; hedges help but don't eliminate the risk.
________________________________________
🚀11. Macro & Trade Policies (new 6/10)
• Tariff risks and global trade instability persist. Musk has warned of “rough quarters” ahead linked to these macro risks..
• Considered separately, worth tracking but less immediate than others.
________________________________________
Updated Catalyst Scorecard
Rank Catalyst Score
1 Autonomous & Robotaxi Execution 9
2 EV Demand Growth 9
3 Affordable Entry-Level Model 8.5
4 Battery Cost & Margin Improvement 8
5 Energy & AI Upside 8
6 U.S. EV Incentives 7.5
7 Safety, Regulatory & Governance Risk 7
8 Fed & Interest Rates 6.5
9 Competition & Global Sales Slump 6.5
10 Macro & Trade Policy Risks 6
11 Commodities & Raw Material Costs 5.5
________________________________________
📊Analyst Ratings & Price Targets (Updated)
• Median 12-month price target: ~$303–$307, implying slight downside from current ~$346..
• High-end bulls: Dan Ives (Wedbush) at $500; Benchmark raised to $475..
• Cautious voices: UBS remains bearish at $215, saying robotaxi upside may be priced-in..
• Wolfe Research: warns near-term earnings estimates are too optimistic, free cash flow may remain under pressure..
________________________________________
🔍Recent Headlines You Should Know
• Robotaxi launch in Austin, promoting optimism but drawing scrutiny..
• FSD & Optimus focus, backed by bullish commentary like “embodied AI compounder.”.
• EV credit tweak buys time for deliveries and demand..
• Fed hinting at rate cuts, offering cyclical lift..
• Q2 earnings miss on EPS and revenue, but autonomy/energy pushed narrative..
________________________________________
• Bull Case: Robotaxi and AI drive restore investor confidence, pushing targets toward $475–$500.
• Base Case: Steady but cautious—watch for execution on autonomous and cost-efficiency.
• Bear Case: Renewed delivery slumps, regulatory blowback, or failed rollout could weigh toward downside support in the $300–$330 range.
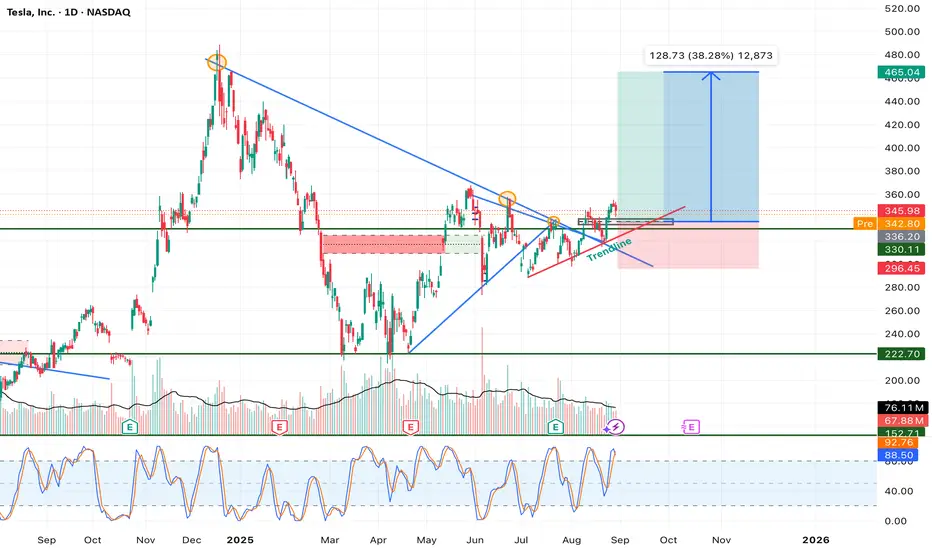
Tesla – Symmetrical Triangle Breakout With 38% Upside PotentialTesla (TSLA) has been consolidating for several months within a symmetrical triangle formation, bounded by a descending resistance trendline from the November 2024 high and an ascending support trendline from the April 2025 low. This consolidation has now resolved with a breakout above resistance, suggesting the start of a new bullish leg.
Technical Breakdown:
1. Symmetrical Triangle Formation:
• Price compressed into tighter ranges, with lower highs and higher lows converging.
• Breakout occurred above the descending trendline, confirming bullish bias.
2. Volume Confirmation:
• Breakout was accompanied by a noticeable uptick in buying volume, strengthening the validity of the move.
• Historical patterns show Tesla often rallies strongly after high-volume breakouts from consolidation zones.
3. Support & Resistance Zones:
• Immediate support: $336 (former resistance turned support, aligned with trendline retest).
• Stronger support: $296 (previous demand zone, key invalidation level).
• Resistance target: $465 (measured move from triangle breakout, aligning with prior swing levels).
4. Momentum Indicators:
• Stochastic RSI is rebounding from oversold territory, suggesting fresh buying momentum.
• MACD (not shown on chart but implied) likely supports bullish crossover given recent price action.
5. Risk-to-Reward Setup:
• Entry: $340–$345 zone after breakout retest.
• Stop Loss: Below $296 (breakdown invalidation).
• Target: $465 (38% upside potential from current levels).
• Risk/reward ratio favors long positions with significant asymmetry.
Trade Thesis:
The breakout from a well-defined symmetrical triangle suggests a continuation of Tesla’s mid-term bullish trend. The measured move projection points toward ~$465, representing a potential 38% rally from current prices. As long as price sustains above the $336–$340 support zone, bulls remain in control. A breakdown below $296 would invalidate this structure and open the door for a deeper retracement.
Conclusion:
Tesla has entered a critical bullish phase after months of consolidation. With volume confirmation, favorable risk-to-reward, and momentum recovery, the path of least resistance is higher. Upside targets sit near $465, with invalidation set at $296.
NASDAQ:TSLA
TSLA support $324.48 has to hold for longTSLA bounced off $35 range support this morning on 4 hour was oversold. Needs to hold $324.48 bottom of uptrend support to see wave 5 target of $426 otherwise the trade is no longer valid and will need to wait for another support and oversold condition to go long

What Is Symmetrical Distribution, and How Do Traders Use It?What Is Symmetrical Distribution, and How Do Traders Use It?
Symmetrical distribution is a key concept in market analysis, helping traders assess price behaviour and volatility. When price movements are evenly distributed around a central point, it can provide insights into potential market trends. This article explores what symmetrical distribution is, how it compares to other price patterns, and how traders use it in strategies like mean reversion to refine their market approach.
What Is a Symmetric Distribution?
The symmetric distribution definition states that data points are evenly spread around a mean, meaning price movements exhibit balance over time. In simple terms, if price movements form a symmetrical shape when plotted on a chart, it suggests that past price behaviour has been balanced, with roughly equal deviations on either side of the average. This balance is supposed to help traders analyse price trends and volatility.
One of the most well-known symmetrical distribution examples is the normal distribution, often visualised as a bell curve. In markets, this means prices are more likely to cluster around the average and become less frequent as you move further away. For example, if a stock has a mean daily return of 0.5%, most days are believed to see returns close to that figure, while extreme price moves—both positive and negative—will be much rarer.
Symmetrical distribution plays a key role in statistical analysis and quantitative trading. It helps traders assess the probability of certain price movements occurring, particularly when using models that rely on historical data.
How Traders Use Symmetrical Distribution in Market Analysis
Traders use symmetrical distribution to analyse price behaviour, identify potential trading opportunities, and refine their strategies. When price movements are evenly distributed around a central point, it provides a structured way to assess market conditions. This concept is particularly useful in mean reversion strategies.
Mean Reversion Strategies
Symmetrical distribution suggests that prices tend to fluctuate around an average, making mean reversion a widely used approach. Traders applying this strategy assume that when an asset moves significantly away from its mean, it is likely to return over time. Bollinger Bands and moving averages are commonly used to measure price deviations and identify potential turning points. This is particularly relevant in markets with balanced volatility, where extreme price moves are less frequent.
Identifying Market Conditions
Analysing whether a market follows a symmetrical distribution can help traders determine which strategies might be effective. In markets where price movements are balanced, traders may focus on range-bound approaches. In contrast, when distributions become skewed, momentum and trend-following strategies might be more suitable. Recognising these shifts allows traders to adapt their methods to changing market conditions.
How to Identify a Symmetrical Distribution
Identifying a symmetrical distribution in market data involves analysing price behaviour to determine whether movements are evenly spread around a central value. While markets don’t always follow perfect symmetry, traders use statistical tools and visual techniques to assess whether a price distribution aligns with this pattern.
Histogram Analysis
A histogram is one of the simplest ways to check for symmetry in price movements. By plotting historical returns or price changes on a frequency chart, traders can see whether data points cluster evenly around the mean. If the left and right sides of the distribution mirror each other, the market may be exhibiting a symmetrical pattern.
Histograms can also reveal uniform distributions, where all values occur with equal probability, forming a flat graph rather than a bell curve. A symmetric and uniform graph can help distinguish between these two patterns—while a uniform distribution shows no central clustering, a symmetric distribution forms a peak around the mean. Recognising whether a market follows a symmetric or uniform structure helps traders determine which statistical tools are most relevant for analysis.
Statistical Measures: Mean and Standard Deviation
Symmetrical distributions tend to have a mean (average) return that sits at the centre of price movements, with standard deviations determining how far prices typically move from that mean. If price fluctuations are evenly distributed around the mean, it suggests a balanced market where extreme moves are less common.
Skewness and Kurtosis
Two key statistical measures help traders confirm symmetry:
- Skewness quantifies how unevenly data points are distributed around the mean. A value close to zero suggests a symmetrical distribution, while a positive or negative skew indicates an imbalance.
- Kurtosis measures how frequently extreme price movements occur. A symmetrical, normally distributed market typically has a kurtosis value near three.
Visualising with Moving Averages
When plotted on a chart, symmetrical price behaviour often aligns with a stable moving average, where price deviations are relatively even on both sides. In contrast, a market with consistent upward or downward bias may show clear asymmetry.
Symmetrical Distribution vs. Other Market Distributions
However, markets don’t always move in a balanced way. While symmetrical distribution means price movements are evenly spread around a central point, real-world trading often shows skewed distributions, where prices are more likely to move in one direction than the other. Understanding the difference is key to assessing market behaviour.
A positively skewed distribution means there are more small downward price moves, but the occasional sharp rally pushes the average return higher. This often happens in growth stocks or high-volatility assets, where losses are frequent but gains can be explosive. On the other hand, a negatively skewed distribution occurs when prices drift upwards gradually but occasionally experience sudden drops. This is common in carry trades, where traders potentially earn small returns over time but risk significant losses during market shocks.
Skewed distributions challenge the assumption that markets follow normal distribution patterns. For example, many risk models assume a symmetrical spread of price moves, but in reality, market crashes and parabolic rallies occur far more often than a normal distribution would assume. This is why relying solely on symmetrical models can lead to underestimating risk in extreme conditions.
Traders who recognise whether a market is symmetrical or skewed can adjust their strategies accordingly. In a symmetrical market, mean reversion strategies could be more effective, while in a skewed market, trend-following approaches could perform better.
Symmetrical Distribution in Risk Management
Risk management relies heavily on statistical analysis, and symmetrical distribution plays a key role in estimating potential market movements. When price changes are symmetrically distributed, traders can use probability models to assess how far an asset is likely to move within a given timeframe.
Value at Risk (VaR) and Probability Modelling
One common application is Value at Risk (VaR), which estimates the maximum expected loss over a period based on historical price data. If potential returns follow a symmetrical distribution, traders can calculate the probability of losses exceeding a certain threshold. For example, in a normal distribution, around 95% of price movements fall within two standard deviations of the mean, allowing traders to set potential risk limits accordingly.
Risk-Reward Calculations
A symmetrical distribution also helps traders refine their risk-reward ratios. If price movements are evenly distributed, traders can estimate potential returns relative to potential losses with greater confidence. In markets where symmetry holds, a trader aiming for a 3:1 risk-reward ratio can assume that price fluctuations are balanced enough for this structure to be viable.
Position Sizing and Stop Placement
By understanding the distribution of price movements, traders can potentially improve position sizing. If historical data suggests symmetrical price behaviour, traders may adjust their position sizes based on expected volatility. Similarly, stop-loss levels might be set relative to the standard deviation of past price movements, ensuring that exits are placed within a statistically reasonable range.
Limitations and Challenges
While symmetrical distribution provides a structured way to analyse price movements, real-world markets rarely follow a perfect balance. External factors, market psychology, and liquidity shifts often distort price behaviour, making it important for traders to recognise the limitations of relying solely on symmetrical models.
Market Skew and Imbalances
Many assets, especially stocks and commodities, exhibit skewed distributions due to long-term trends, supply-demand imbalances, or macroeconomic factors. Price movements often lean in one direction rather than forming a perfect bell curve.
Impact of News and Events
Unexpected events—such as central bank decisions, earnings reports, or geopolitical developments—can cause sudden price moves that disrupt symmetrical patterns. These events create fat tails, where extreme moves occur more frequently than a normal distribution would suggest.
Volatility Clustering
Markets tend to experience periods of high and low volatility in clusters, rather than maintaining a steady distribution. Symmetrical models often underestimate the likelihood of extreme price swings, leading to miscalculations in risk assessment.
Liquidity and Order Flow Distortions
Large institutional orders and algorithmic trading can cause short-term price imbalances, breaking the assumption of symmetrical price behaviour. These distortions can lead to misleading statistical signals.
The Bottom Line
Symmetrical distribution provides traders with a structured way to analyse price movements, assess volatility, and refine strategies. While markets don’t always follow perfect symmetry, understanding when and how these patterns appear may support your trading analysis.
FAQ
What Is Symmetrical Distribution?
Symmetrical distribution refers to a data distribution where values are evenly spread around the mean. In financial markets, this means price movements are balanced, with equal-sized fluctuations on both sides of an average value.
What Is an Example of Symmetric Data?
A common symmetrical data example is the normal distribution, where most data points cluster around the mean, and extreme values occur less frequently. In trading, an asset with daily potential returns that are equally distributed above and below the mean exhibits symmetry.
What Is the Difference Between Uniform and Symmetric Distribution?
When comparing uniform vs symmetric distribution, the key difference is that a uniform distribution gives each value an equal probability with no central clustering. A symmetrical distribution can have values clustered around the mean.
What Is the Difference Between Symmetrical Distribution and Normal Distribution?
A normal distribution is a common symmetric distribution example, creating a bell-shaped curve. While all normal distributions are symmetrical, not all symmetrical distributions follow the strict characteristics of a normal distribution.
This article represents the opinion of the Companies operating under the FXOpen brand only. It is not to be construed as an offer, solicitation, or recommendation with respect to products and services provided by the Companies operating under the FXOpen brand, nor is it to be considered financial advice.
TSLA: Rising ChannelUnless some super positive sentiment comes out over the long weekend, I think we will hit that $325 support. Maybe even go below it during next week.
As long as we close above $325 for the week or so, We are cleared to head back up within the channel.
Tesla investors need to understand that until we see meaningful change to revenue, Tesla will continue to chop around. That's how things will be on the hourly, daily, and weekly chart. 2026 '27, '28... Just keep buying and accumulate. Just sit and wait. You're future self will kick you for trying to play this any other way.

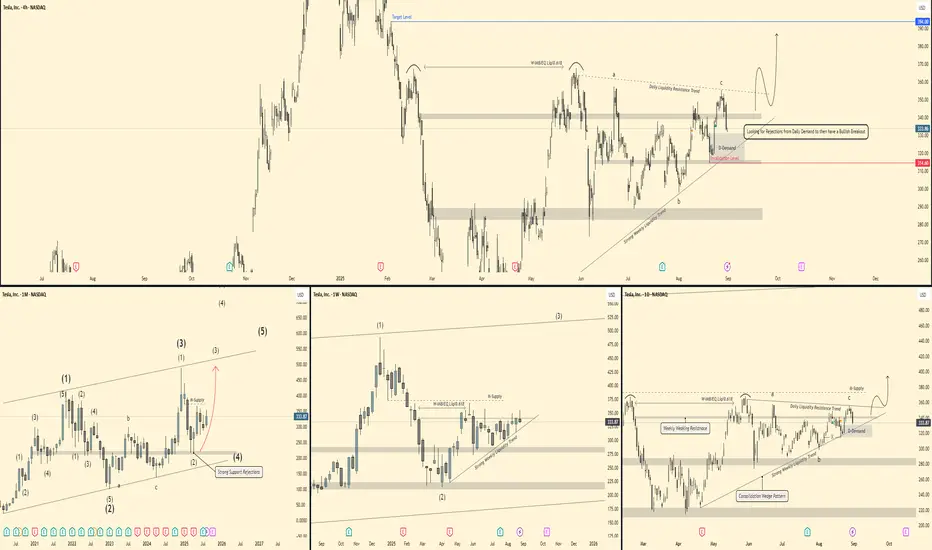
Tesla - Mutli-timeframe breakdown 🕰 Monthly View
Price is respecting a long-term ascending channel.
Strong rejections from support confirm bullish momentum.
Current wave count suggests we are working through a larger impulsive structure – potential for Wave (3) continuation higher.
If momentum holds, upside could target the 450–500 zone in the longer run.
📆 Weekly View
Structure shows a 3-wave correction complete (ABC) into demand.
Price has tapped weekly demand + liquidity trendline.
Currently bouncing, with a breakout potential toward 375–400 (supply zone).
Breakout of the wedge pattern would confirm strength and continuation higher.
📅 Daily View
Price is reacting off Daily Demand (≈320–325 zone).
Strong liquidity resistance trend overhead (≈355–365).
If rejections hold and demand stays valid, a bullish breakout setup forms → target near 390–400.
Invalidation if we close below 314 (daily demand break).
⏱ 4H View
Local liquidity sweep into demand.
Bullish scenario: push toward 350–355 short-term.
Watch for confirmation: rejection candles + momentum shift needed before entry.
🎯 Bias & Trade Idea
Bias: Bullish (buy from demand)
Entry Zone: 320–330 (Daily Demand)
Targets:
Short-term → 355
Mid-term → 390–400
Invalidation: Daily close below 314
⚠️ Risk Note
Tesla is highly volatile. Stick to clear confirmations at demand before entry, and manage risk tightly below invalidation.
TSLA LongTesla was going through symmetrical pattern triangle and price all above EMAs. This setup gives push price towards upside. Long upside for now.

Tesla (TSLA) — Symmetrical Triangle Breakout IdeaSummary
Pattern: Symmetrical triangle on daily chart.
Expected timeframe for breakout: Within 1–2 weeks.
Targets: $367 on an upside breakout; $273 on a downside breakout.
Risk management: Use a stop-loss just outside the triangle after breakout confirmation; position size per your risk rules.
Setup & Rationale
A well-defined symmetrical triangle has formed on TSLA’s price action, characterized by converging trendlines connecting lower highs and higher lows. Volume has contracted inside the pattern, consistent with consolidation. Symmetrical triangles are neutral continuation/reversal patterns; the breakout direction provides the trading signal.
Key technical points:
Price is approaching the apex, increasing the likelihood of a decisive breakout in the next 1–2 weeks.
Volume decline during the consolidation and a volume spike on breakout would confirm conviction.
The breakout should be taken after a daily close beyond the upper or lower trendline (or after a retest), not merely intraday probes.
Entry Criteria
Upside trade: Enter long on a daily close above the upper trendline (or on a confirmed retest).
Downside trade: Enter short on a daily close below the lower trendline (or on a confirmed retest).
Targets & Measurement
Measure the pattern height (vertical distance between the initial high and low of the triangle) and project it from the breakout point.
Upside target (projected): $367.
Downside target (projected): $273.
Adjust targets proportionally if you use a measured move from the actual breakout point rather than the pattern’s maximum height.
Stops & Risk Management
Place stop-loss slightly outside the opposite trendline or beyond a recent swing point to avoid false breakouts.
Preferred approach: fixed-risk percent per trade (e.g., 1–2% of portfolio) and scale position size accordingly.
Consider tightening stops to breakeven after price clears ~50% of the distance to the target.
Confirmation: daily close beyond trendline plus above-average volume (up or down depending on direction).
Symmetrical triangles are neutral; false breakouts occur. Wait for confirmation.
News, earnings, or market-wide events can invalidate technical setups quickly—monitor catalysts.
Adjust targets/stops if volatility expands or if the breakout lacks volume confirmation.
TSLA Breakout Play: Time to Steal Some Profits?🚨 TESLA INC (TSLA) HEIST PLAN - BULLISH SWING/Day LAYUP! 🚨
Yo, Thief OG's! 🐱👤🤑 Time to swarm the TSLA vault. The blueprint is set for a major bullish score. Our intel says the cops (bears) are losing their grip. Let's get this money! 💰💸✨
🎯 THE MASTER PLAN: BULLISH BREAKOUT (PENDING ORDERS)
Based on the Thief Trading Style™ technical analysis, we're plotting a bullish heist on TSLA. We wait for the breakout confirmation, then we strike with precision using our layered entry strategy.
Asset: TESLA INC (TSLA)
Trade Type: Swing / Day Trade
Bias: BULLISH ⬆️⚡
📍 ENTRY: THE HEIST INITIATES (SET YOUR ALARMS! ⏰)
Primary Entry: Breakout and close above $355.00 ⚡
THIEF'S LAYERED ENTRY STRATEGY: 🎯
Don't go all in at one price! We use multiple limit orders to layer into the position after the breakout confirms the move. This is how the pros (and thieves) do it!
Layer 1: Breakout Entry @ $355.00
Layer 2: Pullback Entry @ $350.00
Layer 3: Pullback Entry @ $345.00
Layer 4: Pullback Entry @ $340.00
Layer 5: Pullback Entry @ $335.00
(You can add more layers based on your own capital and risk appetite, you savage!)
📌 IMPORTANT: SET A TRADINGVIEW ALARM at $355.00! This is your signal that the heist is a GO! Don't get caught sleeping. 🛌💤
🛑 STOP LOSS: THE ESCAPE ROUTE
Thief SL for Breakout Entry: $320.00
⚠️ HEAR ME, HEAR ME! Dear Ladies & Gentleman (Thief OG's), adjust your SL based on your own strategy & risk! I am not your financial advisor; I'm just the guy with the blueprint. 🗺️ Place your SL ONLY AFTER the breakout happens. Protect your capital at all costs!
🎯 TARGET: CASH OUT & VANISH
Primary Target: $400.00 🚀
The police barricade is thick up there! 🚓🚧 Once the money is in the bag, don't get greedy! Escape with the stolen profits before they catch you!
Note: Dear Thief OG's, I am not recommending you use only my TP. Take profits at your own risk and based on your own analysis. Secure the bag when YOU feel comfortable! 💼🔥
💎 THIEF'S FINAL WORDS:
This is not a gamble; it's a calculated heist. Follow the plan, manage your risk, and let's eat! 🍽️
Hit the LIKE button if you're riding with us! ✅
BOOST this idea to empower the thief community! 💪❤️
Follow for more daily heist plans! 🎯
Stay sharp, stay profitable, and remember... in the market, be a thief, not a victim! 🐱💻🚀
NASDAQ:TSLA #TradingView #StockMarket #TradingPlan #SwingTrading #DayTrading #Investing #Bullish #TESLA #ThiefTradingStyle
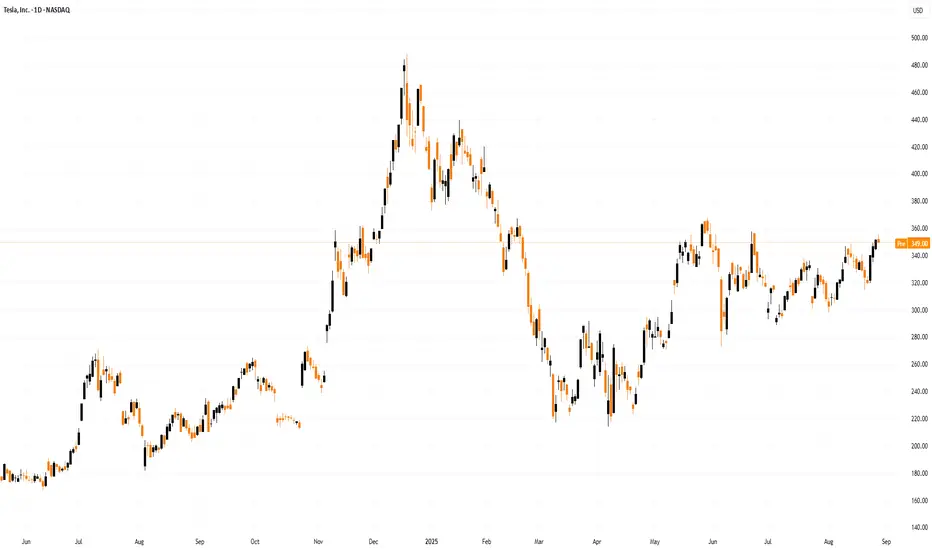
TESLA 28 AUG 2025 PRICE ACTIONPrice action for Tesla is here. I have clearly explained my plan on how to trade tesla considering every factor in market.
NOTE: OPTION WILL BURN YOUR CAPITAL

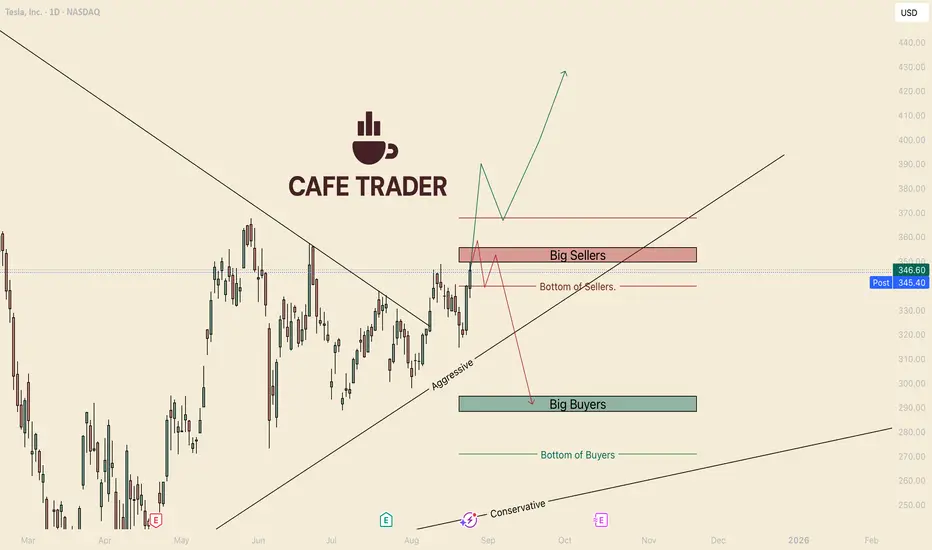
TESLA's Make it or Break it WeekHello I am the Cafe Trader.
Today we are taking another look at Tesla. Everyone knows what a beast this has been in the past, I am going to prep you on what to do when awakens.
As of today, we sit under the last strong seller before the 400's, breaking this and holding (a close above on a Friday) would make a strong case to test highs (minimum).
Overall, I still think there is a strong case for the downside, but this seller determines everything. This is due to the time we have been in the top of the range. So here are your two scenarios
Green Scenario
If Tesla can push through the strong seller zone (roughly 350–365) and actually close above it, then bulls would gain full control. That opens the door for a continuation move toward 400+.
If this happens, I will publish some trade ideas with a new chart.
Red Scenario
If This Seller continues to flush out these buyers, this could spark a large reaction to the downside. In that situation we would be looking for a move back into the big buyer zone around 290. A failure there could drag us all the way to the conservative trend line near 270.
Personally I lean short biased in the next 2-4 weeks, Very bullish over the next few years.
Hope you enjoyed, please DM or comment with questions or another stock you would like analyzed.
Happy Trading
@thecafetrader
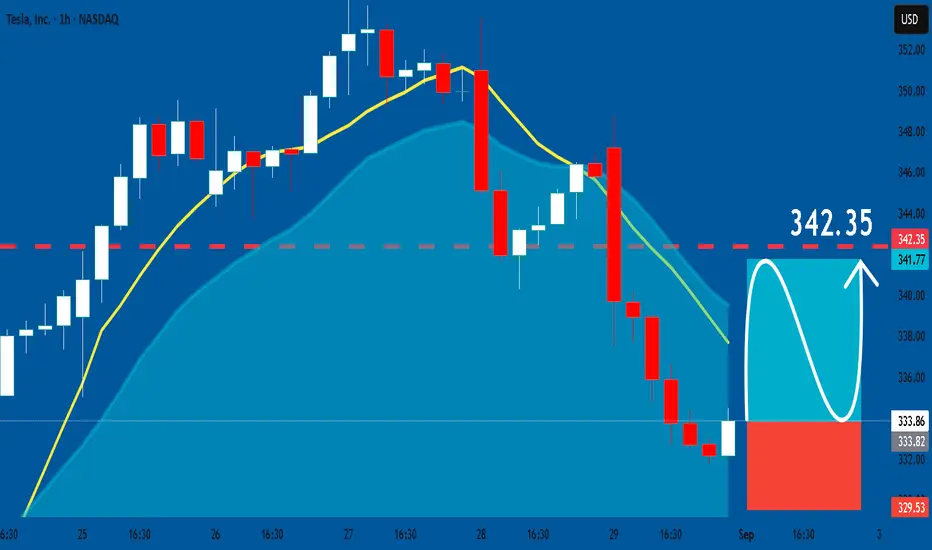
TESLA: Long Trade with Entry/SL/TP
TESLA
- Classic bullish setup
- Our team expects bullish continuation
SUGGESTED TRADE:
Swing Trade
Long TESLA
Entry Point - 333.86
Stop Loss - 329.53
Take Profit - 342.35
Our Risk - 1%
Start protection of your profits from lower levels
Disclosure: I am part of Trade Nation's Influencer program and receive a monthly fee for using their TradingView charts in my analysis.
❤️ Please, support our work with like & comment! ❤️
Tesla - The triangle is still valid!🚔Tesla ( NASDAQ:TSLA ) remains totally bullish:
🔎Analysis summary:
If we look at the chart of Tesla, we can see a very long term consolidation over the past four years. This, however, does not mean that the bullrun is over but rather preparing for the next bullish move. We just have to wait for the bullish ascending triangle pattern breakout.
📝Levels to watch:
$400
SwingTraderPhil
SwingTrading.Simplified. | Investing.Simplified. | #LONGTERMVISION

Heads Will Roll (Tesla Bankruptcy)Imminent bankruptcy in Tesla.
Deep fraud under investigation, shortly to be published.
