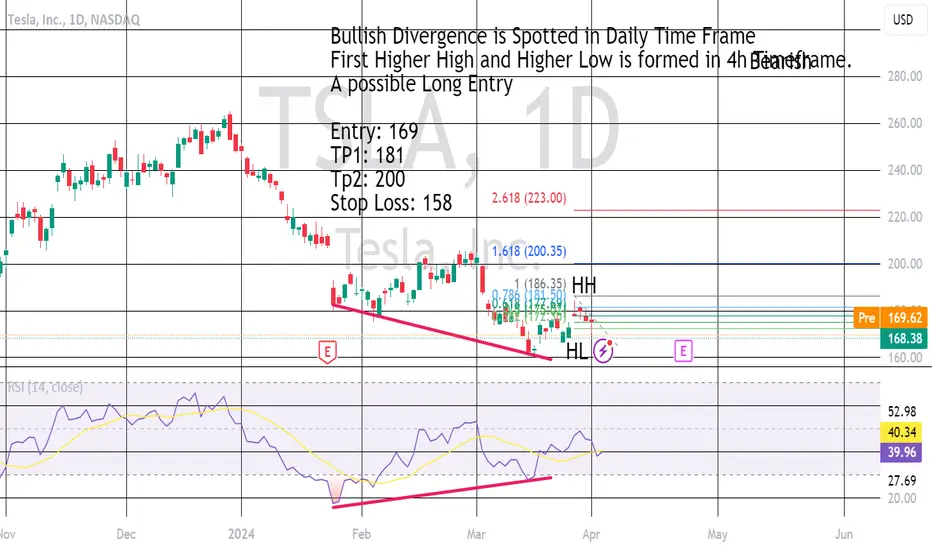
TESLA showed Bullish Divergence at Daily TimeframeTesla is showing a good recovery from its downward trend. A bullish Divergence at Daily TF and formation of HH and HLs at 4H TF indicating a possible long entry. This is not a Financial Advice. Please do your own research.
TSLA trade ideas
Tesla’s Technical Crossroads.“As we assess Tesla, Inc. (TSLA) through the lens of technical analysis, it is prudent to incorporate recent news and fundamental developments, yet our focus remains on the story told by the chart. The Ichimoku Cloud paints a picture of resistance overhead, with the price navigating below the cloud—a bearish signal. The conversion and base lines (not visible in the image but typically part of the Ichimoku setup) would provide additional context on short-term momentum.
Looking closely, a potential bullish signal is developing as the price is attempting to breach the cloud from below, which could suggest a change in trend if sustained. However, this bullish scenario must be taken with a pinch of skepticism, as the broader Ichimoku setup suggests bears are currently in control.
Transitioning to the RSI, we observe the momentum has been erratic, yet the recent uptick signals increasing buying pressure. It’s essential to monitor if the RSI can sustain above the mid-line (50 level), reinforcing the buyers’ resolve. Nevertheless, with the RSI hovering below 50 for a considerable period, the momentum has been predominantly bearish.
In light of the preceding analysis and considering Tesla’s news cycle, one might adopt a cautious stance. Should the price consolidate above the cloud, accompanied by a supportive RSI, one could argue for a bullish reversal. Conversely, failure to breach the cloud may reaffirm the bearish bias, and traders might seek opportunities to capitalize on potential pullbacks within the prevailing downtrend.
Investors and traders must be nimble, aligning their strategies with the evolving technical landscape and staying attuned to Tesla’s dynamic news flow, which can swiftly shift sentiment and, by extension, price action.

TSLATSLA price is supporting to good demand zone
The price made double bottom /4H frame
my target as shown on the chart
all the best
BR


TESLA: Bottom is being priced. $470 end of year possible.Tesla is bearish on all long term timeframes 1D, 1W and 1M. The lowest RSI is on the 1W technical outlook (RSI = 37.118, MACD = -15.730, ADX = 32.394), which is the chart we focus today on. The stock has been inside a Channel Down since the July 2023 High, which was Lower High on the LH trendline that started on the ATH. We have spotted a striking resemblance of that pattern with 2014-2016.
That pattern found support after the LH rejection on the 0.618 Fibonacci level and then rebounded aggressively to a new ATH on the 1.382 Fibonacci extension level from the pattern's Low. That rise was slightly greater than the last LH (+116.98% agains 91.32%). Tesla is on today's pattern very close to the 0.618 Fibonacci level, so we see it as a unique long term technical buy opportunity despite the recent negative fundamentals, which are being priced in since the start of the year.
If you don't want to target as high as the 1.382 Fibonacci extension, take a more 'modest' approach and go for the analogous +195.79% rise, same as the last LH rally (TP = $470.00). Unique long term buy opportunity indeed to buy the industry leader.
## If you like our free content follow our profile to get more daily ideas. ##
## Comments and likes are greatly appreciated. ##

a weekly price action after hour update - tesla #4Good Day and I hope you are well,
prev. outlook from 2024-03-13
Quote from my #3 Tesla update:
"tl;dr: do or die here at 170 for the bulls. If we break below the bear channel line, bulls covering will fuel this further. Strongly bearish."
and the second quote:
"bear case: Nothing bullish about this stock at all. Bears are in full control and selling everything. If they manage to break below the bear channel, the long covering will accelerate it to 150 but probably not much further before earnings. If earnings are as bad as i expect, the remaining die hard bulls will give up. Except for Cathy. This stock and her fund will go down in 2024."
bull case: If bulls somehow manage to keep this above 150 and they can break above the bear wedge and close above the daily 20ema, there is a chance this stock could trade sideways probably between 160 and 200.
bear case: If 150 breaks, next stop is 100-110. Earnings will officially be released on 2024-04-23 after hours. So don't get fooled by all the reports. They just reported one part of their abysmal earnings. The rest will bring us below 150 and the long covering will be epic. This stock is going two digit in 2024.
short term: 150-160, earnings in 2 weeks should bring us below 150 and on our way to 100-110.
medium-long term: 100-110 where it might go sideways for a longer time. If they survive obvioously.

Understanding the Differences Between Stock Market and Crypto P1Hey there, welcome to 'Stock Market VS Crypto Market'! Our goal? To break down the complexities and highlight the fascinating differences between traditional stocks and the exciting world of cryptocurrencies, making it easier for traders and investors to navigate both landscapes. This is Part 1: (In Part-2 I will tell where to invest and how much)
1. Market Maturity: Traditional stock markets have been established for centuries, with robust infrastructures and historical data available for analysis, whereas the crypto market is relatively young, experiencing rapid growth and evolving regulatory frameworks.
2. Market Size: The global stock market has a significantly larger market capitalization compared to the crypto market, reflecting the extensive presence of publicly traded companies and institutional investors.
3. Volatility: While both markets experience volatility, the crypto market tends to exhibit higher levels of volatility due to its speculative nature and rapid price fluctuations.
4. Transparency: Stock markets typically provide greater transparency in terms of financial reporting, corporate governance, and regulatory disclosures compared to the crypto market, where transparency can vary widely among different projects and exchanges.
5. Counterparty Risk: In the stock market, counterparty risk is mitigated through centralized clearinghouses and regulatory oversight, whereas the decentralized nature of the crypto market may expose investors to higher counterparty risk, such as hacking incidents or smart contract vulnerabilities.
6. Market Manipulation: Instances of market manipulation, such as pump and dump schemes, are regulated and monitored more closely in traditional stock markets compared to the crypto market, where regulatory enforcement may be less stringent.
7. Market Psychology: The psychology of investors in the stock market is influenced by traditional financial metrics and investor sentiment, whereas the crypto market often exhibits a unique blend of technological optimism, speculative frenzy, and fear of missing out (FOMO).
8. Custody Solutions: Custody of traditional stock assets is typically managed by regulated financial institutions, whereas custody solutions for cryptocurrencies range from self-custody through private wallets to third-party custodians and institutional-grade solutions.
9. Accessibility to Information: Stock market participants have access to a wealth of financial information through established platforms such as Bloomberg and Reuters, while information in the crypto market is often decentralized and distributed across various forums, social media platforms, and blockchain explorers.
If we get 20+ likes, I´ll make Part-2 (including the summary, where to invest and which is better).
So like (boost), follow, comment and share it for increasing the knowledge of your friends!

Carefull on TSLATSLA is a stock where the open interest on options particulary is very high. This need to chiil out for a lot of time so smart money can re-accumulate a long position. However the big cycle on indicies takes end at start of 2026. Just an idea to be carefull on this stock...

Tesla TSLA DailyTSLA seems to be bottoming out on the momentum indicators, this looks like it will delay the 100 level test in which supposidly Elon will get margin called at if it were to break. I can see this getting delayed for another week, or perhaps it will bottom here then and form a lower high and restest 100 closer to june/july.

Big Bearish Harmonics EverywhereBig harmonics are everywhere. Surely something is cooking? harmonics either succeed of fail spectacularly. There are big ones all over the place.
I'd be on alert for strong trends upon the decision of the harmonics. Can go either way, harmonic fails setup strong rallies. If these harmonics play out as they'd predict - some sort of shock move is probably coming.

Tesla's Production Numbers in Last QuarterI wanted to bring to your attention the recent news regarding Tesla's Q1 2024 deliveries. There are reports that deliveries fell short of expectations compared to the previous quarter. This development, along with concerns about the economy and evolving consumer preferences in the electric vehicle market, could have an impact on Tesla's stock price.
It's important to consider this news along with other factors, such as Tesla's long-term position in the EV space and overall market conditions when making investment decisions.
As always, it is important to conduct thorough research and analysis before making any investment decisions. Please feel free to reach out in the comments if you have any questions or would like to discuss this further.

Tesla Faces Headwinds as Q1 Deliveries Fall: What Lies Ahead?Tesla ( NASDAQ:TSLA ), the electric vehicle (EV) pioneer, finds itself navigating choppy waters as it reports a decline in first-quarter deliveries, sending its stock tumbling in early trading. With 386,810 deliveries, an 8.5% decrease from the same period last year, Tesla's performance has raised concerns among investors and analysts alike.
The company attributes the decline in volumes to several factors, including the early phase of production ramp-up for the updated Model 3 at its Fremont factory and disruptions caused by external events such as the Red Sea conflict and an arson attack at Gigafactory Berlin. These challenges highlight the vulnerability of Tesla's global supply chain to geopolitical tensions and unforeseen incidents, underscoring the need for resilience in an increasingly complex operating environment.
Moreover, reports of decreased production at Tesla's Shanghai factory raise additional questions about the company's growth trajectory. While Tesla's China-made vehicle sales remained flat year-over-year, despite a 33% increase in overall industry sales in China, the EV maker faces stiff competition from local rivals and mounting pressure to maintain its market share in the world's largest automotive market.
Chinese EV brands like BYD and Nio are aggressively expanding into new markets, posing a formidable challenge to Tesla's dominance. As these competitors gain traction both at home and abroad, Tesla ( NASDAQ:TSLA ) must reassess its strategy to retain its competitive edge and sustain growth in the face of intensifying competition.
The upcoming quarterly earnings report scheduled for April 23 presents a critical opportunity for Tesla ( NASDAQ:TSLA ) to reassure investors and reverse the downward trend in its stock price. Analyst opinions on Tesla's prospects remain divided, with some questioning the company's growth prospects amid mounting challenges, while others view the recent selloff as an overreaction, presenting an attractive buying opportunity for long-term investors.
However, the road ahead for Tesla ( NASDAQ:TSLA ) is fraught with uncertainty, as it grapples with supply chain disruptions, geopolitical risks, and increasing competition in key markets. As the EV industry continues to evolve rapidly, Tesla must demonstrate its ability to adapt to changing dynamics and deliver on its promise of revolutionizing the automotive industry.
Ultimately, Tesla's success hinges on its ability to navigate these challenges effectively and capitalize on emerging opportunities in the rapidly evolving EV landscape. While the recent downturn in stock price may dampen short-term sentiment, long-term investors may view this as a potential buying opportunity, betting on Tesla's innovative capabilities and disruptive potential to drive future growth.
Technical Outlook
Tesla ( NASDAQ:TSLA ) is Trading below its 200, 100 & 50-day Moving Averages (MA) respectively with a negative Relative Strength Index (RSI) of 37. indicating an oversold condition for Tesla ( NASDAQ:TSLA ) amidst market volatility.

TSLA Back at the $164.76 Support LineNASDAQ:TSLA is having a steep decline after failing to meet expectations for Q1 deliveries. The price is back at the $164.76 price level at the white support line. I think there could be a rebound here, and I would monitor the white trendline to see if the price level holds and rebounds in the short term. I think TSLA had a bearish Q1 performance, and there could be a dip into the $150 price levels before TSLA has a recovery. I think TSLA is likely to be bullish in Q2 so I'm looking for an entry over the next few weeks for a swing trade.

$TSLA Analysis, Key Levels & Targets NASDAQ:TSLA Analysis, Key Levels & Targets
So this is not necessarily a full analysis but I did sell 140 puts on the May 3rd contract…. I feel like that would be a good place to buy.
In the long term we have crossed down to bearish on the weekly timeframe but I would expect some interest at that level and I’d be happy to swing it from there is the premium doesn’t burn up before expiration.

TESLA Macro ABC Potential $70Looking at a daily chart for Tesla we can see what has the potential for being a ABC correction wave from its drop last year.
While the current trend is still bullish a lower high or a brake of the last high, grabbing the liquidity above, with a wick back below would be a clear indication that a pull back to the main trend is possibly on it's way.
The previous all time high has a clear swing failure pattern by braking above its previous high dropping back below it and then retesting the same level with a rejection.
IF price manages to make its way back to the main trend it will have an opportunity to redeem it's self but a brake of the main trend would be another clear indication of more potential down side.
For down side targets the next support level below the current low is also corresponding with a previous fair value gap and the golden pocket retrace level of 50-61.8%.
This evaluation has nothing to do with the viability of TESLA or its future but is rather a expression of the liquidity cycle; based on the value of and availability of the currencies used to purchase these assets.

Tesla Gearing Up For A 15% Relief Rally?The projected down trend from last year with an extreme low value of $70 along with the update indicating it was not likely to brake $210 before declining farther have been very upopular but also very accurate forcasts.
Currently Tesla is showing a very familiar and very bullish pattern that will likely lead to a significant relief rally that could certainly turn into a full on reversal. The top of the move up and retrace of it and the amount of time it takes will be good indicators if further downside should be expected.
The pattern I am referencing is the sloppy hand drawn curve and square on the chart. The curvature of price action represents the rate of change in value vs time. As the curve rounds over flat it is showing that over time price is dropping less and less. On the top side of the trend you see the same curve in reverse indicating the trend has reach max momentum to the downside. Where these two points meet is where supply and demand are likely to be equal making a reversal even possible.
My personal forcasting principles are the ancient oak lives in the acorn, time cycles as the pendelum swings, and when time and momentum are square things change.... This is why these forcast focus on the initial impulse range after reversal, there is incremental time ticks to measure the rate of change in momentum to show its equal rate of decay, and curvature drawn to show when exaustion has occured.
Current Trading Plan:
Cover all short positions and accumulate net long for a relief rally.
First likely stop will again be the 180-175 area and possibly higher.
IF the relief rally developes the new trend can be analyzed for strength for indication if the further downside should be expected and an end of the short campaign.
Original tesla short projection and update should be linked below
Trade Well...
Your Friend,
Degen

$TSLA - earnings will decide if that neck will be decapitated orEarnings is around the corner.
tsla really hanging on a thread here.. if it wont maintain or even start a bullish uptrend run. then my assessment in the chart will be as is.
150s, 140s we can even see 110s

Tesla stock analysis on a silver platterAnalyzing Tesla stock on a silver platter only requires patience, patience, then patience

$TSLA close above support level, let's see tomorrow's data.NASDAQ:TSLA close above support level, let's see tomorrow's data.

Tsla Q2Besides aapl Tsla had the worst quarter among big tech.
Price is in A downtrend but a bullish wedge is forming here. Also bullish divergence on the 1hour RSI and symmetrical triangle
The target move would be top of channe1 or 200EMA.
Best entry is a close above 183.. or a retest of Strong support at 172
Cut losses below 165

Tesla Mean Reversion tradeTrade to 175 GEX level confluence with ema reversion from over extended move.
planning collar at 172.80ish

$TSLATsla been bearish for the past few months all bc of bad news and bad pr's
Trend suggests that i can go lower and revisit 150s to confirm its reversal OR continues down trend.
This is my observation - I started scalping (intraday: 1-5min chart) TSLA 2 months ago and its been pretty good. (11k up)
Hope you find this insightful and helpful on your trade.
Good luck to all!

Is The EV Hype Over? How The Fed Is Destroying TeslaThe first quarter of 2024 is now over, closing in a record +10% YTD rally and an exceptional +43% YOY increase in the QQQ. Despite the markets pushing higher, Tesla is experiencing significant challenges, with a -30% decrease YTD and a -9% decline YOY. This performance has positioned Tesla as the worst performing megacap so far. Given these circumstances, it's essential to delve into both macroeconomic factors and technical analysis to understand what has happened and what is likely to happen moving forward.
The Macroeconomic Impact on Tesla
Two years ago, the Federal Reserve initiated a historic rate-hiking cycle, increasing interest rates from 0% to 5.5% within just over a year and maintaining this rate since July 2023. This shift in monetary policy has notably affected car financing rates, now at 8.2% for a five-year loan, which significantly discourages consumers from buying new vehicles, especially EVs.
The chart clearly illustrates an inverse correlation between Tesla stock and interest rates. Moreover, Tesla has operated exclusively during periods of historically low interest rates. Despite the Federal Reserve pausing rate hikes nine months ago, the interest rate on car loans continues to rise. Further examination of inflation trends indicates that most common inflation measures have either plateaued or slowed their pace of deceleration, at a level inconsistent with the Fed's 2% inflation target.
The M2 money supply and inflation expectations are critical indicators for predicting the direction of inflation. The peak in the headline Consumer Price Index (CPI) followed the peak in M2 YOY by 16 months, recently bottoming just three months before CPI YOY stopped making progress to the downside. This lagged correlation suggests that headline CPI is unlikely to continue its strong downward trend moving forward.
Moreover, inflation expectations, which remain well anchored, have also appeared to stop making progress to the downside, all remaining above 2%. This, combined with unchanged interest rates for nine months, suggests that the neutral rate of interest must be significantly higher than the pre-COVID trend.
Historically, recessions have played a key role in helping the Fed bring down inflation to their 2% target. However, current economic indicators, including low unemployment levels and easy financial conditions, suggest that a recession is unlikely in the near future, despite the fed funds rate staying unchanged at a two-decade high.
The Chicago Fed National Financial Conditions Index (NFCI) captures the stimulative effects on the economy from the U.S. government's expansive fiscal policy. By borrowing and spending trillions directly from the Reverse Repo (RRP), the U.S. government has ingeniously counterbalanced the constrictive effects of tighter monetary policy without exerting upward pressure on long-term yields.
The prolonged inversion of the yield curve, significantly extended by the U.S. government's financial strategies, could mark this cycle as having the longest inversion in history. Typically, a steepening yield curve is a precursor to higher unemployment and economic recession. However, the steepening of the yield curve remains unlikely in the short term, with excess reserves still available in the RRP and the Treasury General Account (TGA).
With the U.S. employment sector still robust, showing historically low unemployment levels and low initial and continued claims, the likelihood of a significant uptrend in the unemployment rate seems low, as job openings are absorbing most of the excess labor supply and still remain well above the historical trend.
This suggests that the fed funds rate may remain at around 5% this year, maintaining car loan rates at a higher level for an extended period and consequently making EVs increasingly less affordable for the average consumer. This scenario is likely to lead to a continuation of price cuts and greater margin contractions.
Tesla's Technical Analysis Outlook
From a technical analysis perspective, Tesla stock faced rejection at the $205 horizontal resistance line and might be rejected from the $180 level, marked by the 0.236 Fibonacci level. The next significant support level is at $155, with a possibility of revisiting the January 2023 low of $110, given Tesla's stock has been in a downward trend ever since November 2021.
From a trend-based perspective, we can clearly see that TSLA stock is in a strong downtrend both in the 4H and daily timeframe with the EMAs and 20- week SMA trending lower.
Despite this unfavourable outlook, caution is advised when considering short positions in Tesla due to its market dominance and relatively stable financial position, making it a riskier target than other less financially secure EV manufacturers.
Concluding Thoughts
While the broader market demonstrates resilience, the Federal Reserve's monetary policy is significantly shaping the EVs industry future. With the economy likely transitioning away from historically low interest rates into a higher interest rate environment, caution is advised. Investors may benefit from considering less interest-rate-sensitive options until a clearer picture of the inflationary landscape and its impact on the economy emerges.
Disclaimer: This article is for informational and educational purposes only and should not be construed as investment advice.
