Catching Trends Before They Run — JYL Trend Pro V1.0 BETA 1. What is JYL Trend Pro V1.0 BETA?
JYL Trend Pro is my personal trend‑following strategy built around a proprietary state engine I call JYL Trend.
Instead of staring at raw price bars and guessing “is this a real trend or just noise?”, the script translates price action into a clear sequence of states like:
“GO!” → first confirmation that a potential new long trend is starting
“GREEN LIGHT” → healthy bullish continuation
“BULLISH!” → aggressive momentum phase
“WATCH OUT!” → first warning that bullish conditions might be ending
“RED LIGHT” → sustained bearish pressure
“BEARISH!” → aggressive downside momentum
All of this happens automatically in the background. You don’t need to calculate anything or tweak formulas — you just read the states and trade your playbook.
Screenshot:
1drv.ms
1drv.ms
2. The 3 Modes: Stable / Impulsive / IMP+
JYL Trend Pro V1.0 BETA actually contains three personalities in one strategy.
You can switch between them with a single input depending on your style and market conditions.
🧊 2.1 Stable – “Let the trend breathe”
Stable mode is built for traders who prefer cleaner, slower signals:
Focus on the first strong trend confirmation (first “BULLISH!” or “BEARISH!” segment)
Avoids over‑trading inside choppy ranges
Takes partial exits when the trend starts weakening
Fully closes when the color flips (bullish → bearish or vice versa)
This is the “I don’t want to click too much, just ride the move and manage risk” profile.
⚡ 2.2 Impulsive – “Hit the gas when momentum appears”
Impulsive mode is more aggressive:
Allows earlier entries when the trend starts to accelerate
Adds to positions when new strong segments appear
Uses quick “fast exits” when the trend loses steam
Still keeps a safety net: color‑flip exits to avoid being stuck on the wrong side
If Stable is your cruise control, Impulsive is you manually stepping on the gas when you see an opportunity.
🚀 2.3 IMP+ – “Advanced scaling & risk logic on top of Impulsive”
IMP+ takes Impulsive logic and adds an advanced layer of:
Configurable early entries in strong moves (for traders who want a bit more “front‑running” of trends)
Smart adds inside the continuation zone
-After the BULLISH! / BEARISH! impulse, IMP+ looks for a specific type of continuation candle to add
-If you added early, it will skip the later add to avoid over‑leveraging the same move
Dynamic partial exits after big segments
-Scales out more as the move stretches, so you lock in profit without killing the entire trend
Open‑to‑open exhaustion exits
-After a strong trend leg (BULLISH! or BEARISH!), if the next candle opens too close to the previous one (configurable packages), IMP+ can treat it as exhaustion / hesitation and close the position — before the big reversal happens
In short: IMP+ is for traders who want the most “tactical” behavior — early entries, structured scaling, and more nuanced exit logic — while still being rules‑based, not discretionary.
3. How I Personally Use It
Everyone’s risk tolerance and timeframe are different, but here’s how I like to combine the modes:
On higher timeframes (4H / Daily):
→ I usually prefer Stable to catch the big swings and avoid noise.
On intraday momentum names:
→ I lean toward Impulsive or IMP+ to enter earlier and scale more actively.
When markets are clearly trending:
→ IMP+ is my “all tools unlocked” mode: early entries, adds after strong legs, and dynamic profit taking.
The trade direction filter lets me choose:
Only LONG
Only SHORT
Or both directions (for indices / futures / FX etc.)
That makes it flexible for different instruments and market regimes.
4. What this strategy is not
To keep this idea honest & within TradingView’s rules:
It is not a holy grail
It does not guarantee profit
Backtests do not equal future performance
You still need position sizing, risk management, and a plan
JYL Trend Pro is simply a framework that:
Structures entries (initial + adds)
Structures exits (partial + full)
Gives you consistent rules instead of emotional decisions
5. How to try it
This is the JYL Trend Pro V1.0 BETA version.
The strategy is available on TradingView as a protected / invite‑only script.
If you’d like to:
See how the different modes (Stable / Impulsive / IMP+) behave on your favorite tickers
Study the entry / add / reduce / exit logic on historical moves
Or just explore a different way to visualize trend sequences (“GO! / GREEN LIGHT / BULLISH! / WATCH OUT! / RED LIGHT / BEARISH!”)
👉 Check my profile for the script and more details.
If this idea helps you or gives you inspiration, I’d really appreciate a like, comment, or follow — it tells me to keep sharing more tools and improvements.
Trade safe & test everything before going live. 🙏
Trade ideas

TSLA — [2D] WEEK 49 TREND REPORT | 12/04/2025TSLA — WEEK 49 TREND REPORT | 12/04/2025
Ticker: NASDAQ:TSLA
Timeframe: 2D
This is a reactive structural classification of TSLA based on the weekly chart as of this timestamp. Price conditions are evaluated as they stand — nothing here is predictive or forward-assumptive.
⸻
1) Current Trend Condition [ Numbers to Watch ]
Current Price @ 447.66$
• Trend Duration : +7 Days (Bullish)
• Trend Reversal Level ( Bearish ): 418.70$
• Trend Reversal Level ( Bearish Confirmation ): 428.42$
• Pullback Support : 413.70$
• Correction Support : 354.94$
⸻
2) Structure Health
• Retracement Phase:
Uptrend (operating above 78.6%)
• Position Status:
Healthy (price above both structural layers)
⸻
3) Temperature :
Warming Phase
⸻
4) Momentum :
Bullish
⸻
Author’s Note
UPWARD STRUCTURAL ALIGNMENT
This mark reflects a point where market behavior supported the continuation of the existing upward direction. It does not imply forecasting or targets — it simply notes where strength became observable within the current trend. Its meaning holds only while price continues to respect the broader structural levels that define the trend.
⸻
Methodology Overview
This classification framework evaluates directional conditions using internal trend-interpretation logic that references price behavior relative to its structural layers. These relationships are used to identify when price movement aligns with the framework’s criteria for directional phases, transition points, or regime shifts. Visual elements or structural labels reflect these internal interpretations, rather than explicit trading signals or preset indicator crossovers. This framework is observational only and does not imply future outcomes.

TSLA: The Super Lucrative Asset = Teslacmp : 446.74
This is under supply zone but above 417 : No major sellers will be sold their Qty.
according to chart.
Breaker Block above 465 if break and sustain it will be for next 534 Levels
SL : 415
Manage your Risk and Long view

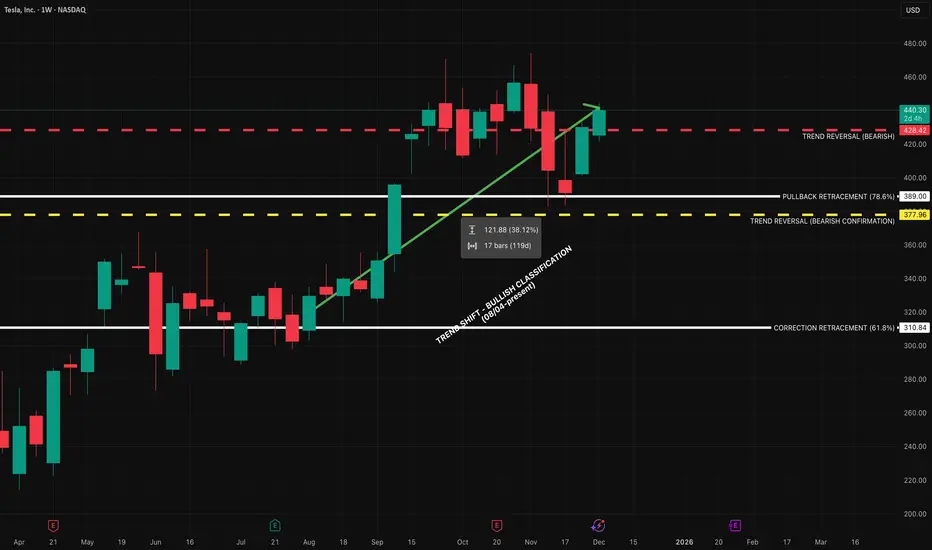
TSLA — WEEK 49 TREND REPORTTSLA — WEEK 49 TREND REPORT
Ticker: NASDAQ:TSLA — 12/03/2025 @ 440.31$
Timeframe: WEEKLY
This is a reactive structural classification of TESLA based on the weekly chart as of this timestamp. Price conditions are evaluated as they stand — nothing here is predictive or forward-assumptive.
⸻
1) Current Trend Condition
• Trend Duration: +17 weeks (Bullish)
• Trend Reversal Level (Bearish): 428.42$
• Trend Reversal Level (Bearish Confirmation): 377.96$
• Pullback Support : 389$
• Correction Support : 310.84$
⸻
2) Structure Health
• Retracement Phase:
Uptrend (operating above 78.6%)
• Position Status:
Healthy (price above both structural layers)
⸻
3) Temperature :
Cooling Phase
⸻
4) Momentum :
Bullish
⸻
5) Market Sentiment (RETAIL TRADER LINE)
Bullish
⸻
Author’s Note
This analysis is fully reactive, not predictive. Market conditions, trend structure, and behavior are classified as they appear in real time. The objective is to identify where directional shifts first occurred, where structural integrity remains intact, and where it would begin to weaken if key levels were breached.
Predictive analysis projects outcomes that do not exist yet. Without price confirmation, prediction is built on baseless assumptions. This framework avoids that entirely by responding only to verified structural changes and live conditions.
The levels shown simply identify where the current trend structure first shifted and where it would begin to lose integrity if breached. Recognizing these boundaries allows for clearer interpretation of market behavior without relying on forward guarantees, speculative projections, or unsupported assumptions.
⸻
Methodology Overview
This classification framework evaluates directional conditions using internal trend-interpretation logic that references price behavior relative to its structural layers. These relationships are used to identify when price movement aligns with the framework’s criteria for directional phases, transition points, or regime shifts. Visual elements or structural labels reflect these internal interpretations, rather than explicit trading signals or preset indicator crossovers. This framework is observational only and does not imply future outcomes.
TSLA Breakout Above $360 Opens Swing Trade SetupTesla broke the $360 resistance four days ago, a level that had been holding price down for the last 120 days. Once broken, price surged quickly toward the $420 zone.
In my view, if we get a chance to buy again near the 370 green support zone, it would be a great swing trade opportunity — especially with the rising trendline still intact.
🔍 Technical Analysis
Current Price: 420.95
360 acted as resistance for months, now flipped to strong support.
Green zone (360–375) aligns with the uptrend, key area to watch for re-entry.
🛡️ Support & SL
🟢 370 zone | SL: 345
🧭 Outlook
Bullish Case: Hold above 370 → continuation toward 450–475.
Bearish Case: Break below 345 → deeper correction.
Bias: Bullish while above 370.
🌍 Fundamental Insight
Valuation: Tesla trades at a relatively high P/E ratio (60–70 range) compared to traditional automakers, reflecting growth expectations rather than current earnings.
Revenue Growth: While margins have compressed due to price cuts, top-line growth remains supported by strong EV demand and expansion in new markets.
Innovation & AI: Tesla’s positioning in AI, autonomous driving, and energy storage continues to attract investor optimism beyond just vehicle sales.
Risks: Competition from other EV makers and margin pressure are key risks investors are watching.
✅ Conclusion
Tesla’s breakout above 360 ended months of pressure. A pullback into the green support zone would be a strong swing entry with trendline confluence. While valuation is stretched versus peers, bullish momentum and growth expectations continue to support the stock.
⚠️ Disclaimer
This analysis is for educational purposes only and does not constitute financial, investment, or trading advice.

TSLA: Hold or SellHello Traders,
Regarding the technical point of view!
Telsa have been previously overbought. there are two resistances on its way! 1st the dynamic and 2nd the static one!
A triangle shape has been formed!
If you have it right now, I'm more with keeping it!
But you may find more profitable stocks to buy!

Venture Capital’s Global Impact1. Driving Global Innovation
At its core, venture capital exists to fund innovation. VC firms invest in early-stage businesses that have high growth potential but also high risk—companies that traditional banks or lenders would rarely touch.
This willingness to fund experimentation has brought to life some of the world’s most transformative technologies:
The internet and search engines
Smartphones and mobile applications
Artificial intelligence and machine learning
Electric vehicles and clean energy
Biotechnology and precision medicine
E-commerce and fintech platforms
Without venture capital, many of the revolutionary companies we know today—Google, Facebook, Tesla, Uber, Alibaba, Shopify, and countless others—might never have scaled globally. VC acts as the financial fuel behind groundbreaking ideas, enabling startups to test, iterate, and expand at lightning speed.
2. Boosting Economic Growth and Job Creation
One of the most measurable global impacts of venture capital is economic expansion. VC-backed companies consistently outperform traditional businesses in terms of job creation, revenue growth, and market expansion.
Key economic contributions include:
2.1 Employment Generation
Startups supported by venture capital create millions of high-skill jobs across software development, research, engineering, marketing, and operations. These companies often become large-scale employers once they scale, contributing significantly to national employment figures.
2.2 Creation of New Industries
Entire industries—like ride-sharing, cloud computing, online education, and fintech—were built on VC funding. These sectors not only generate direct jobs but also create large support ecosystems.
2.3 Attracting Global Investments
Countries with strong VC ecosystems attract foreign investors, multinational corporations, and global funds. This strengthens the balance of payments and increases capital inflows.
3. Increasing Global Competitiveness
Venture capital plays a crucial role in helping nations remain competitive in the global innovation race. Countries with robust VC networks—such as the U.S., China, India, Israel, the U.K., and Singapore—are also leaders in cutting-edge technology.
3.1 Encouraging Entrepreneurship
VC fosters a culture where innovation is rewarded, raising the confidence of entrepreneurs to take risks and build new enterprises.
3.2 Commercialization of Research
Universities and research centers often commercialize their technology through venture funding. This bridges the gap between academic research and real-world application, making scientific discoveries accessible to industries.
3.3 Regional Development
In many countries, venture capital helps geographically underdeveloped regions grow by funding startups, incubators, and innovation clusters. Examples include:
Bangalore, India
Shenzhen, China
Tel Aviv, Israel
Berlin, Germany
São Paulo, Brazil
These cities became global tech hubs primarily because venture capital supported entrepreneurs and attracted international talent.
4. Supporting Technological Advancement and Transformation
Technology evolves at a rapid pace, and venture capital ensures that the world keeps moving forward. VC firms not only provide money—they bring mentorship, strategic planning, and global networks that help startups commercialize their innovations.
4.1 Accelerating Disruptive Technologies
VC funding pushes forward technologies such as:
Artificial intelligence
Blockchain and Web3
Robotics and automation
Green energy and sustainability
Space technology
Biotech and genomics
By taking early risks, VC funds encourage breakthroughs that later become everyday tools.
4.2 Redefining Traditional Industries
Venture-backed startups are transforming traditional sectors:
Fintech is reshaping banking.
Edtech is revolutionizing education.
Healthtech is changing medical diagnostics and treatment.
Agri-tech is improving farming efficiency.
Clean-tech is transforming energy and climate solutions.
This disruption leads to greater efficiency, lower costs, and improved services worldwide.
5. Strengthening Global Entrepreneurship Ecosystems
Venture capital has a multiplier effect on entrepreneurship. As startups succeed, founders often reinvest capital and experience into newer ventures, creating a self-sustaining cycle.
5.1 Success Stories Inspire Future Innovators
Global VC successes have encouraged millions to start businesses of their own.
Examples:
Silicon Valley unicorns influenced entrepreneurship in Europe and Asia.
India’s startup boom accelerated after Flipkart and Paytm gained global recognition.
China’s tech giants like Tencent and Alibaba inspired an entire generation of Chinese entrepreneurs.
5.2 Growth of Startup Support Networks
VC involvement leads to the development of:
Incubators
Accelerators
Angel networks
Innovation labs
Entrepreneurial universities
This infrastructure builds long-lasting entrepreneurial ecosystems.
6. Encouraging Globalization and Cross-Border Economies
Venture-capital-backed startups often expand internationally faster than traditional companies. This creates a more connected global marketplace.
6.1 Cross-Border Investments
VC firms frequently invest across borders. U.S. VC firms invest in India, China, and Europe; Asian firms invest in Africa and Latin America. This makes capital global and accessible.
6.2 International Market Expansion
Startups scale globally using VC networks, entering multiple continents in just a few years. This globalization drives economic integration, technology exchange, and cultural connectivity.
6.3 Knowledge Transfer
VC-backed companies bring global expertise—operational strategies, product design, marketing models, and technological know-how—to developing markets.
7. Supporting Social and Environmental Change
In recent years, venture capital has expanded beyond purely profit-driven investments. Many funds now prioritize impact investing, focusing on startups that solve global challenges such as:
Climate change
Renewable energy
Clean mobility
Healthcare access
Food security
Education for all
Impact-driven venture capital is driving innovation in sectors essential for sustainable global development.
8. Creating Wealth and Financial Growth
Venture capital has created massive wealth for founders, investors, and employees. This wealth, in turn, fuels new businesses and supports economic development.
8.1 Building Billion-Dollar Companies
Unicorn startups—those valued at over $1 billion—have become common worldwide. They drive national GDP growth and attract new investments.
8.2 Stock Market Growth
Many venture-backed companies go public through IPOs, contributing to stock market expansion and providing investment opportunities for the broader population.
Conclusion
Venture capital’s global impact extends far beyond funding startups. It is a powerful driver of innovation, economic growth, job creation, global competitiveness, and societal transformation. Through risk-taking and visionary investment, VC has shaped modern technology, transformed industries, and accelerated global development. As the world continues to evolve, venture capital will remain at the forefront of unlocking new opportunities and pushing the boundaries of what is possible.

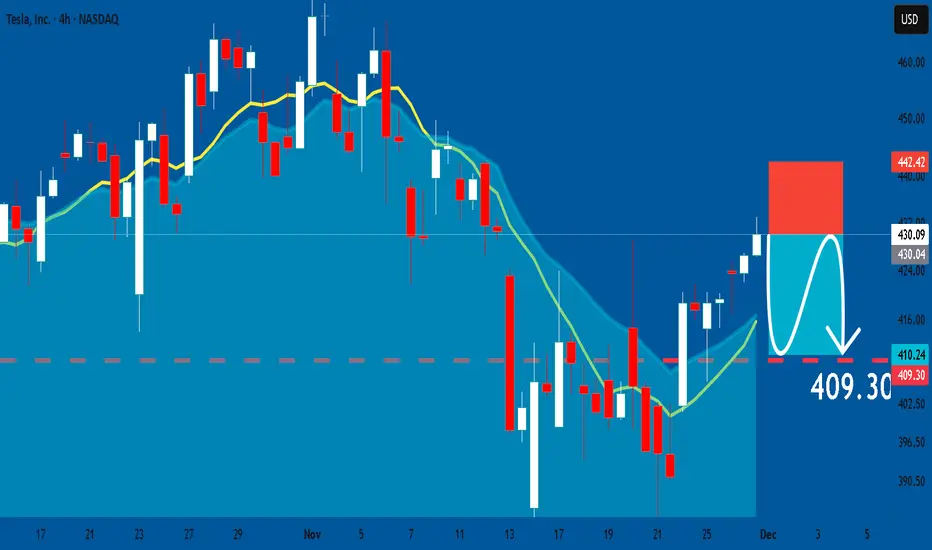
TESLA: Short Signal with Entry/SL/TP
TESLA
- Classic bearish setup
- Our team expects bearish continuation
SUGGESTED TRADE:
Swing Trade
Short TESLA
Entry Point - 430.09
Stop Loss - 442.42
Take Profit - 409.30
Our Risk - 1%
Start protection of your profits from lower levels
Disclosure: I am part of Trade Nation's Influencer program and receive a monthly fee for using their TradingView charts in my analysis.
❤️ Please, support our work with like & comment! ❤️
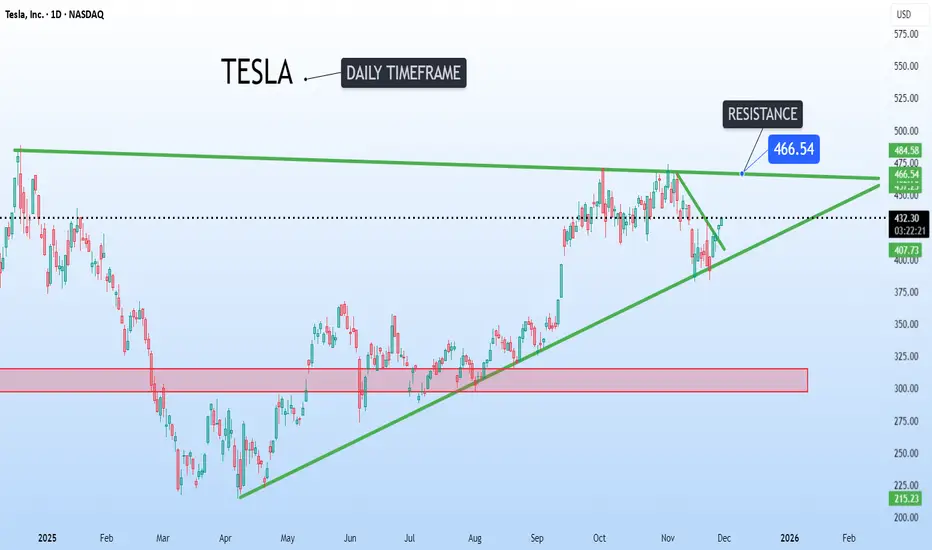
Tesla bouncing from strong supportTesla NASDAQ:TSLA is about to get wild, this daily chart is showing a huge squeeze.
The stock is bouncing perfectly while building pressure right under the big $466 ceiling.
If it can bust through that resistance, we're talking about a serious rocket ride up to new highs.
Tesla downside momentum could extend before any reboundCurrent Price: $402.77
Direction: SHORT
Confidence Level: 62%
Targets:
- T1 = $380.00
- T2 = $368.00
Stop Levels:
- S1 = $410.00
- S2 = $420.00
**Wisdom of Professional Traders:**
The collective insights from multiple professional traders show a consistent short‑term bias to the downside for Tesla, even among those who are bullish longer term. Several traders focused on the $380 area as the first key level to watch, with many citing $368 as the major gap‑fill target for this week. While a few see buying opportunities lower, the weight of commentary points to more near‑term weakness before a sustainable rally sets in.
**Key Insights:**
Here’s what’s driving my view: across the trader community, Tesla is in a clear short‑term downtrend of lower highs and lower lows. Multiple traders marked $398–$400 as an overhead resistance zone with “a lot of supply,” making it hard for price to push higher before testing lower supports. There’s also consensus that any bounce here would likely be a “pump and dump” into resistance before the next leg lower.
Another important observation is that many traders see $380 as the immediate downside target, with $368 as a more aggressive move that fills the open daily gap. Quite a few expect that if the market shows further weakness, these levels could be reached within this week. The short‑term technical picture – failing rallies, resistance holding, and repeated tests of support – keeps me leaning to a short bias.
**Recent Performance:**
Tesla has retreated from highs in the $460s into the low $400s over recent weeks. Last week’s action saw it struggle to hold intraday bounces, closing lower and respecting resistance in the high $390s to $400 range. The stock’s recent inability to follow through on rallies, despite broader market upticks, underlines the pressure sellers are applying.
**Expert Analysis:**
Several traders pointed to the break of a short‑term uptrend late last week, followed by confirmation of fresh downside momentum. $380 was highlighted repeatedly as a heavy buy interest zone – but crucially, that’s also where they expect price to gravitate to in the short term. The $368 gap is seen as a likely magnet if $380 fails to hold. Other market experts tied this weakness to double top patterns and broader tech weakness, adding fundamental headwinds like Bitcoin impairment impacts on Tesla’s net income.
**News Impact:**
While there were mentions of long‑term catalysts like robo‑taxis and updated FSD ratings, these are not expected to influence this week’s price action. Recent headlines about large stake sales by high‑profile investors and Tesla’s exposure to Bitcoin impairments have added a cautious tone. This news flow supports the case for near‑term softness as traders weigh potential earnings impacts.
**Trading Recommendation:**
Here’s my take: With heavy supply above $398–$400 and traders eyeing $380 and $368 as near‑term targets, I see a SHORT setup as the higher‑probability play for this week. A break under $382 could accelerate momentum toward $380 quickly, with $368 in play if selling persists. I’d keep stops above $410 to protect against a squeeze, with $420 as a hard‑fail level for the short thesis. Position sizing should be moderate given the potential for sharp bounces in a volatile name like Tesla.
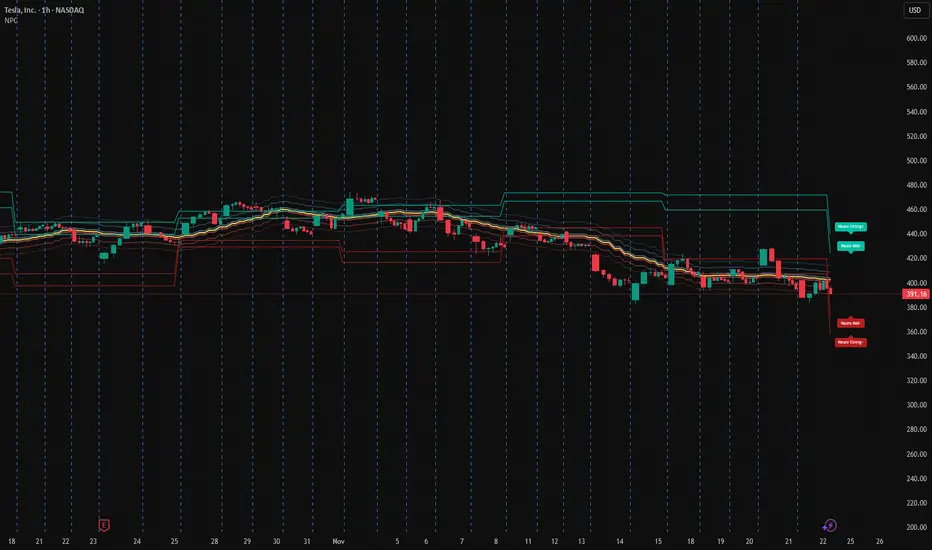
Tesla (1H) – Post-Distribution Breakdown vs NPC Equilibrium ZoneTesla is currently trading inside a NPC post-distribution compression range after breaking down from the upper volatility structure.
Instead of predicting direction, here’s the statistical positioning based on the NeuroPolynomial Channel:
Current Positioning:
• Price under NPC Core Cluster
• Distance to lower stress band: ~1.4%
• Distance to upper expansion band: ~3.2%
• Compression vs prior impulse: ~0.61
NPC Volatility Map:
• Upper Expansion Zone: +3% to +3.8%
• Core Equilibrium: 400–412 zone
• Lower Rejection Band: −1.4%
• Breakdown Continuation Zone: −2.8% to −3.5%
Interpretation (scenario-based):
– Sustained acceptance above core → structural rebuild attempt
– Rejection at core → continuation inside stress band
– Re-entry into strong-lower → extension zone unlock
This is a volatility structure map, not a prediction model.
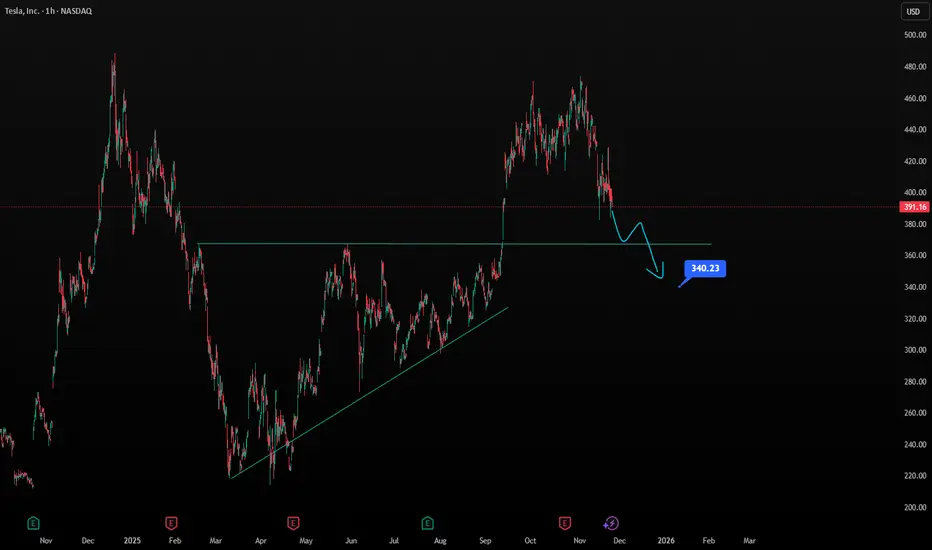
Midterm Stock Forecast for TeslaNASDAQ:TSLA at $391 shows weakening technical structure, suggesting a continuation toward $340. H1 trendlines indicate fading bullish pressure. Fundamentals remain mixed: energy storage grows, but auto margins face pressure and competition intensifies. The $340 zone is a key demand area for potential midterm stabilization.
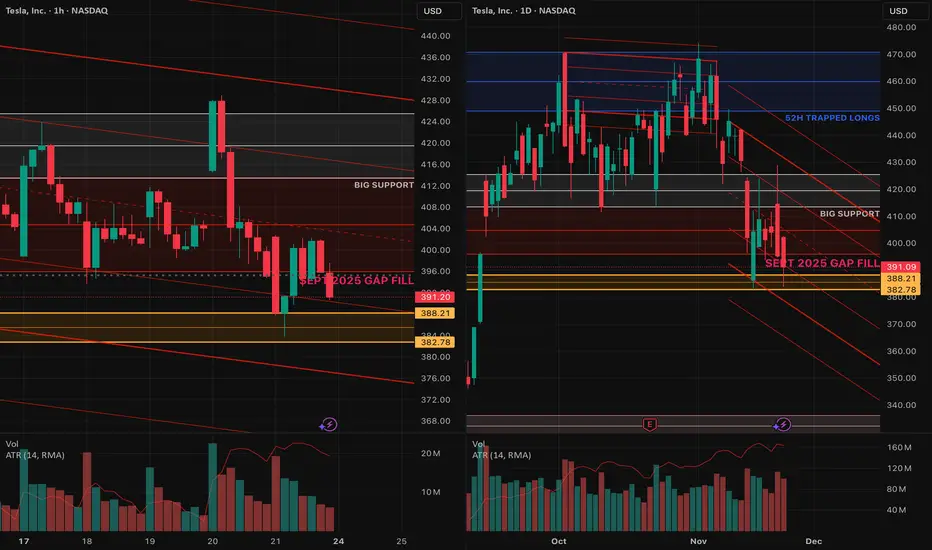
TSLA ... From darling to toxic exThere is nothing to debate.
PWL at 382.78–388.21 must hold, or buyers get steamrolled. We’re trading below the 50-day on the daily, and any strength is likely to be sold into. I hate leaning this bearish, but if there’s going to be a short-term bounce, it *starts* with the PWL holding. With heavy overhead supply near 400, this is not a name where you want to be the early hero.
If the PWL breaks, downside opens to the 200-day near 338 or the beige pocket between 328–336.
Negative headwind:
Forget Musk's latest pay package, his last one could wipe out years of Tesla profits
By Chris Kirkham
www.reuters.com
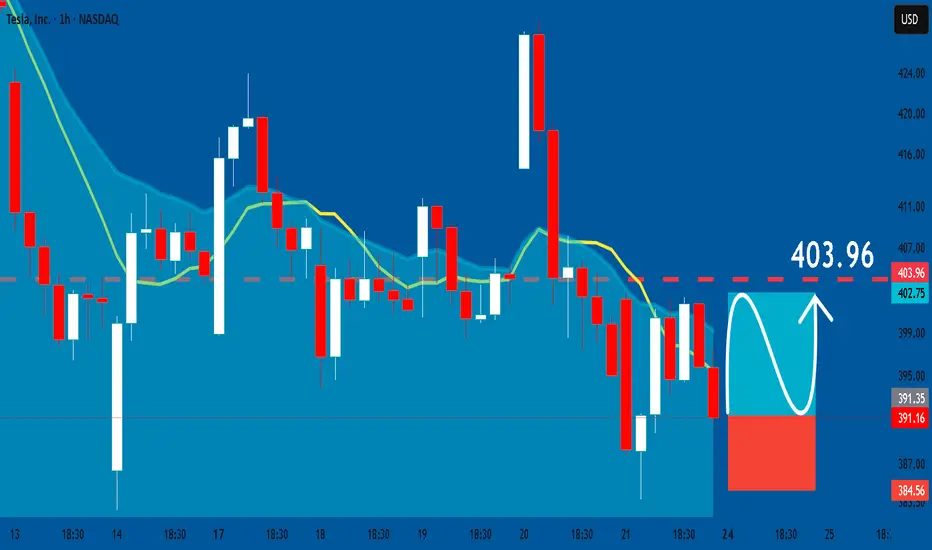
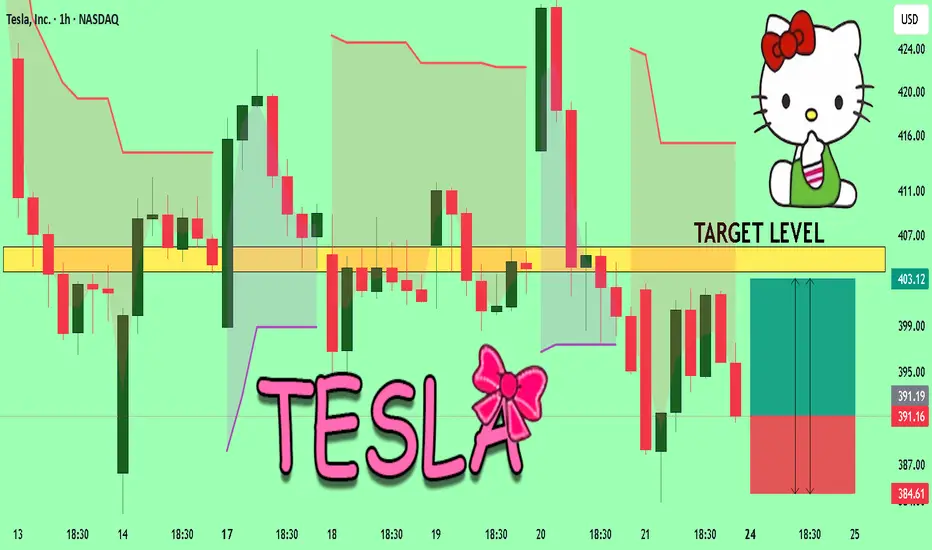
TESLA: Long Signal Explained
TESLA
- Classic bullish pattern
- Our team expects retracement
SUGGESTED TRADE:
Swing Trade
Buy TESLA
Entry - 391.16
Stop - 384.56
Take - 403.96
Our Risk - 1%
Start protection of your profits from lower levels
Disclosure: I am part of Trade Nation's Influencer program and receive a monthly fee for using their TradingView charts in my analysis.
❤️ Please, support our work with like & comment! ❤️
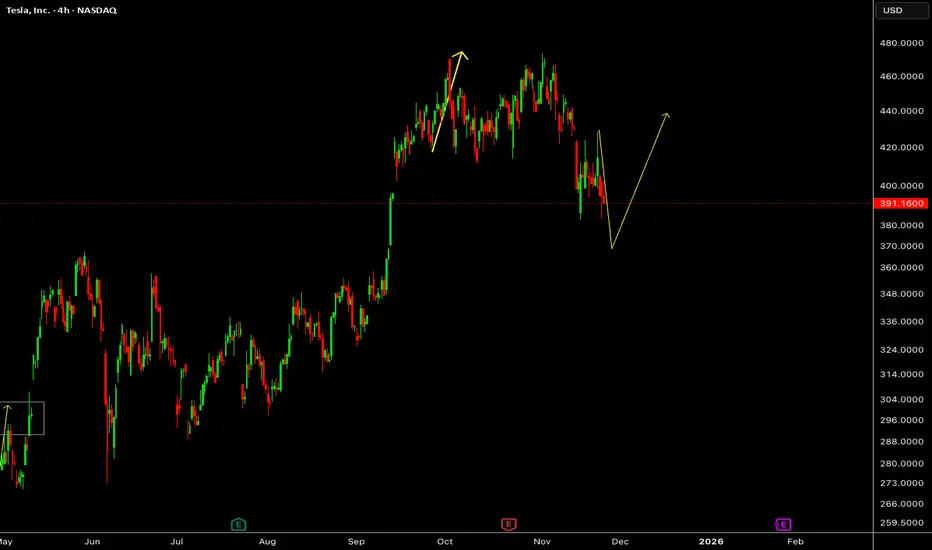
TSLA:Truncated 5th at 474 A-Bottom 382 Confirmed-3Scenarios MapTSLA: Truncated 5th at 474 ☠️ A-Bottom 382 Confirmed – 3 Scenarios Mapped: B to 440/460 or Bust? C-Targets 287-367 + Fed Cut Catalyst Dec 9-10:
Tesla's 5-wave impulsive rally from $273 to $474.07 is officially terminated in a classic Truncated 5th Wave pattern – one of the most reliable bearish setups in Elliott Wave theory.
Key Confirmation Signals:
Wave ⑤ high: 474.07 = exact same price as sub-wave (i) of ③ (textbook same-price failure)
Screaming RSI bearish divergence at the top
Volume collapse + SMA20/50 death cross (Sep) → truncation locked in
Current structure: ABC zigzag correction (likely Wave IV of larger cycle or Wave A of bear impulse).
Wave A: 474.07 → 382.78 (0.786 retracement of entire impulse, Nov 14 low)
Wave B: Now underway as platform consolidation post-hammer reversal (Nov 23 low 383.76, RSI oversold confirmed)
-Primary target: 430-440 (0.618 Fib of A) by early Dec
-If breakout 445: Extend to 460 (0.786 Fib, 35% odds – accelerated rally fueled by Fed doves)
MACD/RSI Fuel for B-Wave:
MACD bullish divergence emerging (-3.85 turning up) → Gold cross by Nov end
RSI oversold hammer → Short-term bounce to 410+ expected
3 Scenarios for Wave C (Post-B Top):
| Scenario | Probability | B-Wave High | C-Wave Target | Key Condition |
|-------------------|-------------|-----------------|-----------------|----------------------------------------|
| **Weak B: Deep C** | 50% | 430-440 (Platform Type) | 287-293 (C=1.618×A) | B stalls at 440; Dec FOMC mild cut → Extension from 319 (1.272×A) low |
| **Strong B: Shallow C** | 35% | 445-460 (Accelerated Rally) | 361-367 (C=1.0×A) | Break 445 on Fed fuel; Shallow due to strong rebound |
| **Bullish Invalid: Extended ⑤** | 15% | >485 (Break Secondary Resistance) | 550-600+ (0.618 of Impulse) | Weekly close >485 negates ABC → Wave ⑤ resumes |
Catalysts to Watch:
Dec 9-10 FOMC: Expected 25bp cut (89% odds post-Williams) – Long shadow potential for B acceleration (see chart)
Bear confirm: <380 break → C accelerates to 250 (2.0×A, high-volume 2024 low)
Timeframe: B ends early Dec; C launches mid-Dec, bottoms Jan 2026 (4-6 weeks)
Trade with stops: Long B to 440 (trail below 380); Flip short at B top divergence.
This is not financial advice – DYOR.

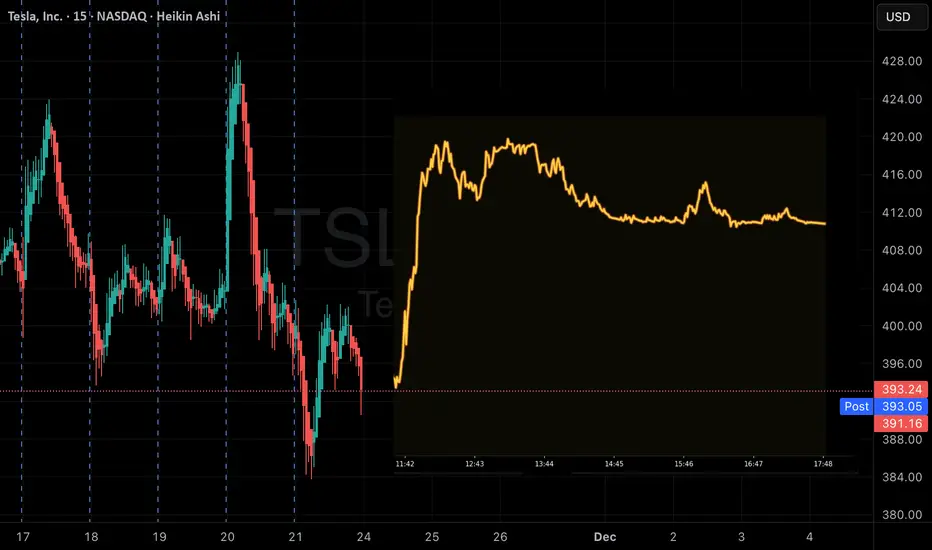
TSLA – Downside Extension Followed by Potential Rebound PhaseTesla has continued to slide after its recent peak, with price action forming a deeper corrective leg. The latest reaction suggests a rebound scenario may develop if momentum begins to shift, paving the way for a possible recovery sequence in the coming sessions.
Disclosure: We are part of Trade Nation's Influencer program and receive a monthly fee for using their TradingView charts in our analysis.
TESLA Will Explode! BUY!
My dear friends,
My technical analysis for TESLA is below:
The market is trading on 391.16 pivot level.
Bias - Bullish
Technical Indicators: Both Super Trend & Pivot HL indicate a highly probable Bullish continuation.
Target - 403.74
Recommended Stop Loss - 384.61
About Used Indicators:
A pivot point is a technical analysis indicator, or calculations, used to determine the overall trend of the market over different time frames.
Disclosure: I am part of Trade Nation's Influencer program and receive a monthly fee for using their TradingView charts in my analysis.
———————————
WISH YOU ALL LUCK
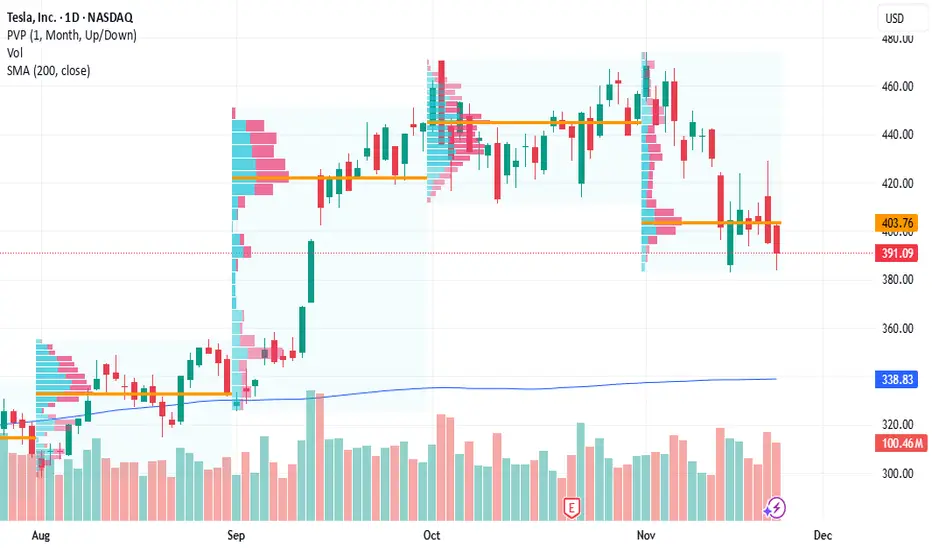
TSLA: Fundamentals Are Collapsing While Valuation Stays in OrbitTesla is trading near multi-month highs… but the fundamentals tell a very different story.
EPS has dropped by 50%, revenue growth has almost stalled, and yet the stock still carries a Forward P/E of 164.
This combination — slowing growth and extreme valuation — looks like the definition of an institutional bubble setup.
🧮 Fundamental Context
Over the past few years, Tesla’s growth has slowed dramatically:
Revenue rose from 31B → 53B → 81B → 96B → 97B — barely any increase.
EPS climbed from 0.2 → 1.6 → 3.6 → 4.3 — and then fell by half.
Quarter-over-quarter metrics remain negative, with no visible recovery trend.
Meanwhile, the Forward P/E of 164 implies double-digit expansion ahead — which clearly isn’t happening.
The fundamentals simply do not justify this kind of valuation.
Right now, Tesla’s numbers resemble the early phase of a valuation compression cycle — where prices eventually catch up with reality.
📉 Technical Structure
Technically, Tesla has been moving in a broad sideways range, forming what looks like a long-term Wave 4 structure.
We’re currently inside the “B” leg, which could already be complete or near completion.
Once that wave ends, the next expected move is a Wave C decline.
Key levels to watch:
📍 Upper resistance zone: $400 – $550
📍 Primary cluster: around $250
📍 Support zone: $150 – $200
The chart shows clear volume concentration around $250 — once that level breaks, the next liquidity pocket sits between $150 and $200.
That’s where a potential bottoming cluster could form before the final upward leg.
⚠️ Market Outlook
While other FANG names maintain solid balance sheets and stable earnings, Tesla’s fundamentals are deteriorating sharply.
Yes, the stock may still see short-term pumps driven by sentiment or Musk’s fan base — but markets always return to fundamentals.
And those fundamentals are pointing downward.
📊 Summary
EPS and revenue both trending lower 📉
Forward P/E at 164 — completely disconnected from growth metrics
Technical range suggests potential decline toward $200–$150
Current price action likely part of a larger corrective structure
Long-term investors should exercise extreme caution ⚠️
Tesla isn’t a short-term “growth story” anymore — it’s a valuation risk story.
Until earnings stabilize and margins recover, this stock looks massively overpriced.

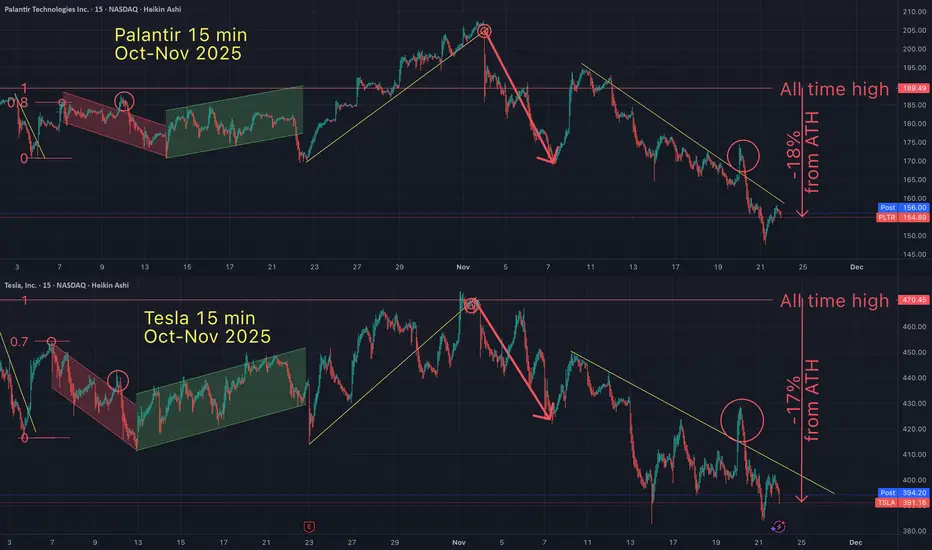
Tesla / Palantir Fractal - 50 Days of identical price action?On oct 7th I suggested that Tesla and Palantir had been in a 'fractal" pattern. Since identifying this pattern, it's been 50 days of identical price action (on the 15 minute timeframe). But this fractal goes back much further in time.
Fractals are a mathmatical anomaly, if you understand linear equations (and believe the market is "random"). All assets are doing the same patterns over and over, on all time frames. You just need to see it for what it is.
May the truth be with you.
TSLA SELL++++ $360-370 to be testedAs I posted last week, and, clearly too early TSLA needs to test the $370 range where it broke out from. I do pat myself on the back for the epic bounce off support at $324.80 that needed to hold to see $426's and TSLA always goes further then we think both ways. We're way overdone and todays reversal shows it. $370's imminent in coming weeks

Tesla Retests Key support Amid a New Lawsuit After Deadly CrashTesla (NASDAQ: NASDAQ:TSLA ) faces renewed scrutiny after a lawsuit was filed over a fatal January 2023 crash in Washington state. According to the complaint, the vehicle “rapidly accelerated” before striking a utility pole and bursting into flames, killing one passenger and severely injuring another. First responders reportedly struggled to access the victims due to the vehicle’s structure and fire behavior, raising questions about safety systems and emergency accessibility.
The lawsuit lands during a period of heightened attention on Tesla’s real-world AI features, including Autopilot and Full Self-Driving (FSD). While the filing does not explicitly blame autonomous systems, it adds pressure to Tesla’s regulatory and legal environment, which remains a critical investor risk factor heading into 2026.
Tesla’s Fundamentals Remain Strong
Despite the legal challenges, Tesla retains a massive market cap near $1.33 trillion and continues scaling its energy and robotics divisions. The company remains profitable, with a strong balance sheet and long-term margin expansion driven by software, AI, and autonomous capabilities. The Optimus humanoid robot program and 4680 battery ramp both strengthen Tesla’s position in the next industrial cycle.
Tesla’s broad lineup—from the Model 3 to the Semi and Cybertruck—supports global delivery growth, while its charging infrastructure partnerships increase ecosystem reach. Fundamentally, Tesla remains one of the strongest players in the EV and AI–mobility sectors.
Technical Outlook: Trendline Retest in Play
From a price-action perspective, Tesla trades around $391, pulling back toward a critical ascending trendline visible on the weekly chart. This trendline has guided Tesla’s recovery since April and remains the key level to watch.
Support:
• $390 trendline
• Major demand at $350
• Long-term support at $250
Resistance:
• $425
• $492 (2025 high)
A strong bounce at the trendline could send TSLA back toward $425 and eventually $492. However, a clean breakdown risks a deeper correction toward the $320 zone.

TSLA Momentum Play: QuantSignals V3 Sees Strong UpsideTSLA | QuantSignals Katy 1M Prediction (2025-11-21)
Current Price: $385.51
Predicted Close: $396.06 (+2.74%)
30-min Target: $393.15 (+1.98%)
Trend: Bullish
Confidence: 75%
Volatility: 27.4%
Trade Signal
Direction: CALL
Entry: $385.51
Target: $393.95
Stop Loss: $379.73
Expected Move: +2.74%
Summary: 1 trade signal generated from 1 successful analysis.
Tesla - Withstanding all weakness!🏹Tesla ( NASDAQ:TSLA ) can still break out:
🔎Analysis summary:
Since Tesla was listed on the Nasdaq back in 2013, we witnessed a lot of triangle breakouts. And starting all the way back in 2020, Tesla once again created a bullish triangle. Last month we saw the breakout and this month we have to see the confirmation
📝Levels to watch:
$400
SwingTraderPhil
SwingTrading.Simplified. | Investing.Simplified. | #LONGTERMVISION
