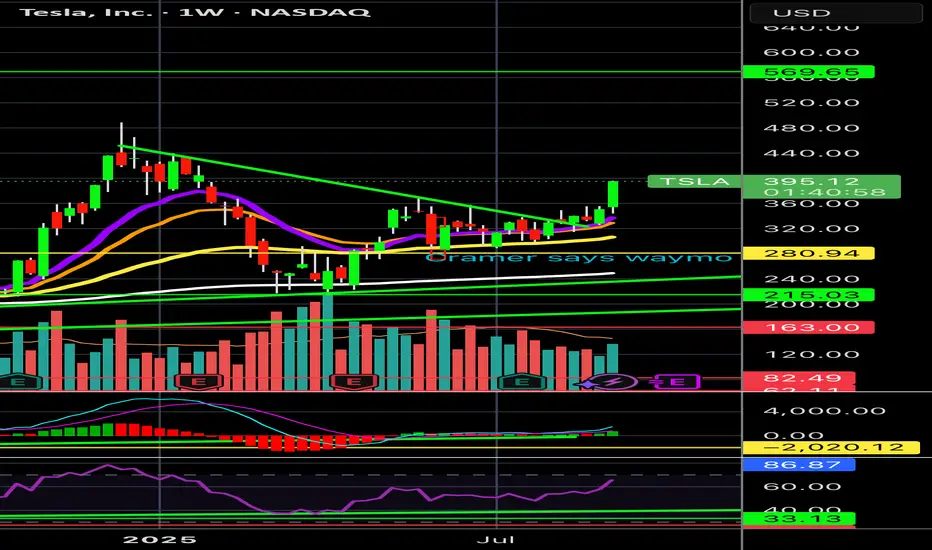
Breakout time $TSLA$570 inbound
The start of the Energy abundance and Robotaxi era is upon us. Autonomous robots will transport everything within the next 10 years.
Optimus wave will follow shortly behind over the next 5 years.
TAM Potential: 10X autonomous transport.
How high this eventually goes is almost laughable, time to sit back and watch compound growth and all its magical glory.
TSLA trade ideas
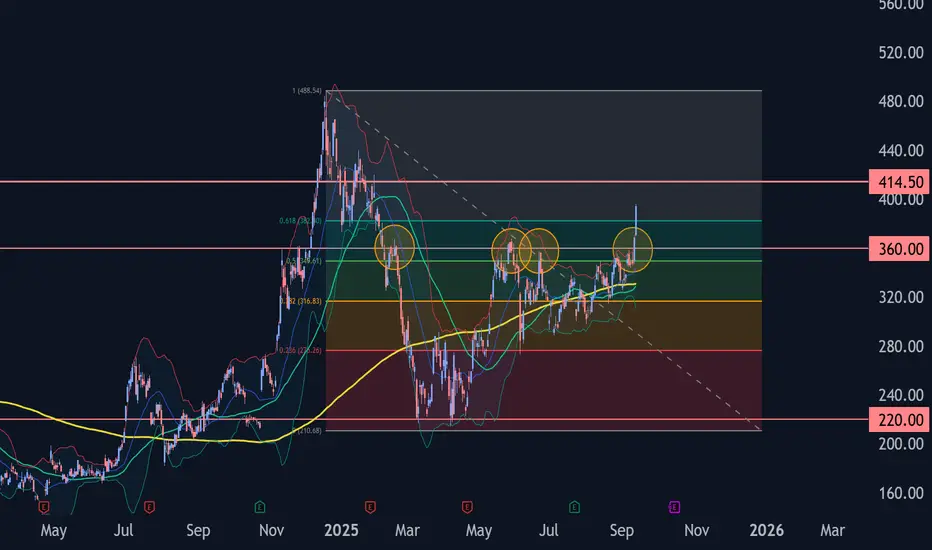
Tesla Wave Analysis – 12 September 2025- Tesla broke resistance area
- Likely to rise to resistance level 414.50
Tesla recently broke the resistance area located at the intersection of the resistance level 360.00 (which has been reversing the price from February), resistance trendline of the daily up channel from July and the 50% Fibonacci correction of the downward impulse from December.
The breakout of this resistance area accelerated the active impulse wave 3 of the intermediate impulse wave (3) from June.
Tesla can be expected to rise to the next resistance level 414.50 (target price for the completion of the active impulse wave 3).
You will ask yourself, "how did he know Tesla would do that"?I wrote this on my July 29th chart description (below):
"Price action really has less to do with the news making Elon a hero, then a villain and then back and forth...but moreso to do with price action patterns that just keep repeating". Since then, the pattern has played out exactly as anticipated, and my 1st take profit target just hit (+22%).
July 29th chart:
Now the question remains, will Telsa hit my next target range (T2). Although it is a much larger range than my T1, I will monitor price action closely and use TA to get out near the top before the next major retracement.
Let me know if you're into Tesla and if you are interested in me charting the top of this run.
May the trends be with you.

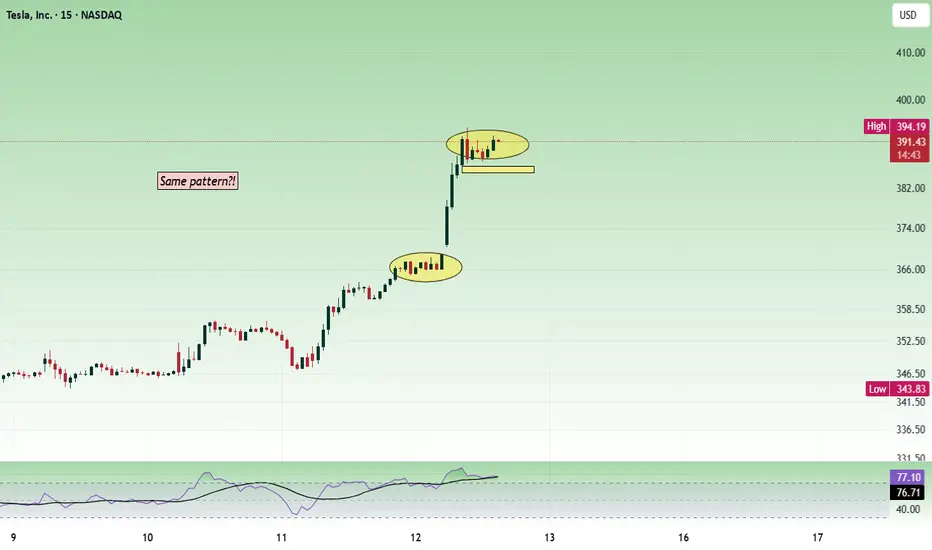
Tesla - consolidation patternUsually, whenever the price gives a breakout, we will think the price will reverse or have a pullback. Sometimes the same trend will continue after a small consolidation. I am seeing similar type of consolidation here.
Buy above 390 with the stop loss of 387 for the targets 383, 396, and 399. We can expect resistance or some profit booking around 400.
Always do your analysis before taking any trade.
Tesla Breakout? For the majority of the calendar year TESLA has been in a range between $220 - $365 with a clear midpoint of $295.
From March to the beginning of May TESLA bounced between range low and the midpoint until finally breaking through into the upper half of the range where it has stayed ever since. However, there is a clear diagonal resistance level that is preventing higher highs.
So will TESLA breakout, or will it lose the midpoint? Structurally it is clear that the bulls have a set level they are happy to buy at (Midpoint) but the bears are getting more aggressive with their selling, hence the lower highs. This compression inevitably leads to an impulse move but the direction is not so clear.
Bullish scenario: A clean breakout with volume that makes a new higher high, signaling a shift in structure. A pullback and retest of the breakout would be an ideal opportunity to go long and aim for that range high before expecting resistance.
Bearish scenario: The lower highs keep printing until the midpoint is lost and price accepts below it, that would then signify to me the new trading range is between Range Low and Midpoint.
The fakeout scenario is a risk but with price so close to the midpoint already it follows the same invalidation criteria as the bullish scenario, the midpoint is vital to both sides.

#TESLA - $40 Swing?Date: 14-08-2025
#Tesla - Current Price: 339
#Tesla Pivot Point: 339 Support: 331 Resistance: 347
#Tesla Upside Targets:
| 🎯 Target 1 | 356 |
| 🎯 Target 2 | 365 |
| 🎯 Target 3 | 374 |
| 🎯 Target 4 | 384 |
#Tesla Downside Targets:
| 🎯 Target 1 | 323 |
| 🎯 Target 2 | 314 |
| 🎯 Target 3 | 304 |
| 🎯 Target 4 | 295 |
#TradingView #Nifty #BankNifty #DJI #NDQ #SENSEX #DAX #USOIL #GOLD #SILVER

TESLA BULLISH BREAKOUT|LONG|
✅TESLA is going up
Now and the stocks is trying to
Made a bullish breakout
Of the key horizontal
Level of 367.50$ and IF breakout
Is confirmed we will be expecting
A further bullish move up
LONG🚀
✅Like and subscribe to never miss a new idea!✅

Could we see another Bullish leg on #TSLAmore consolidation here will confirm this wave scenario with targets of
324
384
The invalidation of this scenario is the break of 240.7 (-5%)
Trade safe

Follow-through buying on TSLA?Following a one-sided 6.0% gain in Tesla’s share price on Thursday, this helped lift the S&P 500 and Nasdaq to fresh records. As shown in the chart below, the TSLA Stock rallied through a 6M resistance level of US$360.03 to a high of US$368.99, levels which have not been seen since earlier this year.
Further buying could now be seen for the Stock towards the resistance between US$389.72 and US$383.09. However, before reaching said area, a pullback may occur, retesting US$360.03 as support, with a dip into 1M support from US$343.88 possible.
Written by the FP Markets Research Team

Possible retrace before upside moveThe initial upward move from 214 is corrective in nature. Since the current correction to 273 doesn't seem to be proper ABC correction, I am expecting further C wave correction to the Green box. Breaking the Red Box and the trendline with a retest will invalidate further downward correction. Based on the Major Indexes structure, I am not expecting Tesla to retrace below 213 as depicted by red line .
Note
**Disclaimer** : All details shared here is for educational purpose only. Please do your own research and consider appropriate risk management before making short term or long-term investment decisions.
Approach Market always with probabilities and make sure risk management in place.
Request your support by like, comment and follow

WXY structure with a double topTesla has been in a uptrend with a corrective structure WXY. I am not sure if the WXY is a part of wave 5 terminal structure or a B wave. However expecting a double top or 78.6 retrace to 425-430 range as a minimum. For this scenario, an impulsive upside move is expected within the next few weeks. However the price needs to move back into the channel next week as a first step.

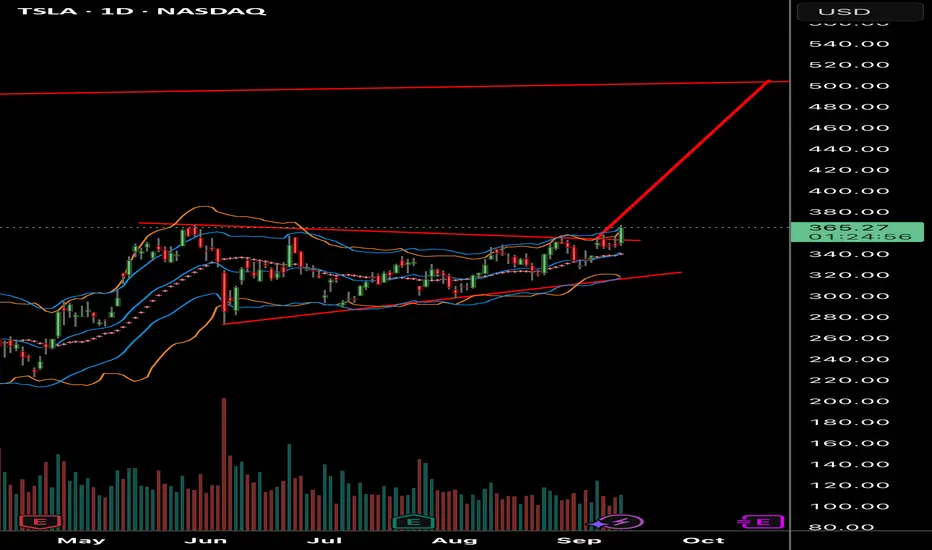
$TSLA - channel breakout on the daily. possible $400 soonTSLA - Stock finally seeing channel breakout after long consolidation. calls above $370 looking good for a move towards $378 and $400. Stock is decent at indicator. needs to hold $365 to hold the breakout move.

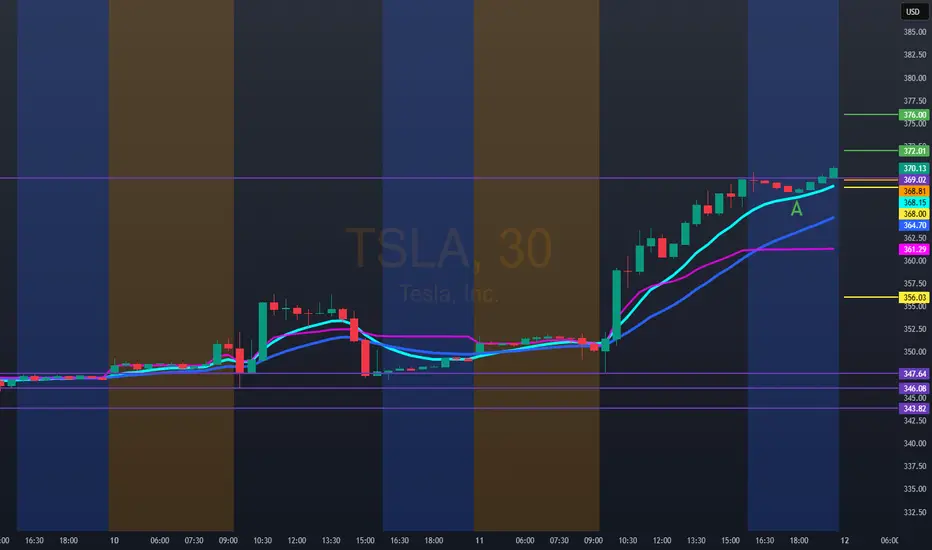
Hello trader, nice to meet you. For tomorrow, TSLA: 368.81we have a bullish entry at 372.00/376.00. Next, a possible target is 385.00/390.00. For better control of your stop, you can use the VWAP.
Bearish technical entry at 368.00. If you lose, this area could reach the 356.00 zone with a possible rebound. It's important to keep in mind that September is often a negative month for TSLA.
TSLA Support & Resistance Lines for September Month 2025TSLA’s September map uses the same monthly bands. Expect faster moves and occasional overshoots; size accordingly.
30-minute for 2–3-day swings
Longs
Rejection at lower band: Buy back toward half-step; add on clean midline reclaim.
Acceptance + retest: Hold above a line and retest from the top → ride to next line.
Shorts (when price trades above lines)
Volatility fade: TSLA often overshoots the upper band. If a 30-min prints a wicky close back inside, short the fade.
- Targets: Nearest half-step, then midline.
- Stop: Above the overshoot high (give TSLA a bit of air).
UTAD-style failure: If TSLA holds above a band briefly but fails the retest (can’t sustain closes above, sellers reclaim), short on the first failed retest.
- Targets: Half-step → next line down.
- Invalidation: Clean 30-min close back above the failed line.
Management
Scale at each line; go flat if a 30-min close invalidates your level. Trail quickly after TP1—TSLA snaps.
1–3 hour for weekly swings
Bias
Acceptance above midline → continuation to the next band.
Rejection at upper band → path back to midline more likely.
Shorts
1–3h exhaustion above band: Bodies compress, momentum fades, then a close back inside → short toward the half-step/midline.
Break-and-fail sequence: Close above a band → lose it → retest from below fails → short continuation lower.
Risk: Stop just above the lost line; tighten on first target tag.

TSLA $375 Call –Momentum + Options Flow Edge!
⚡ **TSLA 1‑Day Earnings/Weekly Scalp!**
📅 **Expiry:** 2025-09-12
🎯 **Strike:** \$375 CALL
💵 **Entry:** \$1.38 (Ask)
🛑 **Stop Loss:** \$0.69 → strict 50%
📈 **Profit Target:** \$2.07 (\~+50%)
📊 **Confidence:** 70% (Moderate Bullish)
⏰ **Entry Timing:** Market Open
💎 **Why This Trade:**
* Multi-timeframe momentum bullish (daily RSI 70.4, weekly RSI 67.8)
* Institutional call flow C/P = 1.57 → strong directional skew
* Low VIX (14.9) supports call buying
* Balanced strike with high liquidity (OI 16,237)
* Quick scalp: exit by Thursday close — avoid Friday gamma crush
⚠️ **Key Risks:**
* 1 DTE → extreme gamma & theta decay
* Underlying volume moderate → pullbacks possible
* News can reverse the move rapidly
* Use **small position sizing** (1–3% max risk)
💡 **Execution Tips:**
* Use limit at ask (\$1.38) or slightly better for control
* Hard stop at \$0.69
* Scale out at \$2.07 or partial at \$1.80
* Monitor intraday VWAP & price action; abort if momentum stalls
🎯 **Quick Take:** Cheap, high-conviction 1-day scalp with defined risk & asymmetric upside. Fast in, fast out, gamma-aware trade.

TSLA about to POPClear play that I’ve been sharing with friends and it’s playing out perfectly so far
Tesla Short: Stop above $368, TP at $298In this video, I re-initiated the short idea for Tesla. Reason being that I observed that around $367-ish is an important price point (although I have no idea why). Also, the move up has been more corrective in nature (since I drew ABCDE). The move also resembles a rising wedge.
In any case, the most important point in this idea is the stop loss which should be set above $368. The ultimate Take Profit Target for me is $298 with a short-term target of $344.
Good Luck!

TESLA Lagging BehindA compelling reason to buy Tesla stock now—despite it being beaten down—is the asymmetric risk-reward setup driven by its depressed valuation relative to long-term growth potential. Sentiment is currently low due to concerns about EV demand, competition, and Elon’s distractions, but this pessimism is largely priced in. Meanwhile, Tesla still holds massive optionality: AI-driven autonomy, energy storage, and Dojo supercomputing. If even one of these verticals scales meaningfully, current prices may prove a generational entry.
At the moment, we are hitting some of my key support levels being the anchored vwap from the low , as well as the previous Value Area High range retest within the formation of this broader triangle, suggesting a potential continuation to the upside should we get a strong breakout.
I will be watching for further down side as the current risk is only approx 6-7% for a potential upside of 60%-70% , a massive Risk to reward.
Should this reclaim the downtrend vwap, it can be a strong sign of strength for this stock to move back to ATH's as tesla is massively lagging behind.

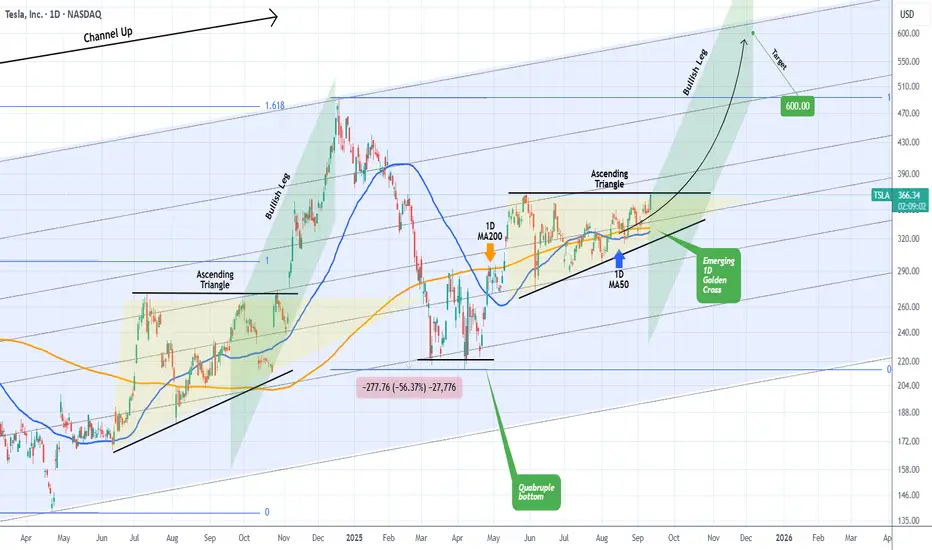
TESLA about to start a parabolic rally to $600.Exactly 3 months ago (June 06, see chart below) we called a bottom buy on Tesla (TSLA) right when it was trading at $284.70:
The price followed this prediction precisely, got out of the Bull Flag and eyes now a new 4-month High above $368.
This would be a break above the 4-month Ascending Triangle, a pattern we last saw during the stocks previous Bullish Leg in mid-end 2024. As you can see, that break-out delivered the Higher High test of Tesla's 3-year Channel Up at $488.
At the same time we are about to form a 1D Golden Cross, which makes the bullish sentiment even stronger.
As with our June 06, we still expect the price to reach $600 and price a new Higher High on the long-term Channel Up
-------------------------------------------------------------------------------
** Please LIKE 👍, FOLLOW ✅, SHARE 🙌 and COMMENT ✍ if you enjoy this idea! Also share your ideas and charts in the comments section below! This is best way to keep it relevant, support us, keep the content here free and allow the idea to reach as many people as possible. **
-------------------------------------------------------------------------------
💸💸💸💸💸💸
👇 👇 👇 👇 👇 👇
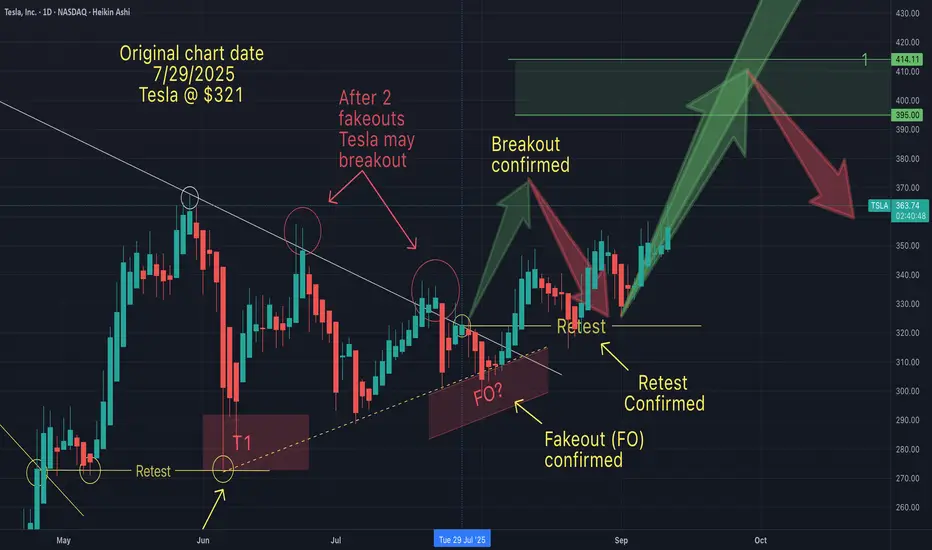
Is Tesla on it's way to $400+On July 29th I suggested that Tesla was about to break out to the upside (after fakeouts).
Then on Sep 4th I suggested that after a restest (of the breakout line), Tesla would begin its climb. This portion of the anticipated pattern now been confirmed.
One question now remains...will Tesla hit my T1 ($395 - $414).
What do you think? I'd like to know what the sentiment is out there. I'd like to hear your thoughts.
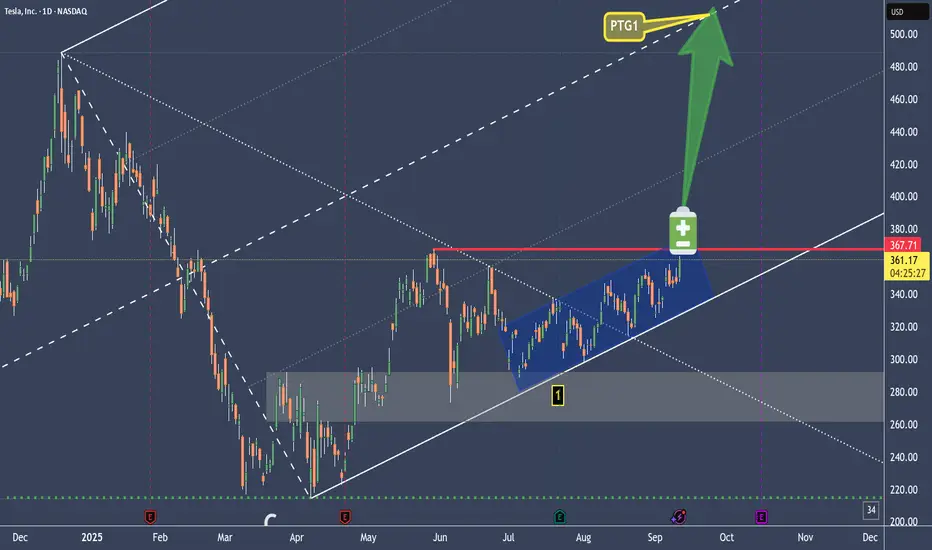
TSLA Battery Is still loading - May the Energy be with you.We see the slanted coil.
It act's like a Battery loading energy.
At one time it will expend it's energy, either up, or down.
Forks show the most probable path of price.
Forks provide a framework, where a Trader doesn't have to guess. Just trade the rule-book and follow your one plan.
Either we get stopped or we are happy Teslonians.
May the Energy be with you §8-)
TESLA BULLISH,READ NOTES SEP 11 2025Tesla is looking bullish to break this consolidation. Initial target would be $390. Now breakout is an expectation so always manage your risk.
NOTE: LOOKING BULLISH TO BREAKOUT

Geopolitical Tensions & Trade Wars1. Understanding Geopolitical Tensions
Definition
Geopolitical tensions refer to conflicts or rivalries between nations that arise from differences in political systems, territorial claims, military strategies, or economic interests. These tensions often extend beyond diplomacy into military confrontations, sanctions, cyber warfare, and trade restrictions.
Key Drivers of Geopolitical Tensions
Territorial disputes – e.g., South China Sea, India-China border, Israel-Palestine conflict.
Resource competition – oil, natural gas, rare earth minerals, and even water supplies.
Ideological differences – democracy vs. authoritarianism, capitalism vs. socialism.
Technological dominance – battles over 5G, semiconductors, and artificial intelligence.
Strategic influence – the U.S. vs. China in Asia-Pacific, Russia vs. NATO in Eastern Europe.
Geopolitical tensions may not always escalate into war, but they often manifest as economic weapons, including tariffs, sanctions, and restrictions on trade.
2. What Are Trade Wars?
Definition
A trade war is an economic conflict between nations where countries impose tariffs, quotas, or other trade barriers against each other, often in retaliation. Instead of cooperating in the free exchange of goods and services, they use trade as a weapon to gain leverage.
Mechanisms of Trade Wars
Tariffs – taxes on imported goods (e.g., U.S. tariffs on Chinese steel).
Quotas – limits on the number of goods imported (e.g., Japan’s rice import restrictions).
Subsidies – financial aid to domestic industries, making exports cheaper.
Export controls – restricting key goods, like semiconductors or defense equipment.
Sanctions – blocking trade altogether with specific countries or entities.
Difference Between Trade Dispute and Trade War
A trade dispute is usually limited and negotiable (resolved via WTO).
A trade war escalates into repeated rounds of retaliatory measures, often causing collateral damage to global supply chains.
3. Historical Background of Trade Wars
Mercantilism in the 16th–18th centuries – European powers imposed heavy tariffs and colonized territories to control resources.
Smoot-Hawley Tariff Act (1930, USA) – raised tariffs on over 20,000 goods, worsening the Great Depression.
Cold War Trade Restrictions (1947–1991) – U.S. and Soviet blocs limited economic interaction, fueling technological and arms races.
Japan-U.S. Trade Tensions (1980s) – disputes over Japanese car and electronics exports to the U.S. led to tariffs and voluntary export restraints.
U.S.-China Trade War (2018–present) – the most significant modern trade war, involving hundreds of billions in tariffs, sanctions, and tech restrictions.
4. Causes of Trade Wars in the Modern Era
Economic Protectionism – shielding domestic industries from foreign competition.
National Security Concerns – restricting sensitive technologies like 5G, AI, and semiconductors.
Geopolitical Rivalry – economic weapons as part of larger power struggles (e.g., U.S. vs. China, Russia vs. NATO).
Unfair Trade Practices Allegations – accusations of currency manipulation, IP theft, or dumping.
Populism & Domestic Politics – leaders use trade wars to appeal to local voters by promising to "bring jobs back home."
5. Case Study: The U.S.-China Trade War
The U.S.-China trade war (2018–present) is the most important example of how geopolitical rivalry shapes global trade.
Phase 1 (2018): U.S. imposed tariffs on $50 billion worth of Chinese goods, citing unfair trade practices and intellectual property theft.
Retaliation: China imposed tariffs on U.S. agricultural products, especially soybeans, targeting American farmers.
Escalation: Tariffs expanded to cover $360+ billion worth of goods.
Technology Restrictions: U.S. banned Huawei and restricted semiconductor exports.
Phase 1 Agreement (2020): China promised to increase U.S. imports, but tensions remain unresolved.
Impact:
Global supply chains disrupted.
Rising inflation due to higher import costs.
Shift of manufacturing from China to Vietnam, India, and Mexico.
U.S. farmers and Chinese exporters both suffered losses.
6. Geopolitical Hotspots Affecting Trade
1. Russia-Ukraine War
Western sanctions cut Russia off from global finance (SWIFT ban, oil & gas restrictions).
Europe shifted away from Russian energy, sparking energy crises.
Global wheat and fertilizer exports disrupted, raising food inflation worldwide.
2. Middle East Conflicts
Oil is a geopolitical weapon—any conflict in the Persian Gulf impacts global crude prices.
OPEC+ decisions are often politically influenced, affecting both producers and consumers.
3. South China Sea
A vital shipping lane ($3.5 trillion in trade passes annually).
Territorial disputes between China and Southeast Asian nations raise risks of blockades.
4. Taiwan & Semiconductors
Taiwan produces over 60% of global semiconductors (TSMC).
Any conflict over Taiwan could paralyze global tech supply chains.
5. India-China Border & Indo-Pacific Rivalries
India bans Chinese apps and tightens investment rules.
Strengthening of Quad alliance (US, India, Japan, Australia) reshapes Asian trade.
7. Impact of Geopolitical Tensions & Trade Wars
1. On Global Economy
Slower global growth due to reduced trade flows.
Inflationary pressures from higher tariffs and supply disruptions.
Increased uncertainty reduces foreign direct investment (FDI).
2. On Businesses
Supply chain realignments (China+1 strategy).
Rising costs of raw materials and logistics.
Technology companies face export bans and restrictions.
3. On Consumers
Higher prices for imported goods (electronics, fuel, food).
Limited choices in the market.
4. On Financial Markets
Stock market volatility increases.
Commodity prices (oil, gold, wheat) spike during conflicts.
Currency fluctuations as investors seek safe havens (USD, gold, yen).
5. On Developing Nations
Export-dependent economies suffer as global demand falls.
Some benefit by replacing disrupted supply chains (e.g., Vietnam, India, Mexico).
8. The Role of International Institutions
World Trade Organization (WTO)
Provides a platform to resolve disputes.
However, its influence has declined due to U.S.-China disputes and non-compliance.
International Monetary Fund (IMF) & World Bank
Provide financial stability during crises.
Encourage open trade but have limited enforcement power.
Regional Trade Agreements
CPTPP, RCEP, EU, USMCA act as counterbalances to global tensions.
Countries diversify trade partnerships to reduce dependence on rivals.
9. Strategies to Manage Geopolitical Risks
Diversification of Supply Chains – "China+1" strategy by multinationals.
Hedging Against Commodity Risks – futures contracts for oil, wheat, etc.
Regionalization of Trade – building self-sufficient trade blocs.
Technology Independence – countries investing in local semiconductor and AI industries.
Diplomacy & Dialogue – ongoing talks via G20, BRICS, ASEAN, and other forums.
10. The Future of Geopolitical Tensions & Trade Wars
Rise of Economic Nationalism: Countries prioritizing local industries over globalization.
Technology Wars Intensify: AI, semiconductors, and green energy will be new battlegrounds.
Fragmentation of Global Trade: Shift from globalization to "regionalization" or "friend-shoring."
Energy Transition Risks: Conflicts over rare earth metals, lithium, and cobalt needed for batteries.
New Alliances: BRICS expansion, Belt & Road Initiative, and Indo-Pacific strategies will reshape global economic influence.
Conclusion
Geopolitical tensions and trade wars are not temporary disruptions but structural features of the modern global economy. While globalization created interdependence, it also exposed vulnerabilities. Trade wars, sanctions, and economic blockades have become powerful tools of foreign policy, often with far-reaching economic consequences.
For businesses and investors, the challenge lies in navigating uncertainty through diversification, resilience, and adaptation. For policymakers, the task is to strike a balance between protecting national interests and sustaining global cooperation.
Ultimately, the world may not return to the hyper-globalization era of the early 2000s. Instead, we are moving toward a multipolar trade system shaped by regional blocs, strategic rivalries, and technological competition. How nations manage these tensions will determine the stability and prosperity of the 21st-century global economy.