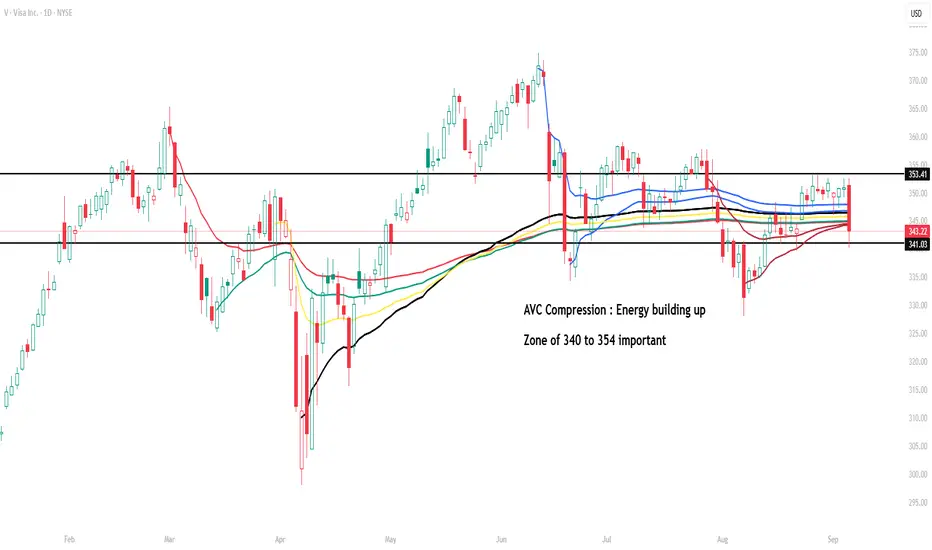
Visa (V) – AVC Compression Around Key Zone 340–354Visa is trading in a compressed zone with multiple Anchored VWAP converging, creating what I call an AVC (Anchored Volume Compression) setup.
This indicates energy is building up, and a decisive move outside the 340–354 range could set the next directional leg.
Support: 340
Resistance: 353–354
Wa
Key facts today
Next report date
—
Report period
—
EPS estimate
—
Revenue estimate
—
8.14 CHF
16.49 B CHF
30.44 B CHF
1.69 B
About Visa Inc.
Sector
Industry
CEO
Ryan McInerney
Website
Headquarters
San Francisco
Founded
1958
ISIN
US92826C8394
FIGI
BBG006TLX3N0
Visa, Inc engages in the provision of digital payment services. It also facilitates global commerce through the transfer of value and information among global network of consumers, merchants, financial institutions, businesses, strategic partners, and government entities. It offers debit card, credit card, prepaid products, commercial payment solutions, and global automated teller machine (ATM). The company was founded by Dee Hock in 1958 and is headquartered in San Francisco, CA.
Related stocks
Visa (V) Buy Signal: 3-Step Rocket Booster StrategyVisa (V) Buy Signal – Daily Trigger + Weekly Pullback + Rocket Booster 🚀💳📈
Visa Inc. (V) NYSE:V is flashing a compelling buy signal, supported by daily price action, weekly momentum readings, and long-term trend confirmation via the Rocket Booster Strategy.
Step 1 – Daily Candlestick: Bullish

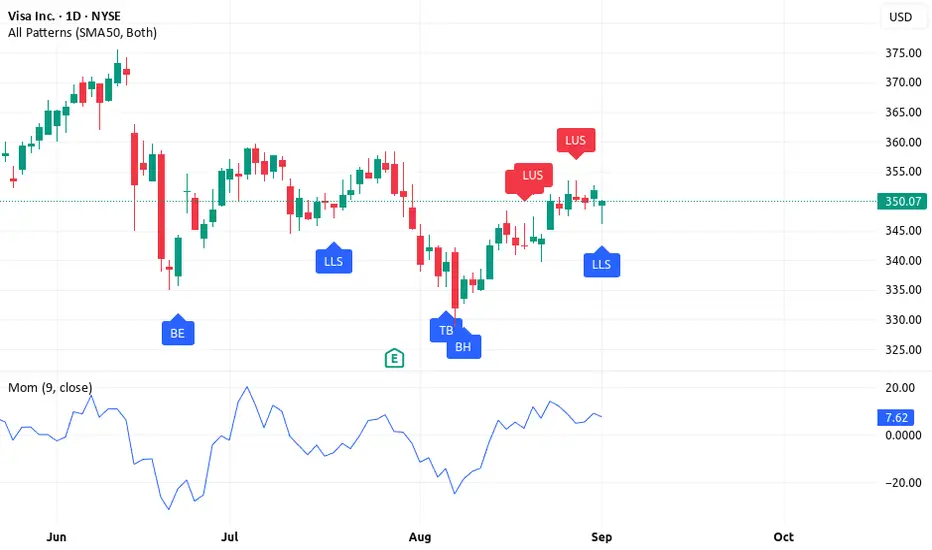
Visa (V) 3 Buy Signals – Trend, Momentum & Price Action Aligned Visa (V) Buy Signal – Multi-Timeframe Confirmation 🚀📈
Visa Inc. (V) NYSE:V is showing a fresh buy opportunity when viewed through the lens of the 3-step trading system: candlesticks, oscillators, and moving averages across different timeframes.
Step 1 – Daily Candlestick: Bullish Rejection
Bullish Continuation Likely Towards H1 Price Targets Current Price: $344.47
Direction: LONG
Targets:
- T1 = $360.00
- T2 = $375.00
Stop Levels:
- S1 = $340.00
- S2 = $335.00
**Wisdom of Professional Traders:**
This analysis synthesizes insights from thousands of professional traders and institutional investors, highlighting a pot

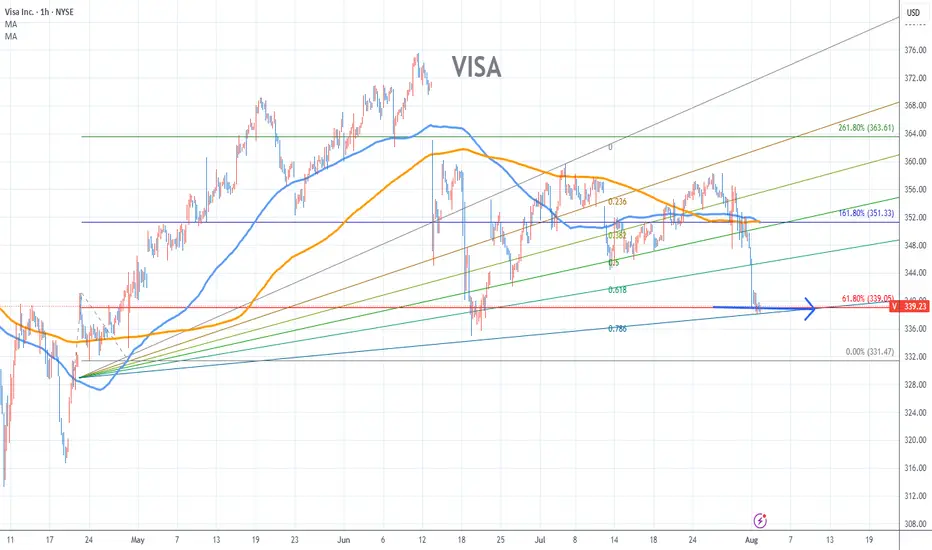
VISA Chart Fibonacci Analysis 080325Trading Idea
1) Find a FIBO slingshot
2) Check FIBO 61.80% level
3) Entry Point 339/61.80%
Chart time frame:B
A) 15 min(1W-3M)
B) 1 hr(3M-6M)
C) 4 hr(6M-1year)
D) 1 day(1-3years)
Stock progress:C
A) Keep rising over 61.80% resistance
B) 61.80% resistance
C) 61.80% support
D) Hit the bottom
E) H
Visa UpsideWe're approaching what I believe is max pain at $435 after impressive earnings from Visa. I think the upside is very much on here

VISA - The missing puzzle piece - Suffering from successI've seen a lot of negative sentiment online lately about the impending bubble, but even with social media, crude AI, and the US dollar being the peak of that negativity this whale has been dying slowly and few have taken notice.
VISA has begun to censor what can be bought, overcharge merchants, an
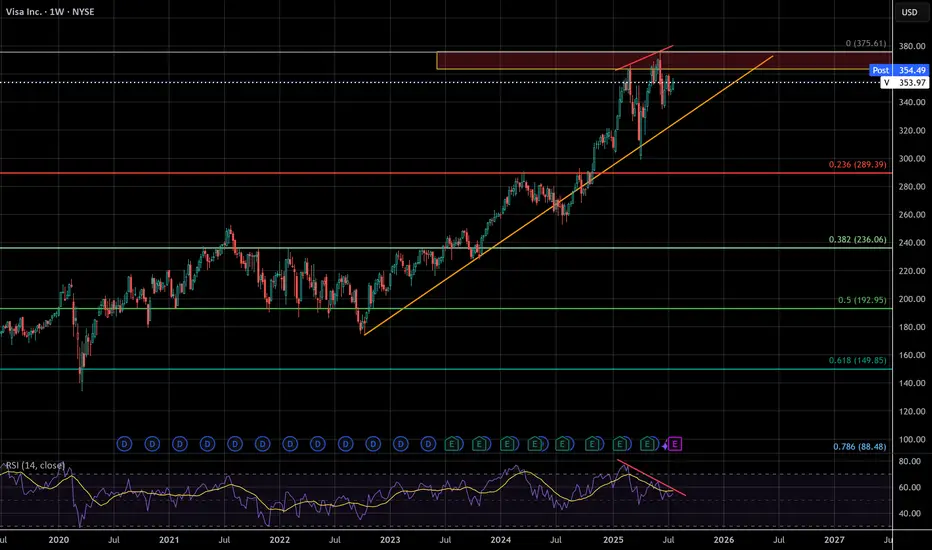
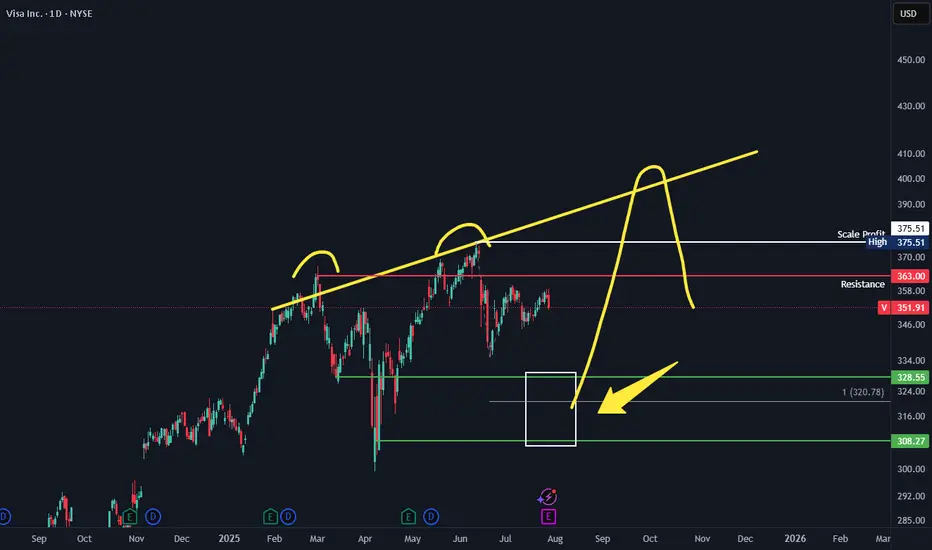
VISA 3 peaks and a dump. Should VISA pullback to the lower support zone. Look to swing long back to ATH with the big target of around 400 where 1 can look to swing short. The typical 3 peaks and a dump setup.
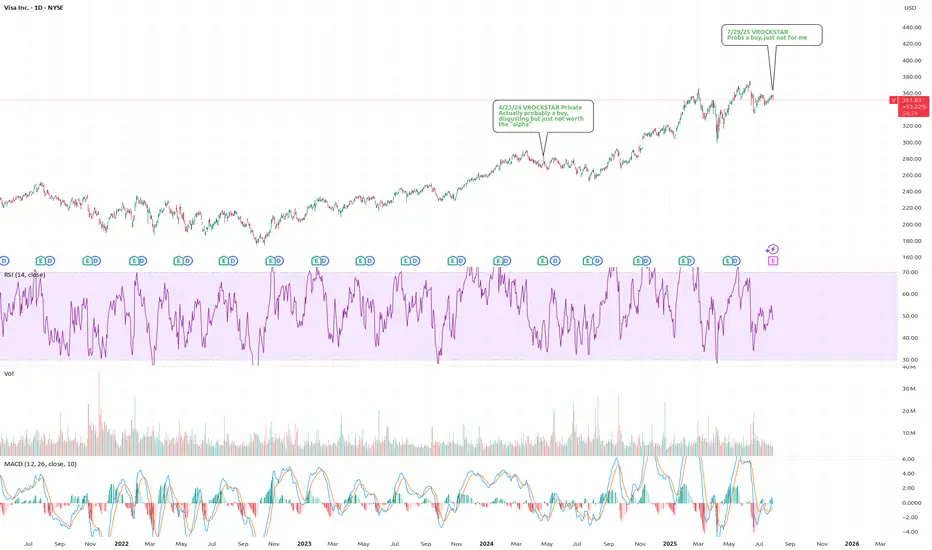
7/29/25 - $v - Probs a buy, just not for me7/29/25 :: VROCKSTAR :: $V
Probs a buy, just not for me
- over 3% fcf yields, growing, consumer spending well
- over time (probably long duration) I think the biz model probably gets eroded, but also mgmt has done a nice job evolving, perhaps they keep up with the times etc.
- don't think anything
betting that $V jumps up to the gap this weekVisa is just taking a breather before its next vacation to the upper Bollinger Bands, so get ready to profit from its upward journey with a strategically placed call spread

See all ideas
Summarizing what the indicators are suggesting.
Neutral
SellBuy
Strong sellStrong buy
Strong sellSellNeutralBuyStrong buy
Neutral
SellBuy
Strong sellStrong buy
Strong sellSellNeutralBuyStrong buy
Neutral
SellBuy
Strong sellStrong buy
Strong sellSellNeutralBuyStrong buy
An aggregate view of professional's ratings.
Neutral
SellBuy
Strong sellStrong buy
Strong sellSellNeutralBuyStrong buy
Neutral
SellBuy
Strong sellStrong buy
Strong sellSellNeutralBuyStrong buy
Neutral
SellBuy
Strong sellStrong buy
Strong sellSellNeutralBuyStrong buy
Displays a symbol's price movements over previous years to identify recurring trends.
V5028512
Visa Inc. 1.1% 15-FEB-2031Yield to maturity
—
Maturity date
Feb 15, 2031
V4972836
Visa Inc. 2.05% 15-APR-2030Yield to maturity
—
Maturity date
Apr 15, 2030
V4972834
Visa Inc. 1.9% 15-APR-2027Yield to maturity
—
Maturity date
Apr 15, 2027
V4972835
Visa Inc. 2.7% 15-APR-2040Yield to maturity
—
Maturity date
Apr 15, 2040
3V68
Visa Inc. 4.3% 14-DEC-2045Yield to maturity
—
Maturity date
Dec 14, 2045
3V67
Visa Inc. 3.15% 14-DEC-2025Yield to maturity
—
Maturity date
Dec 14, 2025
XS247994149
Visa Inc. 1.5% 15-JUN-2026Yield to maturity
—
Maturity date
Jun 15, 2026
XS306372432
Visa Inc. 2.25% 15-MAY-2028Yield to maturity
—
Maturity date
May 15, 2028
XS306372459
Visa Inc. 3.125% 15-MAY-2033Yield to maturity
—
Maturity date
May 15, 2033
XS306372475
Visa Inc. 3.5% 15-MAY-2037Yield to maturity
—
Maturity date
May 15, 2037
XS247994203
Visa Inc. 2.375% 15-JUN-2034Yield to maturity
—
Maturity date
Jun 15, 2034
See all V bonds
Curated watchlists where V is featured.


Frequently Asked Questions
The current price of V is 170.94 CHF — it has decreased by −0.04% in the past 24 hours. Watch Visa Inc. Class A stock price performance more closely on the chart.
Depending on the exchange, the stock ticker may vary. For instance, on SIX exchange Visa Inc. Class A stocks are traded under the ticker V.
We've gathered analysts' opinions on Visa Inc. Class A future price: according to them, V price has a max estimate of 345.83 CHF and a min estimate of 245.30 CHF. Watch V chart and read a more detailed Visa Inc. Class A stock forecast: see what analysts think of Visa Inc. Class A and suggest that you do with its stocks.
V stock is 0.04% volatile and has beta coefficient of 0.88. Track Visa Inc. Class A stock price on the chart and check out the list of the most volatile stocks — is Visa Inc. Class A there?
Today Visa Inc. Class A has the market capitalization of 527.94 B, it has increased by 0.87% over the last week.
Yes, you can track Visa Inc. Class A financials in yearly and quarterly reports right on TradingView.
Visa Inc. Class A is going to release the next earnings report on Oct 28, 2025. Keep track of upcoming events with our Earnings Calendar.
V earnings for the last quarter are 2.36 CHF per share, whereas the estimation was 2.26 CHF resulting in a 4.68% surprise. The estimated earnings for the next quarter are 2.37 CHF per share. See more details about Visa Inc. Class A earnings.
Visa Inc. Class A revenue for the last quarter amounts to 8.07 B CHF, despite the estimated figure of 7.81 B CHF. In the next quarter, revenue is expected to reach 8.47 B CHF.
V net income for the last quarter is 4.14 B CHF, while the quarter before that showed 4.01 B CHF of net income which accounts for 3.26% change. Track more Visa Inc. Class A financial stats to get the full picture.
Yes, V dividends are paid quarterly. The last dividend per share was 0.48 CHF. As of today, Dividend Yield (TTM)% is 0.69%. Tracking Visa Inc. Class A dividends might help you take more informed decisions.
Visa Inc. Class A dividend yield was 0.76% in 2024, and payout ratio reached 21.69%. The year before the numbers were 0.78% and 22.09% correspondingly. See high-dividend stocks and find more opportunities for your portfolio.
As of Sep 9, 2025, the company has 31.6 K employees. See our rating of the largest employees — is Visa Inc. Class A on this list?
EBITDA measures a company's operating performance, its growth signifies an improvement in the efficiency of a company. Visa Inc. Class A EBITDA is 21.71 B CHF, and current EBITDA margin is 70.13%. See more stats in Visa Inc. Class A financial statements.
Like other stocks, V shares are traded on stock exchanges, e.g. Nasdaq, Nyse, Euronext, and the easiest way to buy them is through an online stock broker. To do this, you need to open an account and follow a broker's procedures, then start trading. You can trade Visa Inc. Class A stock right from TradingView charts — choose your broker and connect to your account.
Investing in stocks requires a comprehensive research: you should carefully study all the available data, e.g. company's financials, related news, and its technical analysis. So Visa Inc. Class A technincal analysis shows the buy rating today, and its 1 week rating is strong buy. Since market conditions are prone to changes, it's worth looking a bit further into the future — according to the 1 month rating Visa Inc. Class A stock shows the strong buy signal. See more of Visa Inc. Class A technicals for a more comprehensive analysis.
If you're still not sure, try looking for inspiration in our curated watchlists.
If you're still not sure, try looking for inspiration in our curated watchlists.