Exxon Mobil Signals Profit Dip Amidst Weak Oil and Gas PricesExxon Mobil ( NYSE:XOM ) faces turbulent seas ahead as it braces for a dip in first-quarter operating results, signaling a departure from the record-breaking profits of yesteryears. With weaker oil and gas prices, coupled with significant losses in fuel derivatives, Exxon ( NYSE:XOM ) finds itself navigating through challenging terrain after two years of unprecedented prosperity.
Navigating Market Volatility:
The once-profitable energy giant now grapples with the impact of fluctuating natural gas prices and fuel derivatives, marking a stark reversal from the buoyant market conditions of previous quarters. Despite its efforts to weather the storm, Exxon's operating profit for the quarter is projected to plummet, underscoring the harsh realities of a volatile market environment.
Profit Projections and Investor Sentiment:
Investors brace for a downturn in Exxon's fortunes, with adjusted per-share profit expected to fall short of previous benchmarks. Financial firm LSEG's consensus estimate paints a sobering picture, reflecting a decline in profitability compared to the company's robust performance in the year-ago period. As Exxon's profitability wanes, investor confidence faces a stern test amidst mounting uncertainties.
Factors Contributing to Profit Erosion:
The erosion of Exxon's profits can be attributed to a confluence of factors, including plummeting natural gas prices and adverse movements in fuel derivatives. The company's bottom line takes a hit as refining maintenance costs surge, exacerbating the financial strain caused by weakened market conditions. Against this backdrop, Exxon grapples with the formidable task of mitigating losses and safeguarding shareholder value.
Strategic Moves Amidst Adversity:
In the face of adversity, Exxon ( NYSE:XOM ) remains proactive in its pursuit of strategic opportunities to bolster its position in the market. From all-stock deals with U.S. shale oil producers to assertive claims over prized assets, Exxon ( NYSE:XOM ) demonstrates resilience in the face of market headwinds. However, the path forward remains fraught with challenges as the company navigates a rapidly evolving energy landscape.
Technical Outlook
Exxon Mobil ( NYSE:XOM ) stock is trading above the 200, 100, and 50-day Moving Averages respectively with a Relative Strength Index (RSI) of 85.21 indicating an overbought position for the stock. NYSE:XOM 's 1-day chart shows a cup and handle pattern indicting the potential for a downturn at any moment.
XOM trade ideas

Lookin bullish immediately on XOM!🔉Sound on!🔉
Thank you as always for watching my videos. I hope that you learned something very educational! Please feel free to like, share, and comment on this post. Remember only risk what you are willing to lose. Trading is very risky but it can change your life!

Exxon Mobil - Increased probability of appreciationInterpretation:
Previously disorganized Fibo clouds have gradually lined up giving favorable support to the evolution of the candles. The compacting of fibo clouds from different timeframes signals direction and strength towards the first target to be reached
Reaching the first target makes it necessary to move the stop loss to the position where the entry was made. The purpose of this action is to protect the result that has been achieved and to ensure that there is plenty of time to search for the remaining targets with a reduced risk of losing the trade.
The use of risk management, an integral part of this method, has been fundamental in achieving planned results.
Risk Return Ratio 3

XOM is on a Slippery SlopeXOM near ATH. With Bearish Divergence on the Monthly, I’m expecting a break out and rejection. Once the shooting star candle forms on the weekly, enter below the close with a 5M time horizon. I’m eyeing the 105P or 100P for September. Judging by Volume and Open Interest, I’m expecting a large move down in conjunction of an economic event.


XOMExxon Mobil. Dividend aristocrat.
Dividend stocks, when you look at historical data, have performed well since the last rate hike in the cycle.
Finish correction.
tp1 117
tp2 133

Exxon Mobil Is On The Way HigherExxon Mobil with ticker XOM is back in the uptrend after a completed (A)-(B)-(C) irregular flat correction for wave 4. It's in strong rally away from projected support for wave 4, so wave 5 can be now in progress, which should be completed by a five-wave cycle of the lower degree. It can easily send the price towards all-time highs, just be aware of subwave (4) pullback. At the same time Crude oil could be headed to 85-90, maybe even 100 area.

Buy XOM - Triple tree corrective wave doneThe triple three corrective wave of NYSE:XOM is done and is likely seeing further upside. We are likely on a strong impulse wave

Exxon Mobil Exxon Mobil is going up strong to the all time high,
Expecting strong reaction from that area,
Volume is going down in the last 2 3 weeks witch means bulls are getting weaker,
If we look into the valuation ratios , the company is getting overvalued,
If we look at the 10 Ma on weekly we can see that price is getting away from MA fast witch indicates that the company is getting overvalued quickly,
It will be interesting to see how price will react from that area when it goes up, But overall trend is bullish,

EXXON MOBIL This sell signal will take it to $105.00 minimum.Exxon Mobil (XOM) has been on a tremendous since the January 18 bottom and even more so since the start of this month (March). We are about to form a Golden Cross on the 1D time-frame and last time this pattern emerged (September 20 2023), the market top was formed a week after.
In fact all Tops since November 2022 where formed on a Higher High sequence, confirmed by a 1D MACD Bearish Cross. As a result, we are waiting for the ideal sell opportunity on Exxon's next High and we will enter it after the MACD forms a Bearish Cross. All previous 3 corrective waves have hit at least the 0.618 Fibonacci retracement level. That gives us a medium-term Target of $105.00.
-------------------------------------------------------------------------------
** Please LIKE 👍, FOLLOW ✅, SHARE 🙌 and COMMENT ✍ if you enjoy this idea! Also share your ideas and charts in the comments section below! This is best way to keep it relevant, support us, keep the content here free and allow the idea to reach as many people as possible. **
-------------------------------------------------------------------------------
💸💸💸💸💸💸
👇 👇 👇 👇 👇 👇

Exxon Mobil - XOM - Bullish 5th wave?After correcting for nearly a year is this stock (and energy along with it) starting to make it's move? According to this count, the wave 2 correction was deep so the wave 4 may be shallow. A decent break above the 120 level may lend a bit more weight to this count. The alternative red count is perhaps even more bullish. Watch this space

XOM Potential Buy setupReasons for bullish bias:
- Safe entry at breakout for confirmation
- Price bounced from strong support
- SL below support
Entry Level (Buy Stop): 105.36
Stop Loss Level: 95.40
Take Profit Level 1: 115.32

Exxon Mobil: On the Brink of a Collapse?Having not reviewed Exxon Mobil for a while, it's important to note its strong correlation with oil prices, on which we're currently positioned in a short trade. Accordingly, we also anticipate a downward trend for Exxon Mobil that has yet to conclude. The construction of Wave E or overarching Wave (A) peaked at approximately $96. The critical question now is whether we're forming a Flat in the form of either a Regular or Expanded Flat.
We'll observe how this unfolds without making speculative judgments due to the unusual nature of witnessing an ABCDE movement towards Wave (A). Over the next year, we expect Exxon Mobil to decline, targeting a retracement between $75 and $50 as the maximum. Any level within this range presents a solid buying opportunity for a long-term investment, anticipating a robust Wave III.

Exxon - Quarterly Chart - LongExxon is currently one of the largest positions in my portfolio. My price target for this stock is 262, but I am also keeping a stop loss at 80. The stock has been consolidating since 2006, but it appears to be breaking out now. In my opinion, this is just the beginning of a potentially lucrative trend.

Looking for XOM to push out of the squeezeI am looking for an intraday push out of the Bollinger band squeeze.
The 15 min display shows a strong bullish momentum with periodic squeeze and push.
The middle pane shows the RSI(white) and the Williams %R (yellow) with a 20 EMA for %R signal.

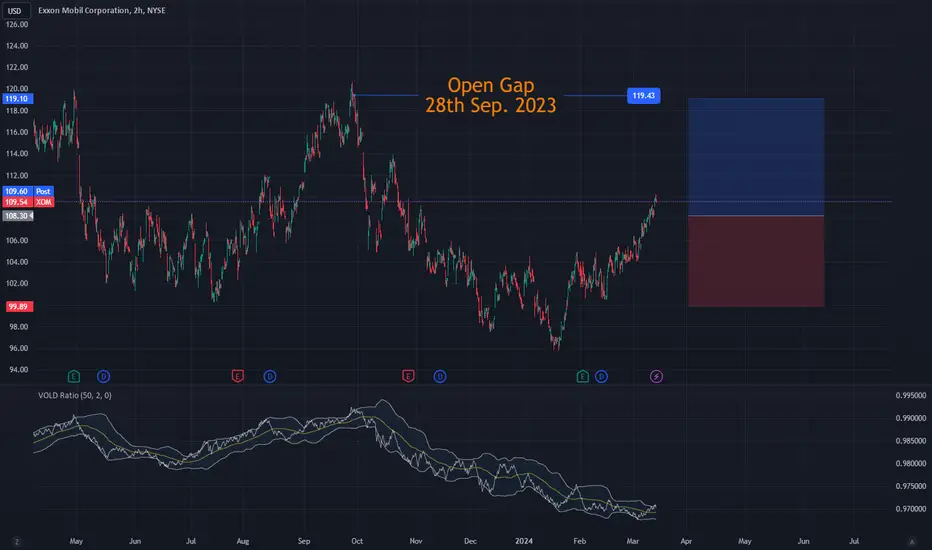
Exxon Stocks Surge: All-Time Highs in SightMajor oil companies such as Exxon are currently benefiting from rising oil prices. After the share price of the world's most valuable company had experienced a downward trend for a long time, a significant turnaround was achieved in 2020. In September 2023, Exxon shares reached new all-time highs. This was followed by a correction, as oil prices remained relatively moderate despite the escalation of the Middle East conflict in October 2023. Exxon shares are now on the verge of another attempt to reach all-time highs. For us, this is a favorable opportunity for a long trade targeting the open gap from September 28, 2023. First, we want to wait for a minor pullback to the $108.30 area, where a new price gap exists. This gap should be closed before the price reaches our target zone. We therefore place a buy stop order to optimize our risk/reward ratio, which is around 1.2:1 for this trading idea.
XOM Exxon Mobil Corporation Options Ahead of EarningsIf you haven`t bought XOM ahead of the previous earnings:
Then analyzing the options chain and the chart patterns of XOM Exxon Mobil Corporation prior to the earnings report this week,
I would consider purchasing the 105usd strike price Calls with
an expiration date of 2024-3-15,
for a premium of approximately $2.37.
If these options prove to be profitable prior to the earnings release, I would sell at least half of them.

Looking bullish immediately on XOM!Thank you as always for watching my videos! Please feel free to like, share and comment on this post. May God bless you and your family!

2/27: XOM Upside TradeVery simple setup on NYSE:XOM to get back into the habit of posting. Using our fibonacci retracement tool, XOM gave us a very clear bounce off .5. I have drawn a bearish FVG right before we retested .5 at Tuesday's close of day. I'm expecting to see this FVG broken and any entries above $104.70 should be a clear shot to $106 no later than Wednesday next week. Happy trading

Exxon Mobil to add in Portfolio Hello
We identified a buy signal with high probability on Exxon Mobil corporate in Monthly chart for a target of $119.7 within a few Months.
Ibrouri

$XOM Is Undervalued. The logic is that price will gravitate to liquidity. Exxon Mobile seems to have an abnormal amount of liquidity sitting above all time highs. Gut says we take out those highs pretty soon.
Here are some other considerations:
-Exxon Mobil also currently has the highest percentage of short interest in modern history.
-The company has a low valuation of 11x earnings, pays a 3.66% dividend yield with over 40 years of consecutive annual dividend growth, and its balance sheet has a AA- credit rating.
-Exxon earns twice as much income and 7.5x as much revenue as Nvidia.
-Warren Buffett has been adding to their oil positions (Buffet Effect).
-Energy sector sentiment is quite poor.

XOM - long ideaImpulse, followed by a correction (flat pattern 3-3-5). Target for the next wave up $15.
Daily chart is promising, expect a longer-term trend (see in the update)

$XOM Short Swing EarningsNYSE:XOM just recently had earnings
I'm looking at swinging puts tomorrow because the Jeanius Algo Suite (Indicator/Screener) gave me multiple sell confluences:
Rose through 2 untested highs (~$104.91), grabbing liquidity
Retested the level that price broke to create a Change of Character (CHOCH)
Tested a downtrend line
Broke and retested an uptrend line
In a long term and short term structural downtrend
The indicator automatically painted the lines/zones on the chart
