fundamental analysis (XOM)Limit buy - 54,0$
Target:
№1 - 60,65
№2 - 63,90
Risk/Reward Ratio - 3,05
Stop-loss - 51,82
Trade ideas

EXOON MOBIL: FUNDAMENTAL ANALYSIS + PRICE ACTION |SHORT VIEW 🔔urning oil creates carbon and contributes to global warming. That is a fact that cannot be ignored, and one of the main reasons why the world seeks to limit its use in the future. As a result, clean energy is becoming a major resource for the world's energy supply. But it has not yet reached that level, which means that oil is still an important part of the global energy supply.
The International Energy Agency estimates that global oil demand could rise to 104.1 million barrels per day in 2026 from 96.5 million barrels per day in 2021. The agency predicts that market demand will begin to plateau in 2030. In the last decade, 60% of the growth in oil demand has come from road transportation. However, a shift to more electric vehicles is looming.
However, the petrochemical industry's need for oil may persist. The IEA expects the petrochemical industry to account for 60% of oil demand growth over the next decade due to demand for plastics. The petrochemical sector's appetite for oil should grow along with global population growth and economic growth, especially in emerging economies.
Even if one takes these projections at face value, it is still fair to assume that it will be several years before oil demand begins to decline, even if it reaches a point earlier where it stops growing strongly. That should be enough to keep the big oil companies profitable for years to come. ExxonMobil operates all over the world and has a significant presence in Asia.
There is a bearish part to the argument: ExxonMobil's net income and EBITDA have been trending downward for the past decade.
Even more troubling, the company's debt levels have risen, and its return on invested capital has declined.
Commodity prices, such as oil and natural gas, are subject to large fluctuations and can remain low or high for long periods of time depending on political or macroeconomic factors. These changes directly affect ExxonMobil's earnings. As an example, ExxonMobil posted a profit of $4.7 billion in the second quarter, compared to a loss of $1.1 billion in the previous quarter.
Since the end of 2020, the company has reduced its debt by $7 billion. Its cost-cutting efforts have saved it $4 billion in structural costs over the past 18 months. By 2023, the total savings will be $6 billion. The company also cut its annual capital spending from more than $24 billion in 2019 to $17 billion in 2020. Management now expects capital spending to be near the lower end of its 2021 projection of $16 billion to $19 billion. In short, the company is moving in the right direction.
Nevertheless, ExxonMobil may not return to the level of earnings growth it showed during the shale boom. That's partly because oil demand growth is expected to slow. Even if higher commodity prices and stable demand allow the company to reduce debt and maintain dividend payments, earnings growth is likely to be limited. Moreover, projected conditions could put downward pressure on prices, and the influence of the Organization of the Petroleum Exporting Countries (OPEC) and its individual members could keep oil prices volatile.
For all of these reasons, ExxonMobil stock may continue to underperform the broader market over the next decade. Investors will be able to find better dividends and growth opportunities elsewhere.

$XOM trying to strike oilLong the 10/15 $55 calls.
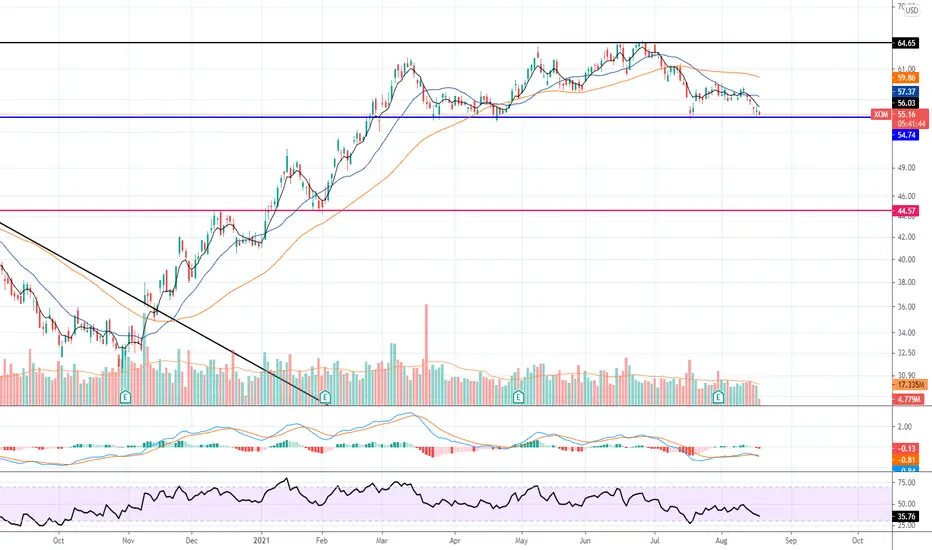
Exxon respecting the AVWAP from recent lows and 200MA. MACD looks ready to cross.
Barring any market weakness from FED meetings, she looks ready for a move up.

XOM waiting for the test to complete-options swing Lets wait for XOM to pass the test. PT will be $53.70. As of now it looks buyers are not weak

Elliott Wave View: Rally in Exxon Mobil (XOM) Should Find SellerShort-term Elliott wave view in Exxon Mobil (XOM) suggests that the cycle from June 25, 2021 high is unfolding as a double three Elliott Wave structure. Down from June 25, wave (W) ended at 54.59 and rally in wave (X) ended at 59.33. The stock has broken below wave (W), creating an incomplete bearish sequence from June 25 peak favoring more downside. The break below wave (W) also confirms that wave (Y) lower is in progress.
Internal subdivision of wave (Y) is unfolding as a zigzag in lesser degree. Down from wave (X), wave ((i)) ended at 56.79 and rally in wave ((ii)) ended at 58.50. The stock then extended lower in wave ((iii)) towards 52.10. Expect rally in wave ((iv)) to fail in 3, 7, or 11 swing for further downside in wave ((v)) of A. Then it should correct the entire 5 waves down in larger degree wave B before the decline resumes. Potential target for wave ((iv)) correction is 23.6 – 38.2% Fibonacci retracement of wave ((iii)) at 53.62 – 54.55. Near term, as far as pivot at 59.54 high remains intact, expect rally to fail in 3, 7, or 11 swing for further downside.

EXXON MOBILEChart is printing a bullish Rectangle continuation pattern.
Still on Strong support zone.
Stop Loss 52 in case of down ward break down, further can short with target of 44
while upward target is around 75

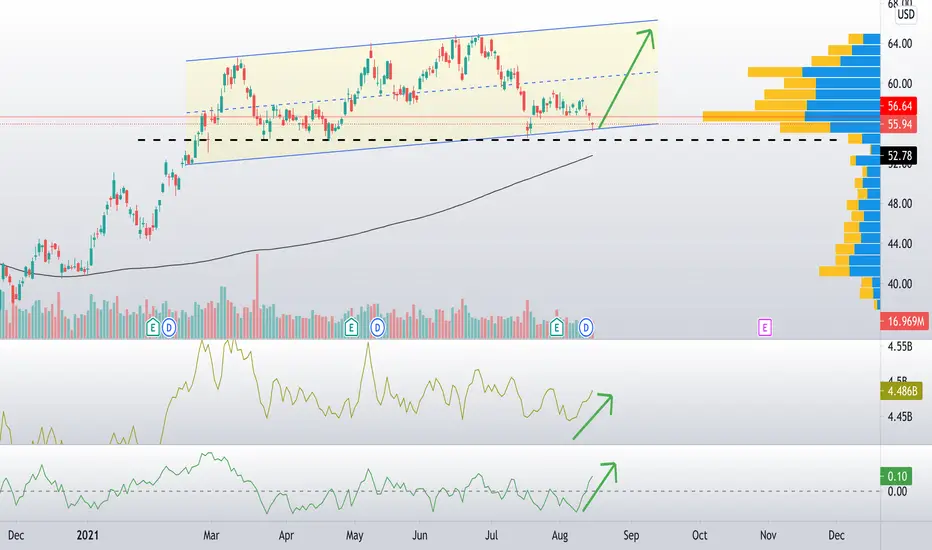
$XOM Trading the Channel and Bullish DivergenceOpened a 55C 10/15 3.07 and looking for a move to at least top of the channel.
Bottom of channel AND volume shelf. BULLISH divergence in CMF and A/D indicators signaling a future move up.
Equity levels signaling strong support at $54.58, break below this shelf invalidates the trade.
Exxon Mobile XOM sloppy head and shoulders and down trendDoesn't look good for plastics or oil here. Next to zero on volume and a continued down trend.


XOM to 52We have seen signs to dictate that XOM was heading to the downside and we have got just that. The initial signs of bearishness was the Weis Wave showing that less buying volume was used in its recent push towards the upwards. Now we are seeing increasing selling momentum. The greatest sign of bearishness is our EMA crossovers on the Willy showing that the dominant trend is towards the downside following the incredibly bearish signs we are seeing on the weekly showing that buying volume has decreased.
Bearish Signals
-Selling Momentum
-Weis Wave(4h+weekly)
-Willy Oscillator
Price Target
-52

XOM -- SQUEEZE ANALYSISI have a position in this for 9/17 62.5c
We are currently in a consolidation after the sell off. I have noted key points on the chart. In addition to those points, I also have a few others. The gap fill mentioned would actually be a move down to the bottom bands on the squeeze channel on the WKLY timeframe. We were also recently rejected at the midline (20ma) on the WKLY. That being said the consolidation could last longer, and drop lower. I am playing the 4HR/Daily channel for a short options play. I am looking for a move to resistance at 58.23.. But it first has to pass 57.70. There are gaps between the current price 57.35-->57.70, and 57.70-58.23
The 4HR chart BB midline is 57.67, which is initial resistance.
PT1 @ 58.00
PT2 @ 58.23 (see WHT .382 fib @ 58.17)
PT3 @58.50 (see PINK .382 fib @ 58.53)
PT4 @59.00 (see WHT .618 fib @ 59.01) LOFTY
I expect PT2 or PT2 to hold, with old resistance at 57.70 (middle band) becoming new support.
** There was heavy buying volume into the close today on 8/12/21.

XOM - waiting on the calm seeNYSE:XOM
in my opinion we have a time like in 2005 - there was a year of great pump up the index up and right now there will be a year for consolidation.
I have opened two position. Round 42 USD and 60.
I will not sell it very fast. I will wait 2 or 3 years.
XOM is the future of the USA economy so I think that it is a gold duck bearing gold eggs.
I wish you al the best.


$XOM with a Bearish outlook following its earnings #Stocks The PEAD projected a Bearish outlook for $XOM after a Negative Under reaction following its earnings release placing the stock in drift D
If you would like to see the Drift for another stock please message us. Also click on the Like Button if this was useful and follow us or join us.

Great Entry on XOMXOM has hit its Fibonacci Support while also showing signs that a bullish squeeze may appear. There has been a reduction in selling momentum while the Willy Shows a potential EMA crossover to be had. We have weekly resistance at 62.50 which would be a great point to watch if choosing to go long on this stock. A wise decision may be to wait for bullish momentum and for an ema crossover to officially occur to make sure this isn't a false signal.
Bullish Signals
-Potential EMA crossover
-Squeeze indicator
-Fibonacci Support
Weekly Resistance
-62.50

Exxon Mobil touching Pre-COVID low prices | Fundamentals/TechnicDisclaimer: I am not a FINANCIAL advisor as this is just my own due diligence. It is not intended as legal, financial or investment advice and should not be construed or relied on as such. Before making any commitment of a legal or financial nature you should seek advice from a qualified and registered legal practitioner or financial or investment adviser.
Exxon Mobil and other OIL giants regardless if they're midstream, upstream, lowstream oil companies, has been one of the industries that has underperformed the market for a LONG time.
Technicals:
As seen in the chart, there's good reason for XOM to hold this support level (highlighted in green) and as of right now, there's a major confluence area with the support level and the 200 EMA: ohlc4.
The only thing that we're looking for, in XOM is for the RSI to break-through 50.
Not only that, but when we cross-reference USOIL/XOM it's currently hovering above 1.2:
USOIL/XOM
What this chart tells us is if XOM's percentage change is any different to USOIL's percentage change. Historically speaking, USOIL/XOM has only ever been below 0.5-0.9 which is a sign that XOM always overpowers USOIL's percentage change (This has been consistent ever since 2015)
It has been traded at a very unfair price in proportion to WTI and USOIL and that shows on the USOIL/XOM ratio
Now time for the fundamentals, the main bullish thesis for XOM:
Exxon has repeatedly and consistently beat earnings for the past FOUR quarters and none of those earnings beat have been less than a 5% beat. With a consistent trend of beating earnings, Exxon could be on the horizon of breaking through Pre-COVID lows .
Not only that, but during the recession, the company has done tremendous work on restructuring the company and have been working on increasing operating and profit margins for the past year which is evident through the layoffs that have been occuring for the company and the smart tactic of halting off employee retirement accounts in order to address short-term issues
You're maybe wondering:
"It could be because they missed on Revenues which is why they aren't seeing as much growth progress on the stock"
Nope!
Exxon has outperformed in terms of Earnings AND Revenue, for the past 2 quarters, they have beaten revenues by nearly $3 billion to $5 billion. Even back in Q1 of 2021 (February) Even they missed revenues by $1-$2 billion approximately yet the stock price rallied.
Now, it shouldn't be the case that a stock should trade at X based on earnings, but what I'm trying to say is that if the trend of beating earnings and revenue estimates continue and go on until 2022, Exxon could be fairly traded at a price of $75-$80 based on the margins, estimates, etc.
We could apply an exit multiple and, based on my spreadsheet, Exxon should be trading based on all of these multiples (Based on estimates):
2021
fair val. ev/ebitda $141.37
fair val. ev/ebit $81.25
fair val. ev/s $67.37
fair val. p/e $74.56
fair val. p/s $72.09
average $87.33
median $74.56
Also, not to mention, the average expected price for Exxon matches up by adding a 2018/2021E ratio as 2021 estimates are currently trading at nearly the exact same cash flows and EPS with EBITDA estimates matching up more than 2018 EBITDA (Except for EBIT as 2018 EBIT is higher than expected 2021 EBIT).
That's all for my analysis, for those wondering how the above calculations work, it only works on companies that do not dilute outstanding shares or buyback those same shares.
It's basically an exit multiple.
That's all, goodbye!

XOM Bull Flag brokenNow when bull flag is broken, it takes nothing more than breaking premarket high for stock to have a bull run


$XOM Bull Flag54.59 support held very well. There is very nice bull flag formed above it. Yesterday (7/26) bullish momentum started. Today (7/27) if we see momentum to the new high it means bull flag is broken and we can expect another bullish momentum.

Bullish on XOMXOM has recently bounced off of its Fibonacci support while the MACD is displaying a potential buy signal as seen by the continuous reductions in selling pressure. I am bullish on the daily time frame for a swing to 64 but as the daily plays out I want to see if the weekly MACD displays any potential buy signals.
Bullish Signals
-MACD (less selling pressure)
-B% is low
-Bounced off of Fibonacci Support

ExxonMobil - still undervaluedPrice is below its 5-year moving average
Likely, we are in a weekly third wave up.

ExxonMobil (XOM) Nice Entry Point on D1 timeframe.ExxonMobil (XOM),D1: Mirror support level + Bollinger bands + Spinning tops + Oversold
