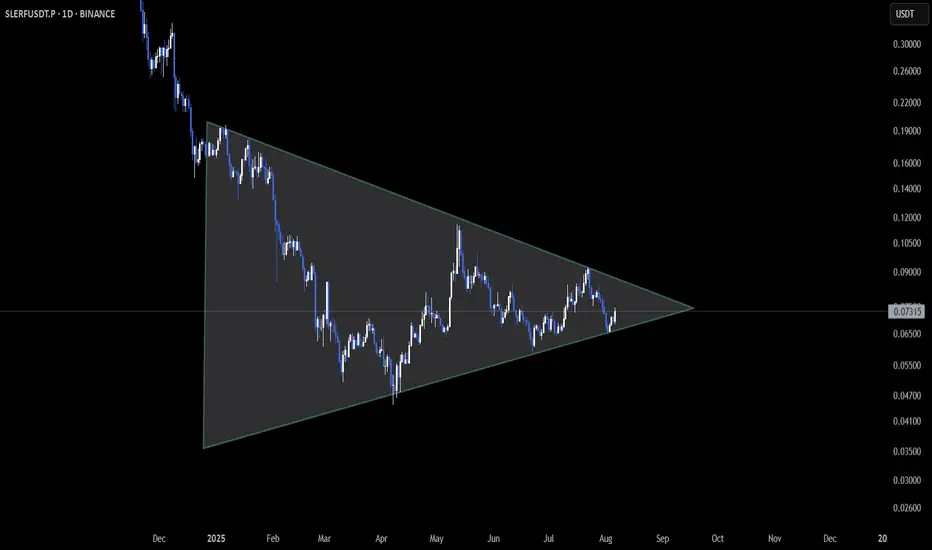
SLERFUSDT – Symmetrical Triangle Breakout OKX:SLERFUSDT has been trading within a symmetrical triangle pattern on the daily chart, with its price compressing between higher lows and lower highs. The chart currently shows signs of a breakout above the triangle's resistance. If confirmed, this could trigger a bullish move toward the $0.16–
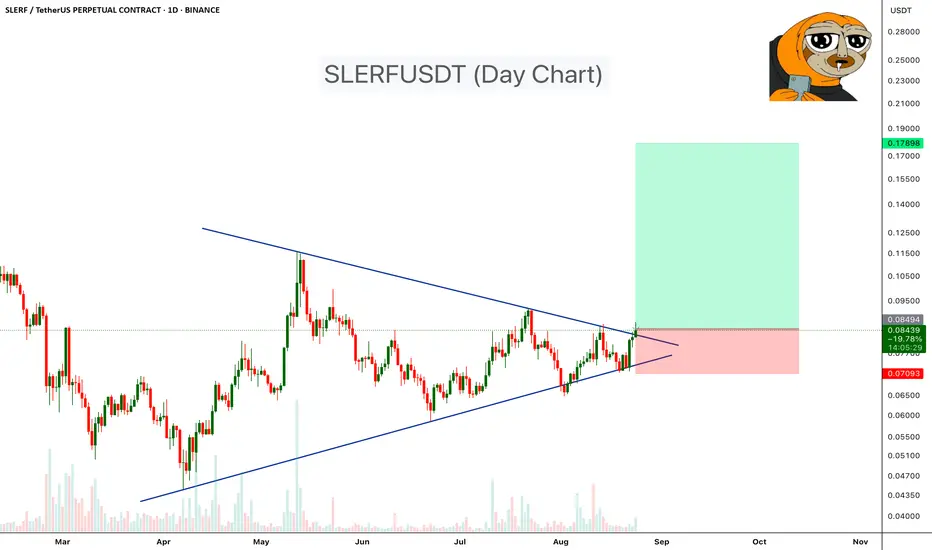
SLERFUSDT Triangle Squeeze – Breakout Imminent!SLERFUSDT has been trading inside a symmetrical triangle formation on the daily chart since April 2025, with higher lows meeting lower highs as price coils toward the apex. This tightening price action often leads to a decisive breakout in either direction once volatility returns.
Currently, SLERF
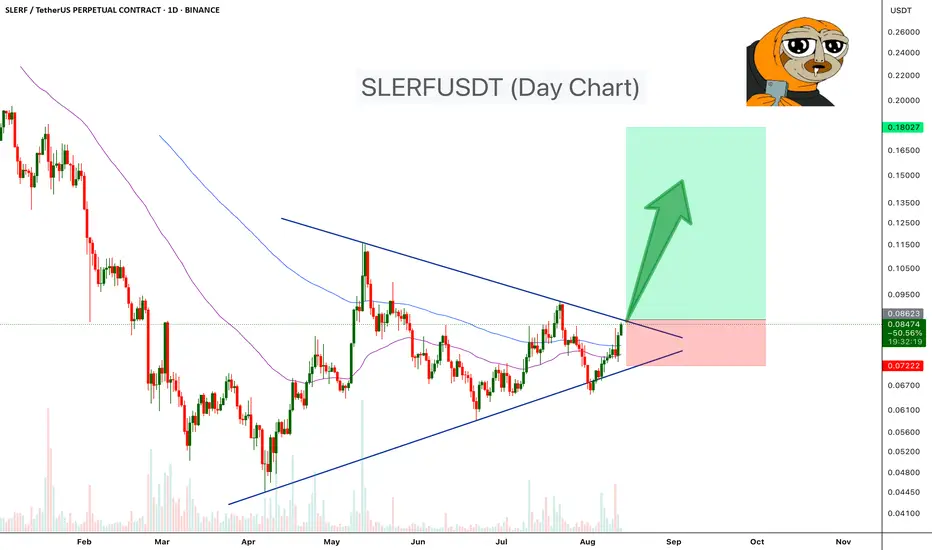
SLERF – Bouncing from Triangle Support📆 On the Daily timeframe, $SLERF is trading inside a symmetrical triangle and just bounced off the lower support zone 🔄.
This shows bulls are defending the structure — but compression is tightening 📐.
A breakout could spark upside momentum, while a breakdown risks further selling pressure ⚠️.
👀 Hi
Slerfusdt short opportunitySLERFUSDT has broken down from a bearish pennant, with the price now trading below the pattern and targeting its projected low. The optimal selling area is the sell-off zone, we advised to wait for the bearish target indicated on the chart.

SLERF: Potential 800% RallyWe’ve experienced significant red weeks recently, but it seems the market just had a fakeout below the channel followed by a swift recovery. I believe we’ve bottomed out and that we could eventually hit the 4.236 Fib level. Notably, this aligns with the 1 Fib level if you project the high from March

Slerfhere is the details about my analysis i hope you guys enjoy it manage your risk right and wish you best of the luck

SLERF - High Time Frame Gartley LongThere is a good Gartley Long that has almost hit the 786. There has been a premature reaction 5% above the 786 signaling some interest down here. Thank you

Analysis with recommendation to buy SLERFThe SLERF coin is forming a reversal Harami over an important support on the daily chart, which should be confirmed when the chart closes later.
I am opening a buy position, because the risk-reward ratio is very favorable.
Reasons for buying:
1 - Reversal over important support.
2 - Excellent ri

Short opportunity in SLERF/USDTIf break out the level 0.3105 with a 15 Min red candle, there is an opportunity for short.
Disclaimer : I'm not recommending to take this entry. Do with your analysis too.
Reasons : -
. Trend line breakout.
. A major support level breakout.
. Increasing volume of sellers.
After Breakout :-
Entr

slerfSupport and press the rocket to cheer me up
Observe the ten percent loss limit
Stay away from Bitcoins
Feel free to buy and sell and post your comments

See all ideas
Summarizing what the indicators are suggesting.
Oscillators
Neutral
SellBuy
Strong sellStrong buy
Strong sellSellNeutralBuyStrong buy
Oscillators
Neutral
SellBuy
Strong sellStrong buy
Strong sellSellNeutralBuyStrong buy
Summary
Neutral
SellBuy
Strong sellStrong buy
Strong sellSellNeutralBuyStrong buy
Summary
Neutral
SellBuy
Strong sellStrong buy
Strong sellSellNeutralBuyStrong buy
Summary
Neutral
SellBuy
Strong sellStrong buy
Strong sellSellNeutralBuyStrong buy
Moving Averages
Neutral
SellBuy
Strong sellStrong buy
Strong sellSellNeutralBuyStrong buy
Moving Averages
Neutral
SellBuy
Strong sellStrong buy
Strong sellSellNeutralBuyStrong buy
Displays a symbol's price movements over previous years to identify recurring trends.