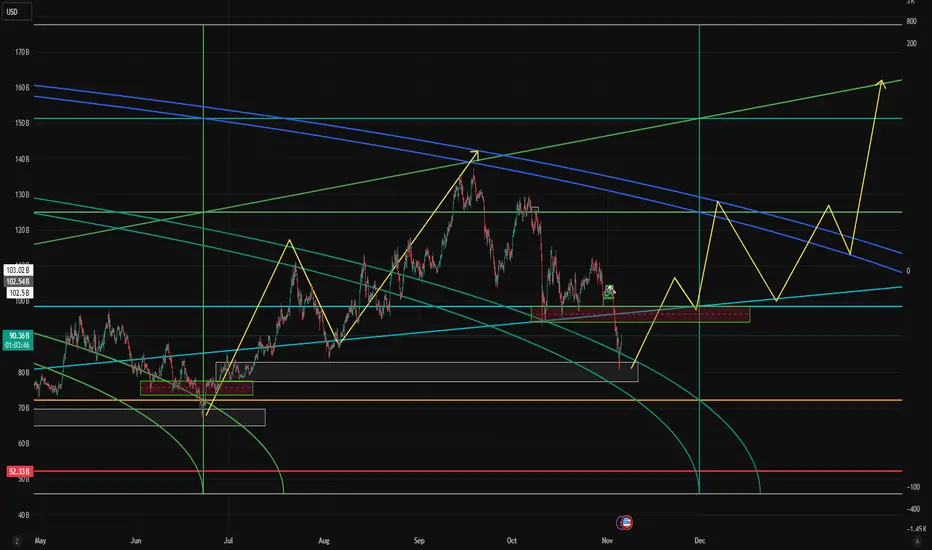
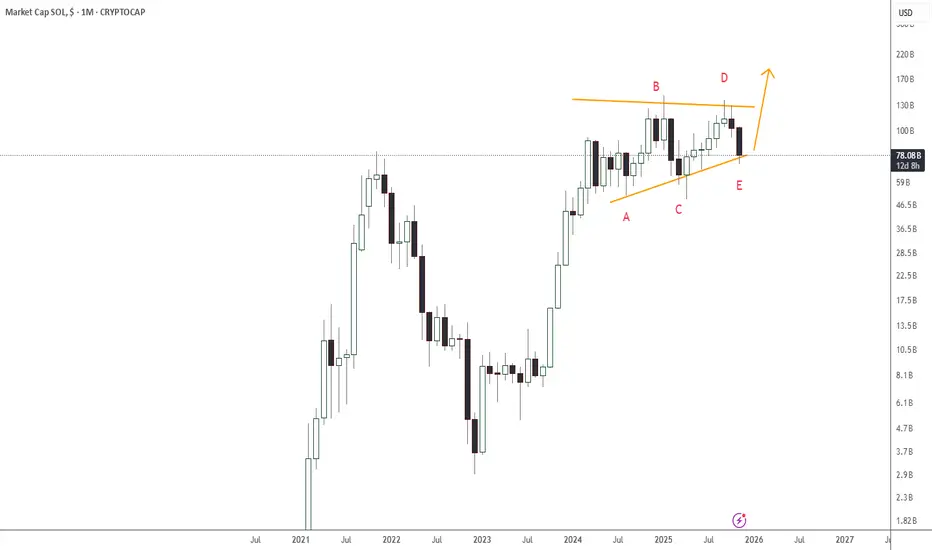
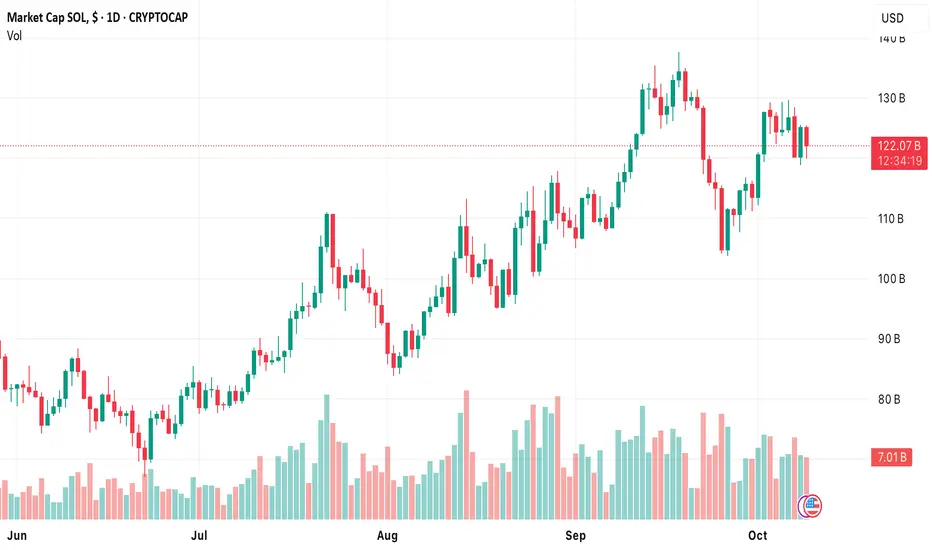
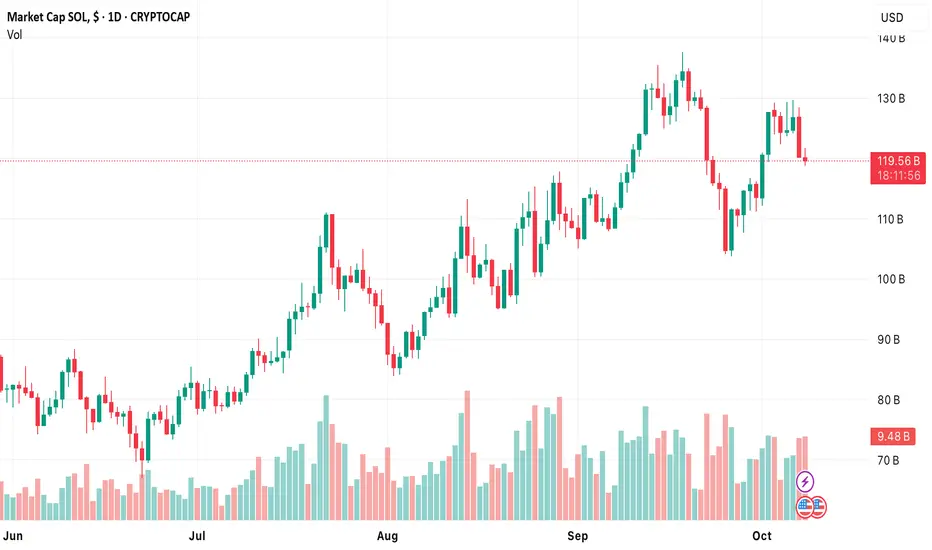
Hi, this is $SOLCould this be the next 100% pump on CRYPTOCAP:SOL ??
What we are witnessing is people selling entire portfolios at a loss.
Panic is in and it seems like it started a potential flame for a new bull rally.
Thanks for reading this very brief perspective.
Comment, Like & Share.
Key data points
Previous close
—
Open
—
Day's range
—
About Market Cap SOL, $
Coin
Solana is a protocol praised a lot for its performance and speed — all for the sake of facilitating decentralized apps. The protocol is even doted on for its Proof-of-history consensus that improves scalability and, consequently, usability. Some bold fans even say Solana is a future rival of Ethereum. How true this is, we can't know, but we can try to evaluate how well the network is doing at the moment by watching market cap of its native token, SOL — we've calculated it and displayed on the chart so that you can stay informed and prepared in any market scenario.
SOL/USD — Technical Breakdown as Downtrend StrengthensSOL/USD has broken below its long-term ascending channel and has been forming a new three-month downtrend, confirming a major structural shift in market sentiment.
The pair is currently testing the 156.25 level (Murray ). A confirmed breakdown below this support would open the way toward:
• 125.0

SOL/USD — Solana Tests Key Support as Bulls Lose MomentumSolana (SOL/USD) continues to trade within a long-term ascending channel, though the pair is now hovering near the lower boundary of that structure. Market sentiment remains cautious after Fed Chair Jerome Powell’s comments on Wednesday, suggesting the central bank may keep rates unchanged in Decemb

SOL/USD — Price Tests Key Support in Long-Term UptrendSOL/USD continues to trade within a long-term ascending channel, but in the past two weeks, the pair has been testing its lower boundary, showing early signs of potential breakdown. A confirmed move below the 187.50–183.80 zone (Murray , 50.0% Fibonacci retracement) could accelerate the decline tow
SOL/USD — SEC Delay and Trade Tensions Pressure SolanaSOL/USD slid lower this week after briefly rebounding to 211.30, as global and regulatory uncertainty continues to weigh on sentiment. The rally was initially driven by the CME Group’s launch of options linked to SOL and XRP futures, drawing major liquidity providers like Galaxy, Wintermute, Cumberl

Solana Price Prediction SOL Defends $200 as DEX Volumes Beat ETHSolana (SOL) is holding $200 amid buyer defense of key trendline support, showcasing resilience as its DEX volumes surpass Ethereum's. Trading near $203 after stabilizing from $180–$185 lows, SOL benefits from surging DeFi activity, with daily DEX volume at $5.23 billion—16.3% of all blockchain acti
SOL/USD — Solana Consolidates in Sideways Range Before Next MoveThe SOL/USD pair continues to trade within a long-term upward channel, but since the start of October, momentum has slowed, pushing price action into a sideways range between 234.38 and 218.75 (Murray – ). The market has failed to break out of this corridor so far.
A break above 234.38 would confi
SOL/USD — Solana Consolidates Before Potential BreakoutAfter forming a local top in September within the red resistance box and printing a clear M-pattern, Solana (SOL) experienced a strong pullback. The price briefly dropped below both the 50-day EMA and the psychological $200 level. However, buyers quickly stepped in, pushing SOL back above the 50 EMA
SOL/USD — Bulls Eye $250 as Uptrend Channel HoldsSOL/USD is holding within a long-term ascending channel. After dipping to 190.95 (5-week low), the price rebounded and is now testing the mid-Bollinger line at 224.70. A breakout here could open the path to 250.00 and 265.62 (channel top).
If price consolidates below 203.12 (Murray , Fib 61.8%), do

See all ideas
Summarizing what the indicators are suggesting.
Oscillators
Neutral
SellBuy
Strong sellStrong buy
Strong sellSellNeutralBuyStrong buy
Oscillators
Neutral
SellBuy
Strong sellStrong buy
Strong sellSellNeutralBuyStrong buy
Summary
Neutral
SellBuy
Strong sellStrong buy
Strong sellSellNeutralBuyStrong buy
Summary
Neutral
SellBuy
Strong sellStrong buy
Strong sellSellNeutralBuyStrong buy
Summary
Neutral
SellBuy
Strong sellStrong buy
Strong sellSellNeutralBuyStrong buy
Moving Averages
Neutral
SellBuy
Strong sellStrong buy
Strong sellSellNeutralBuyStrong buy
Moving Averages
Neutral
SellBuy
Strong sellStrong buy
Strong sellSellNeutralBuyStrong buy
Displays a symbol's price movements over previous years to identify recurring trends.