Sol To the Moonlet's go it"s time to fly for solana to break the key zone and create a new bullish movement be ready to collect enough momentum at the retracement level
Trade ideas

SOL's Situation, A Comprehensive Analysis !!!It appears that the price is forming a cup and handle pattern, and if this occurs, it could push the price above $215.
Best regards CobraVanguard.💚
SOL 4H Demand Zone Retest in Play, Will Bulls Drive Toward $230Solana continues to respect the ascending support trendline, with clean higher lows forming the base for each leg higher. The $200–205 demand zone is once again in focus after recent rejection wicks, serving as a key retest level for continuation.
If buyers defend this zone, momentum favors another bullish impulse toward the $225–230 area. Liquidity sits lower at $196.7 and $175.8, which may attract price before continuation if demand weakens.
Indicators show mixed signals: the Stoch RSI is stretched into overbought territory, hinting at possible short-term cooling, while the MACD Liquidity Tracker is still showing momentum building.
Key levels:
– Demand Zone: $200–205
– Liquidity: $196.7, $175.8
– Bullish target: $225–230

Solana goes Bearish: Rising WedgeSolana is forming a rising wedge. Probably the price goes to $120 because there's a big resistance.

A good buy opportunity - SOL weekly update Sep 2 - 8thSolana is currently forming a 1–2 setup at the Minute degree, which marks the beginning of Minor Wave 3, itself part of Intermediate Wave 3. Once this correction concludes, the probability is high that SOL will advance strongly toward the $250 level. From a technical perspective, the current structure leaves little room for credible alternatives. However, it is possible that the Nano Wave b could extend further upward, as illustrated by the dashed arrows.
Looking at liquidity, the order book below current levels appears relatively thin, with only small clusters around $190 and $180. While there are more orders at $180, giving that level stronger attraction potential, the liquidation heatmap shows virtually no liquidity there. For this reason, I do not expect a drop that deep.
Derivative data currently reflects bearish sentiment, with funding rates declining and open interest stagnating or falling.
Overall, I remain short positioned, targeting the 1.0 extension level of Wave c at $190, which is also where my take-profit is set. Until then, the plan is to stay patient and wait for the setup to play out.

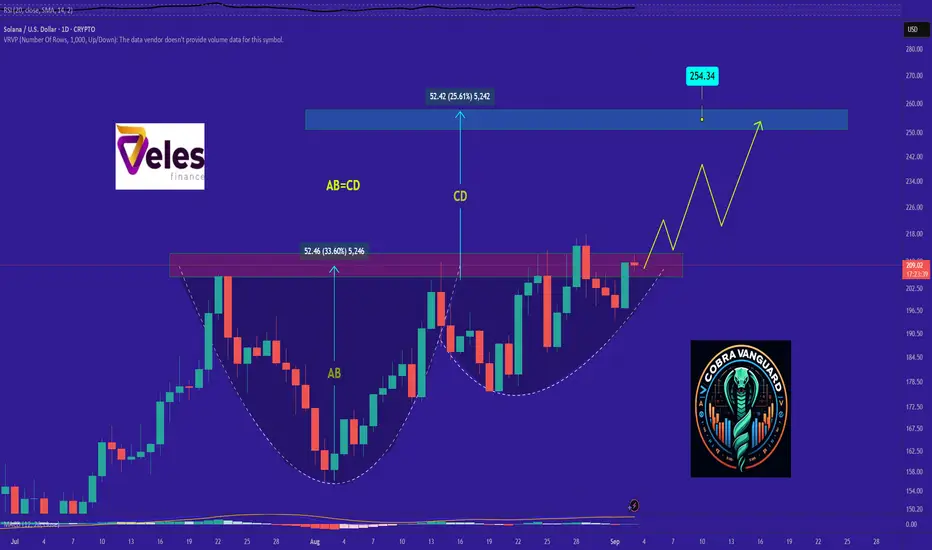
Can We See SOLUSD Push $5K+?Solana continues to show strength holding above key levels. If this breakout sustains, the measured move from price ranges A to B and B to C points toward a potential first target between $3,628 and $5,869. Long term structure remains intact and momentum is building. Patience could pay off big here.
On the fundamentals side, big players like Pantera Capital and Galaxy Digital are reportedly building SOL treasury reserves a strong signal that institutions see Solana as a core layer-1 for the next cycle. The technicals and fundamentals are starting to align here, and that’s when things get exciting.

Solana -> a descending broadening wedgeHello guys!
A descending broadening wedge is forming, indicating a potential bullish reversal if price follows the typical pattern.
Pattern Analysis: Descending Broadening Wedge
The wedge is marked with two diverging trendlines, where the upper line is descending and the lower line slopes down but at a slower rate.
This pattern generally signals a reversal scenario, especially after a downtrend.
Price typically oscillates between the upper and lower trendlines before a breakout occurs.
Support and Resistance Levels
Immediate resistance: Near $205–207 (upper trendline of the wedge).
Support zone: Around $192–193, marked by the lower wedge line and a grey horizontal area, which historically acted as strong demand.
Price objective: Upon breakout, the target is around $212+, as indicated by the schematic at the top-left corner of the chart.

01-09-2025 SOLUSDThe market is not always chaotic and disorderly, and there is a precise geometric beauty hidden in price fluctuations. The harmonic form long strategy is a powerful tool for accurately identifying potential market reversal points based on the Fibonacci ratio. When the form forms perfectly at the key support level, it often indicates the depletion of bearish momentum and the initiation of bullish trends.
As shown in the figure: 15M Bullish Bat

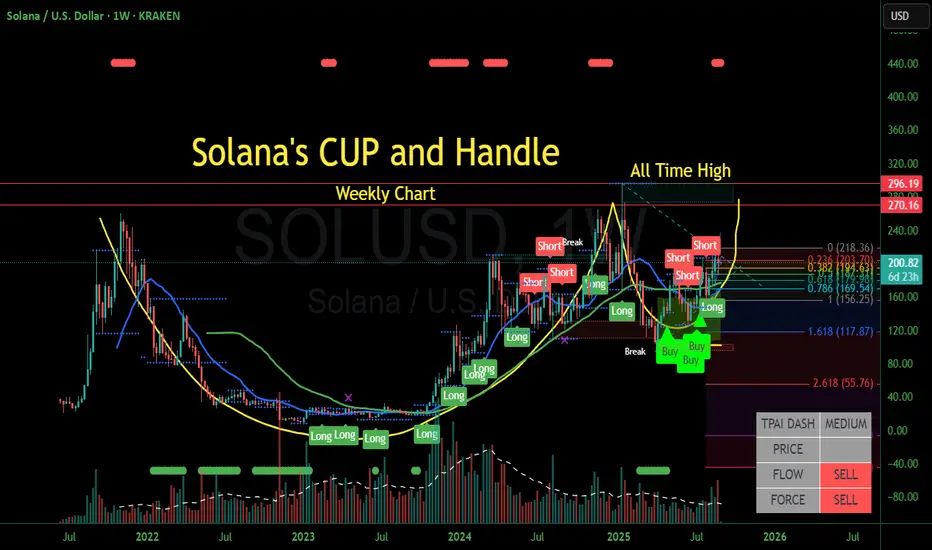
Solana Forming a Weekly Cup and Handle StructureSolana is now forming a cup and handle pattern with an impending breakout on the handle at $296. A measure move would suggest a target of around $526, based on the cup's average bottom of around $18.
From Rocket to Rock: Solana’s Gravity CheckCRYPTOCAP:SOL may reach $262 as network adoption accelerates and throughput metrics hit new highs, but market dynamics are rarely linear. Cyclical retracements below $100 remain a distinct possibility, reflecting the interplay between speculative sentiment, ecosystem development, and the inherent volatility of high-performance blockchain networks.

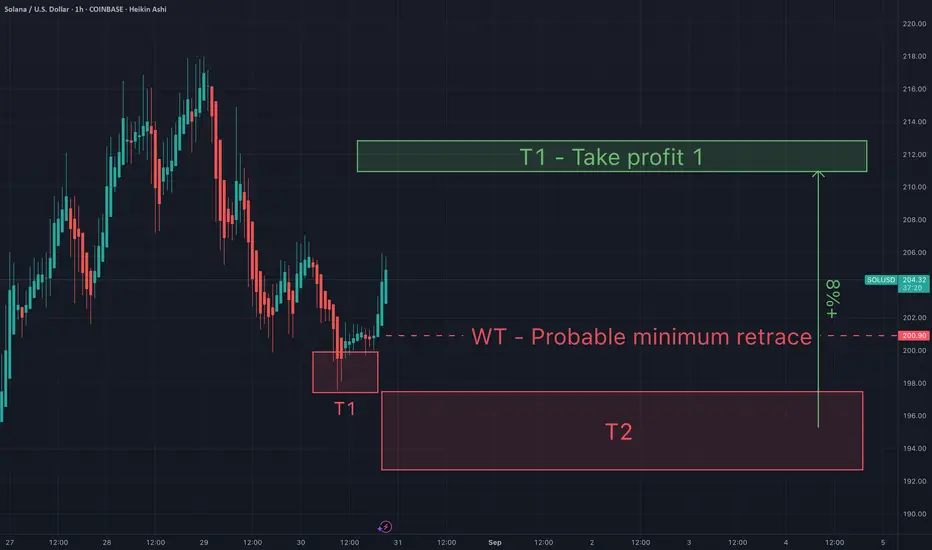
Sol - Support and resistance & take profit targetsSol - Support and resistance & take profit targets. Ideally Sol gets a retrace this weekend to my T2 so I can load up even more. Either way I'm taking profits at my green T1.
May the trends be with you.

Solana, just see what it is no bias no bias just see, may take the liquidity to level up offer and demand thats what the market is offer and demand
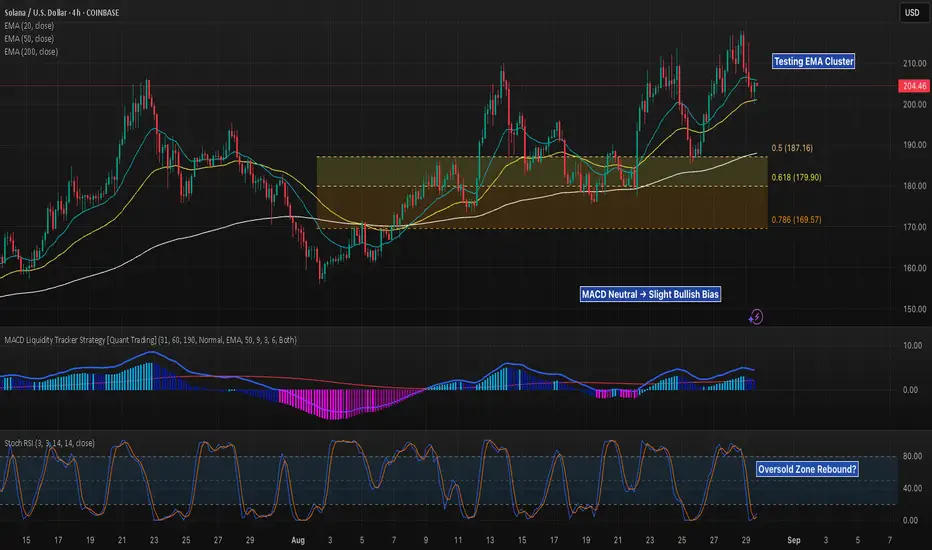
SOL 4H – Testing EMA Cluster at $204, Will Fib Support Hold?Solana on the 4H chart is retesting the EMA cluster (20/50/200) around $204 after its recent rally.
The key support to watch lies in the Fib retracement zone between $187 (0.5) and $169 (0.786), where previous consolidation provided strong demand.
EMA Confluence: Price is sitting directly on the 20/50 EMA with the 200 EMA nearby at $187. A clean break below could trigger deeper retracement into the Fib box.
MACD: Currently neutral but leaning slightly bullish, suggesting momentum is cooling rather than reversing.
Stoch RSI: Oversold bounce conditions are developing, which could fuel a short-term rebound if support holds.
Traders should watch the $200–$204 EMA cluster as the immediate decision point. A reclaim above $210 would re-confirm bullish continuation, while failure here risks a drop into the Fib support range.
Solana (SOLUSD): Is a move to $252 coming?Solana is showing signs of a bullish reversal on the daily chart.
The price has retested and held a key support level at $196. This is a strong signal that buyers are defending this area.
Looking at the RSI, it has bounced from oversold territory, which supports the potential for a bullish reversal.
My target is $252, which represents a significant resistance level. A successful break above this could confirm a major uptrend.

Solana / U.S. Dollar – 15m | Testing Breaker Block Support
SOL price is consolidating after rejecting from recent highs. Price is now sitting inside a breaker block, with strong demand zones just below — market at decision point.
**Bullish Scenario:**
* Hold above breaker block (205–206)
* Push through 208–210 swing high
* Extend into 213–214 OB zone, targeting 217–218 equal highs
**Bearish Scenario:**
* Lose breaker block support
* Drop into 203–202 rejection block
* If broken, further downside towards 200–199 strong low
**Key Levels:**
* 206.0: Breaker Block Support
* 213–214: Order Block / Resistance
* 217–218: Equal Highs / P1D High
* 202.7–203.0: Rejection Block
* 199–200: Strong Low
💬 SOL is sitting right on support — will bulls defend for a rally or give way to deeper lows?

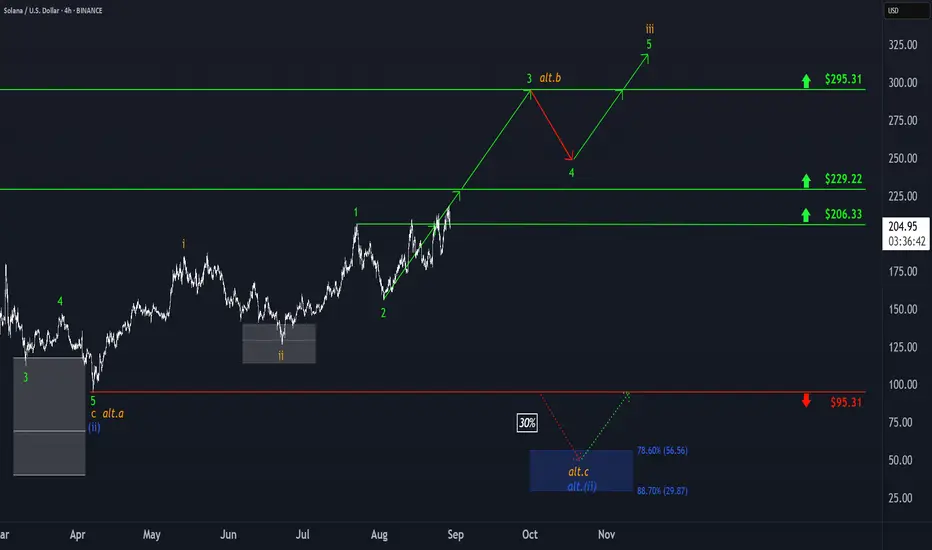
Solana: Stay the Course!Solana started the week with a sharp pullback but quickly bounced back, breaking through resistance at $206.33 for the third time in just two weeks. Our primary outlook points to another push higher, with price expected to clear resistance at $229.22 and complete the ongoing green wave 3 near $295.31. From there, the broader green five-wave sequence should ultimately break above this level and finish the larger orange wave iii. We still assign a 30% probability to the alternative scenario, which calls for a fresh wave (ii) correction low within the blue downside Target Zone between $56.56 and $29.87.
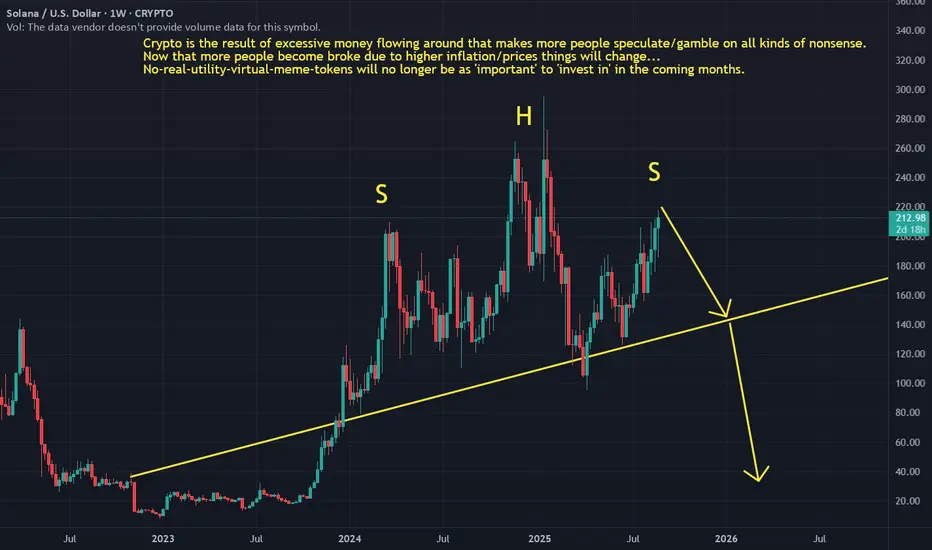
No-real-utility-virtual-meme-tokens in a recession...Crypto is the result of excessive money flowing around that makes more people speculate/gamble on all kinds of nonsense. Now that more people become broke due to higher inflation/prices things will change... No-real-utility-virtual-meme-tokens will no longer be as 'important' to 'invest in' in the coming months.
Solana (SOL/USDT) — Breakout WatchSolana has pushed into the $211–214 zone, retesting key resistance after a strong rally. Institutional flows, network upgrade optimism, and on-chain strength are fueling sentiment.
Solana (SOL/USDT) — Breakout Watch
Solana has pushed into the $211–214 zone, retesting key resistance after a strong rally. Institutional flows, network upgrade optimism, and on-chain strength are fueling sentiment.
🔹 Technical Structure
Price is forming an ascending triangle, pressing against multi-test resistance at $213.
RSI ~60 (bullish but not overbought) and ADX >25 confirm healthy trend momentum.
EMAs are aligned upward, showing strong structural support.
🔹 Key Levels
Support zones: $204–206 (immediate base), $200 (major swing floor).
Resistance cluster: $211–214 (breakout zone).
Targets:
First leg: $220–230
Extension: $250+
Macro breakout: $270–330 (if triangle breakout fully resolves).
🔹 Sentiment & Context
Institutional holdings in SOL have increased significantly, with billions staked.
Optimism surrounding the Alpenglow upgrade is boosting network confidence.
Social sentiment is at its most positive in two months, aligning with price structure.

Finally PumpingOver 187 I see a break to 250 more ,
Under 187 I’m not bullish under resistance. Only over it.

SOLANA to make a new ATH?!My hypothesis is that Solana is on course to be one of the first alt coins to top out first as it makes its final wave 5 move in SOL|USD pair. Trump also announced that SOL is part of the US strategic reserve (2/3/25) and has a special place as an OG crypto, despite only being launched from 2020.
SOL is presenting a ' rising wedge ' pattern which is typically a bearish structure under TA principles. Given SOL has already gained +2500% from the 2022 ABC bottom, I think its cycle top is approaching.
From its bottom in NOV-22 (with the FTX crash having ~10% of the SOL supply), SOL bottomed out when it was 0.39% of the crypto market last cycle and topping out at ~3%. However, this cycle, SOL.D has gained higher crypto dominance sitting today at about ~2.98%, thanks to higher utility over the bear market (e.g. NFT usage increasing from ETH to SOL as seen with the likes of Trump coin). This cycle I expect SOL.D to top at around 6.5-7.3%.
SOL|ETH pair should top soon as its currently bottoming out (wave 4) against SOL|ETH pair and ready to make its final wave 5 move. SOL|BTC is also making its wave 5 as it gains higher dominance over BTC which is getting closer to its wave 5 top.
SOLANA USD Targets:
1. $365 Key price point to break
2. $600 Likely
3. $960 Moonshot (Raoul Paul delusional target of $1k)
4. $1500 Unlikely

SOL Roadmap Q4 2025/Q1 2026Looking at Solana on the weekly chart, the structure continues to echo its past cycles of rapid expansion, steep drawdowns, and extended consolidation ranges. The previous base in 2022–2023 ultimately set the stage for a major breakout, and the current boxed consolidation looks similar in both length and form.
As long as Solana holds above the $150–160 support zone, my bias remains bullish. A sustained weekly close below that would invalidate the setup.
Profit target: $400+
Stretch targets: $550+
Stop-loss zone (invalidated idea): weekly close under $150
Definitely not written by chatgpt.

SOL/USD to reject resistance?An interesting technical scenario is brewing on SOL/USD (Solana versus the US dollar) at the moment.
First and foremost, you will note that upside momentum has slowed; this is demonstrated by price action compressing between converging lines, offering two rising wedge patterns to work with (the larger formation is formed between US$127.48 and US$187.30; the smaller pattern is drawn between US$160.78 and US$206.10). With price now testing the upper boundaries of the noted rising wedge patterns and the Relative Strength Index showing negative divergence, this could prompt a bout of profit-taking and force a modest correction.
Why I say a modest correction is simply because the larger harmonic bat pattern is in the process of forming its D leg. This could see the pair rally higher before connecting with the bat pattern’s Potential Reversal Zone (PRZ) between US$251.93 and US$247.07.
Written by FP Markets Chief Market Analyst Aaron Hill
