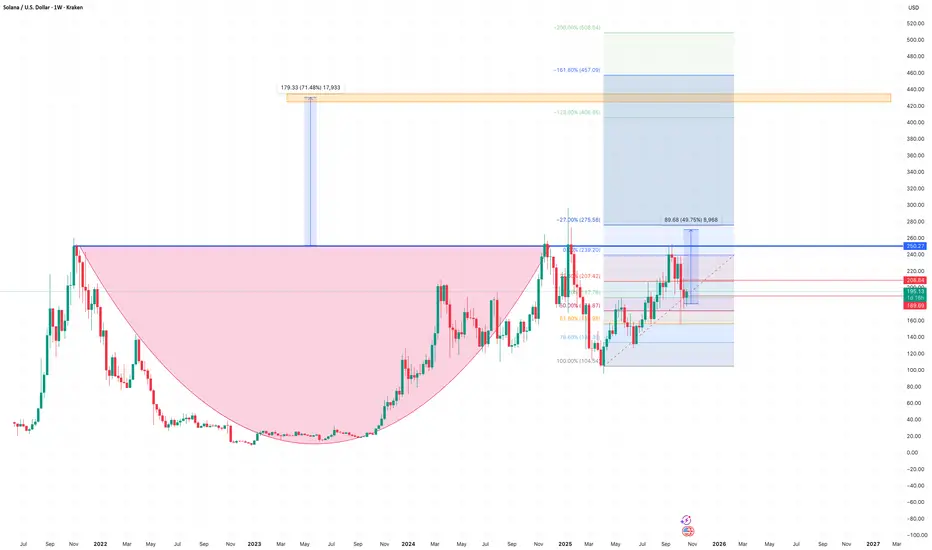
Sol Ready For One More Rip or Bear Market?After a little over 1000days of upward trend and LONG consolidation SOl seems to be reaching a decsion point.
Looking at the weekly if the market continues to rise the cup and handle tends to produce a 1.5-2x the handle. With continued upward action a 1.5 expansion of the range should be expected to end the $500 area.
Considering the average range size forming repeatedly on the macro and if the trend holds with continued market rise one more rip may be in order
Trade Well....
Your Friend,
Degen
Trade ideas

SOLUSDT ForecastSOL is maintaining a strong bullish structure, trading above the ascending trendline after breaking out from the previous descending channel. Price is currently retesting the 198–200 resistance zone, showing signs of consolidation before a potential continuation move. A successful retest of the trendline and demand zone could trigger an upside push toward the next target around 205.43, confirming bullish momentum continuation.
"Thank you for your support! If you found this idea valuable or learned something new, please consider liking and leaving a comment. I’d really appreciate hearing your feedback and thoughts."

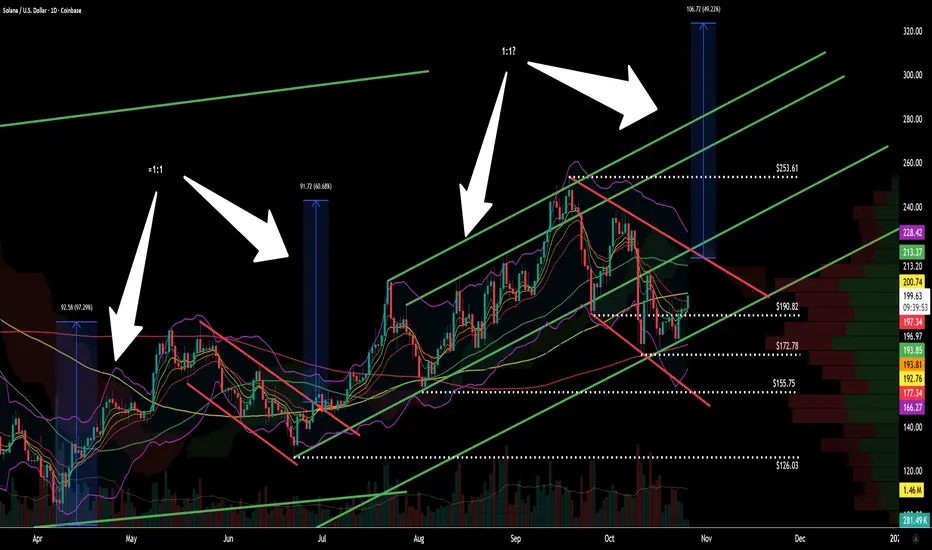
$SOL – Dual Bull Flags & Parallel Channel StructureSince the April lows across both equities and crypto markets, CRYPTOCAP:SOL has been one of the standout performers, printing a powerful bullish trend structure defined by two major bull flags — each followed by significant measured-move extensions.
Phase 1 – The First Bull Flag
The first rally delivered a 97% gain, followed by a 30% retracement, forming a textbook flag structure.
After a clean breakout and retest of the upper trendline in late June, Solana launched into a 60% measured move, aligning closely with a ≈1:1 projection of the initial flagpole.
This breakout confirmed strong underlying momentum, accompanied by increasing volume and trend confirmation across the broader crypto space.
Phase 2 – The Second Flag Formation
The breakout from the first flag initiated a second 100% run, moving from $126-$253, before undergoing another 30% retracement down to $172.
This pullback mirrors the previous structure almost perfectly, consolidating within another bull flag as the market digests gains.
Currently, price is holding above $190, sitting just beneath the upper flag boundary. The consolidation remains healthy, and if momentum continues to build within this pattern, a volume-backed breakout could lead to a retest of the upper trendline and continuation toward higher levels.
Trend Channel & Structure
The broader move from early June forms a dual-trendline bull channel, where both sets of parallel trendlines are aligned near a 45° slope. This structure reinforces the bullish bias, showing consistent rhythm between impulses and corrections — a strong sign of a well-organized uptrend rather than random volatility.
The pattern also shows proportional price swings, with both measured moves (~1:1) maintaining the same amplitude, suggesting institutional order flow and algorithmic consistency.
Key Levels to Watch
Level Significance
$253.61 Flag target & prior swing high
$213–$214 Local resistance cluster
$190.82 Current support zone (holding above)
$172.78 30% retrace support
$155.75 / $126.03 Structural supports / prior flag bases
A confirmed close above $213–$214 on rising volume would be the first signal that the breakout is underway. Failure to hold $190 would risk extending the flag lower toward the $172 zone.
Measured Move & Projection
If the breakout mirrors the first flag’s performance, a measured move equal to the previous flagpole projects a potential target near $323 — aligning with the upper bound of the extended bull channel.
That projection maintains symmetry with previous rally amplitudes (97%, 60%, ~100%), further validating the trend continuation scenario.
Technical Summary
✅ Trend: Bullish (higher highs & higher lows)
✅ Pattern: Dual bull flags within rising parallel channel
📊 Momentum: Strong; price holding above 8/13 EMA cluster
⚙️ Support: $190 → $172 → $155
🎯 Target: $323 (1:1 projection from current flagpole)
🔍 Trigger: Breakout above top trendline on increased volume
Final Notes
CRYPTOCAP:SOL remains technically one of the strongest large-cap crypto charts — clean structure, repeatable patterns, and consistent retracement depth between impulsive legs.
While short-term volatility is expected inside the flag, the 45° upward channel and consistent measured-move behavior keep the medium-term bias bullish through Q4.
As always, volume confirmation will be key, a breakout supported by expanding participation could mark the start of the next leg toward $323.
For educational and technical analysis purposes only.
Solana (SOL): Wave 5 Starting or Set to Crash?Solana (SOL): Wave 5 Starting or Set to Crash?
Weekly Scenarios
Bullish scenario: SOL holds support at ~$197, then breaks through ~$260.83 → possible rise to ~$300+.
Consolidation: The price trades in the ~$197–$260 range without a clear direction, preparing for momentum.
Bearish scenario: A breakout below ~$183 with volume → possible correction to ~$174 and below.
✅ Conclusion
Weekly analysis shows: SOL is at a crossroads.
A hold of support near ~$197 and a break of resistance at ~$260.83 could trigger a new uptrend.
However, a breakout below ~$183 significantly increases the risk of a correction.
Monitor the wave structure, volatility levels, and volume confirmation before choosing a strategy.
SOLANA stable, but only for now.SOL - major move is loading. I know, ppl hate it, as well as I, but imo the break will be down of 170 below, not to the upside. It's pretty calm for the time being - enough to prepare.
SOL/USD – Possible Bullish Reversal Loading!Solana looks ready for a potential breakout after consolidating within a key demand zone! 👀
🟩 Key Support Zone: $176 – $185
This green area has acted as a strong accumulation zone multiple times — buyers continue to defend it aggressively.
🔵 Mid-Level Support: $181.25
Price recently retested this level and is showing signs of bullish strength above it.
🟥 Major Resistance Zone: $215 – $225
This red supply zone is the next key target. If bulls maintain momentum, a breakout here could confirm a full bullish reversal.
📊 Current View (1H timeframe – Coinbase)
After several rejections and liquidity sweeps below the $180 level, SOL seems to be forming a higher low — a classic bullish structure.
If the price holds above $190, I expect a push toward the $220 area in the coming days.
🧠 Trade Idea (Not Financial Advice):
✅ Long entry: above $190–$192 confirmation
🎯 Targets: $205 → $220
❌ Stop Loss: below $181
🔥 Sentiment: Bullish bias — as long as SOL holds above $181
⚡ Watch out: High-impact news events could trigger short-term volatility.

Solana - We have to see new all time highs!🚀Solana ( CRYPTO:SOLUSD ) has to break out:
🔎Analysis summary:
Over the course of the past couple of months, Solana has been rallying another +100%. This rally ultimately resulted in another, third retested of the previous all time high. And if Solana now creates bullish confirmation, we can all expect new all time highs very soon.
📝Levels to watch:
$250
SwingTraderPhil
SwingTrading.Simplified. | Investing.Simplified. | #LONGTERMVISION

SOLUSD: Key 175 Support in Focus After 198.5 Rejection
SOLUSD is currently consolidating in a range, facing a pullback after being rejected by the 198.5 current resistance level.
For the bulls to regain control, the price needs to break and hold above the 198.5 resistance, which would set the stage for a move towards the 200 to 205 key resistance zone.
The current bearish pressure suggests that a retest of the 175 current support level is likely in the short term.
A breakdown and close below the 175 support would be a significant bearish development, potentially sending the price down to the 160 to 165 key support zone.
Disclaimer:
The information provided in this chart is for educational and informational purposes only and should not be considered as investment advice. Trading and investing involve substantial risk and are not suitable for every investor. You should carefully consider your financial situation and consult with a financial advisor before making any investment decisions. The creator of this chart does not guarantee any specific outcome or profit and is not responsible for any losses incurred as a result of using this information. Past performance is not indicative of future results. Use this information at your own risk. This chart has been created for my own improvement in Trading and Investment Analysis. Please do your own analysis before any investments.

SOLANA LONG TERM WOLFE WAVEThe Wolfe Wave is a trading pattern used to predict price reversals and emerging trends. It consists of five waves that form a specific structure, indicating potential breakout or breakdown points.
Waves 1-3-5 these points highlight the main trend, with wave 5 being the potential reversal point.
Waves 2-4 these act as counter-trend corrective waves, setting the boundaries for the pattern.
Projected Line a line drawn from point 1 through point 4 predicts the breakout level after wave 5, known as the "sweet zone"
Trading Strategy traders look for entry around wave 5 with an exit strategy aligned with the projected line, expecting price movement in the direction indicated by the pattern.

SOLANA (SOL): Wave 5 awaits – upward momentum or bear trap?SOLANA (SOL): Wave 5 awaits – upward momentum or bear trap?
Weekly Scenarios
Bullish scenario: Price holds the ~$185-190 zone, breaks resistance at ~$260 → wave 5 starts up, target is approximately ~$300+.
Consolidation: Price moves in the ~$185-260 range without a significant breakout; energy is accumulating, waiting for a signal.
Bearish scenario: Break of support at ~$185 with volume → confirmation of the start of wave C correction → possible decline to ~$150-160.
✅ Conclusion
On the weekly timeframe, SOL is at a crossroads:
If it holds above ~$185 and manages to break ~$260, the chance of a strong rally increases.
If support fails to hold, the risk of a correction remains. Traders should watch for price reaction on levels, volume, and confirmation of wave structure before taking a position.

$SOL / Solana to $300+?All things suggest a strong launch opportunity for Solana.
If $200 holds, it's a good accumulation level. RSI is at 50, in the Fibonacci Golden Zone, with a weekly demand level, and the $250 weekly resistance/supply level has been tested 3+ times.
Solana bulls have a solid chance to reach $300+ short-term, especially with potential ETF filings.

SOLUSD H1 | Bearish Reversal from Pullback ResistanceSOL/USD is rising towards the sell entry which is a pullback resistance that aligns with the 61.8% Fibonacci retracement and could reverse from this level to the downside.
Sell entry is at 190.50, which is a pullback resistance that aligns with the 61.8% Fibonacci retracement.
Stop loss is at 198.02, which is an overlap resistance.
Take profit is at 175.45, which is a swing low support.
Stratos Markets Limited (tradu.com ):
CFDs are complex instruments and come with a high risk of losing money rapidly due to leverage. 68% of retail investor accounts lose money when trading CFDs with this provider. You should consider whether you understand how CFDs work and whether you can afford to take the high risk of losing your money.
Stratos Europe Ltd (tradu.com ):
CFDs are complex instruments and come with a high risk of losing money rapidly due to leverage. 70% of retail investor accounts lose money when trading CFDs with this provider. You should consider whether you understand how CFDs work and whether you can afford to take the high risk of losing your money.

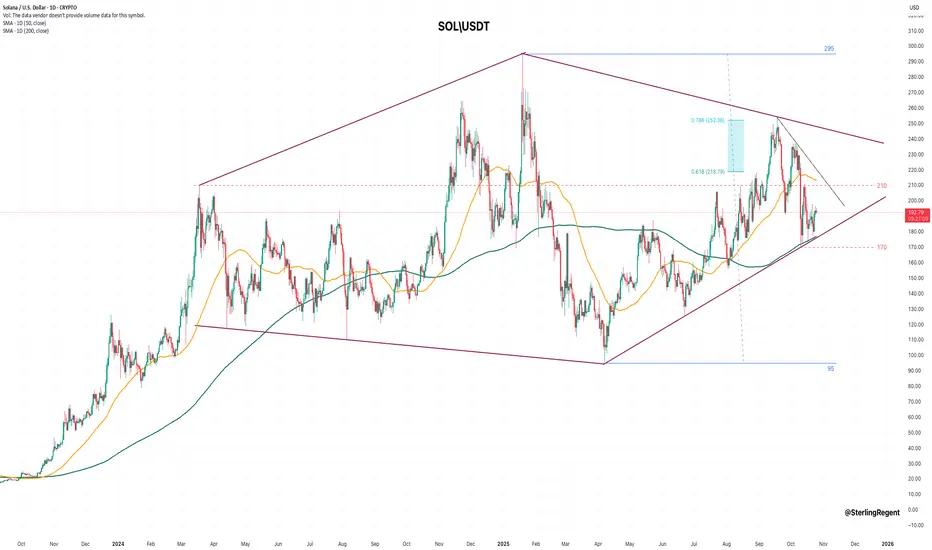
solusdSolana - where the price could go?
IF the triangle descending forms then the price will go to 140usd.
The eyes are in 176usd. Below 176usd we will see the price of 140usd.
Good luck!

Golden Zones and Moving AveragesSOL is at the O.5 Fibonacci golden zone area and resting at the 50 EMA. If it breaks below 173.88 area, price may possibly head to 155$ price range. We have some red candles, however bulls still have the upper hand; bulls need bullish candles at the 190$ area, for the pullback to be hopefully over.

SOLANA TESTING SUPPORT BEFORE WE PUMPI think solana will drop down towards $176-177 and we bounce back from there to get towards ath again but first we need to bounce from support
and break $186 level and $195 area so we can get a better idea if solana will continue its uptrend cycle.

Solana Price Eyes 20% Jump as Bulls Regain ControlCOINBASE:SOLUSD price trades near $184, down 10% this week but still up 2% over three months. Despite recent weakness, both on-chain and chart data point to a possible rebound — provided $213–$222 is cleared.
Short-term holders are buying again. Wallets holding SOL for 1–3 months increased their share by 26% in two weeks, while long-term outflows dropped 59%, easing sell pressure. This shift means dip buyers are absorbing most of the remaining selling.
On the daily chart, COINBASE:SOLUSD trades inside a falling wedge, a setup that often breaks upward. The RSI shows a bullish divergence, where price makes lower lows but RSI makes higher lows — usually a sign that momentum is improving.
If COINBASE:SOLUSD breaks above $213, a 15% move from current levels, a larger breakout could target $222–$253. A drop below $172, however, would invalidate the bullish structure and expose the price to deeper losses.

SOLA short trade (learning to read the charts). Advices welcomeMy graphs are for learning only, I have a long way to go but I will follow my gut with what I learned.
If there is a big mistake or something i missed please let me know :).


SOLUSD H4 | Price Faces Bearish Drop-OffSOL/USD has rejected off the sell entry which is a pullback resistance that lines up with the 23.6% Fibonacci retracement and could drop from this level to the take profit.
Sell entry is at 191.97, which is a pullback resistance that lines up with he 23.6% Fibonacci retracement.
Stop loss is at 206.14, which is a pullback resistance that aligns with he 50% Fibonacci retracement.
Take profit is at 175.03, which is a multi swing low support.
High Risk Investment Warning
Trading Forex/CFDs on margin carries a high level of risk and may not be suitable for all investors. Leverage can work against you.
Stratos Markets Limited (tradu.com ):
CFDs are complex instruments and come with a high risk of losing money rapidly due to leverage. 65% of retail investor accounts lose money when trading CFDs with this provider. You should consider whether you understand how CFDs work and whether you can afford to take the high risk of losing your money.
Stratos Europe Ltd (tradu.com ):
CFDs are complex instruments and come with a high risk of losing money rapidly due to leverage. 66% of retail investor accounts lose money when trading CFDs with this provider. You should consider whether you understand how CFDs work and whether you can afford to take the high risk of losing your money.
Stratos Global LLC (tradu.com ):
Losses can exceed deposits.
Please be advised that the information presented on TradingView is provided to Tradu (‘Company’, ‘we’) by a third-party provider (‘TFA Global Pte Ltd’). Please be reminded that you are solely responsible for the trading decisions on your account. There is a very high degree of risk involved in trading. Any information and/or content is intended entirely for research, educational and informational purposes only and does not constitute investment or consultation advice or investment strategy. The information is not tailored to the investment needs of any specific person and therefore does not involve a consideration of any of the investment objectives, financial situation or needs of any viewer that may receive it. Kindly also note that past performance is not a reliable indicator of future results. Actual results may differ materially from those anticipated in forward-looking or past performance statements. We assume no liability as to the accuracy or completeness of any of the information and/or content provided herein and the Company cannot be held responsible for any omission, mistake nor for any loss or damage including without limitation to any loss of profit which may arise from reliance on any information supplied by TFA Global Pte Ltd.
The speaker(s) is neither an employee, agent nor representative of Tradu and is therefore acting independently. The opinions given are their own, constitute general market commentary, and do not constitute the opinion or advice of Tradu or any form of personal or investment advice. Tradu neither endorses nor guarantees offerings of third-party speakers, nor is Tradu responsible for the content, veracity or opinions of third-party speakers, presenters or participants.

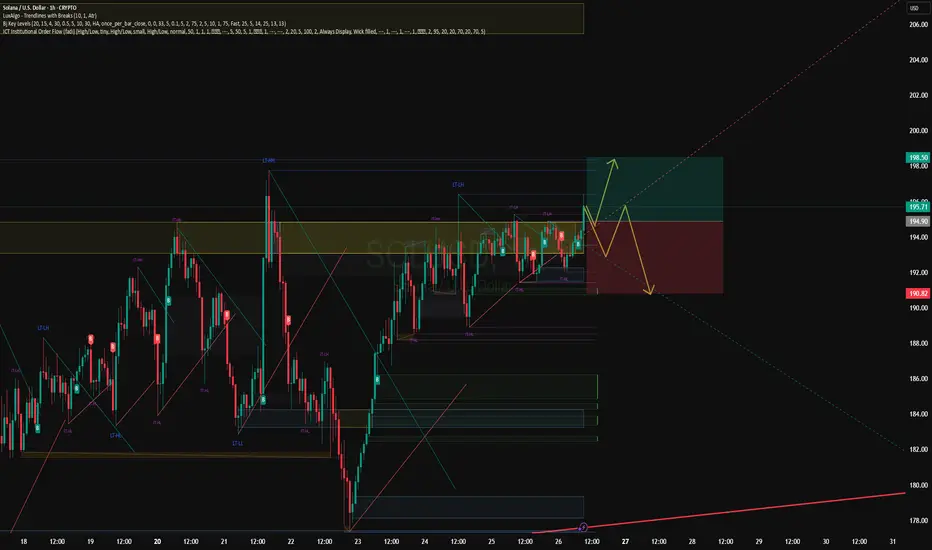
Solana's 190 Battle: Can Bulls Break the Downtrend?Solana's 190 Battle: Can Bulls Break the Downtrend?
Overview:
SOLUSD is currently trading around 188.26 on the 4-hour timeframe, positioned just below the critical 190 Deciding Area. After a notable decline from previous highs, Solana has found intermediate support and has begun to form an ascending green channel. However, this nascent bullish structure is immediately challenged by a significant descending red trendline, which has consistently acted as overhead resistance during the recent downtrend. This convergence of dynamic resistance and horizontal support/resistance creates a pivotal zone for Solana's next move.
Bullish Scenario:
For Solana to confirm a shift in momentum and initiate a sustainable recovery, it must first reclaim and firmly hold above the 190 Deciding Area. Subsequently, a decisive breakout above the prominent descending red trendline, ideally coupled with continued momentum within the ascending green channel, would be crucial. If these conditions are met, the next target for bulls would be the formidable 200 to 205 Key Resistance zone. Successfully overcoming this key resistance would pave the way for a potential retest of higher levels, eventually aiming for the prior peak levels above 236.
Bearish Scenario:
Conversely, if SOLUSD fails to reclaim the 190 Deciding Area or is decisively rejected by the descending red trendline, bearish pressure is likely to intensify. Such a rejection would prompt a retest of the lower boundary of the ascending green channel and, more critically, the 175 Current Support level. A confirmed breakdown below the 175 Current Support, especially if accompanied by a breach of the ascending channel, would signal a strong continuation of the bearish trend. In such a scenario, the market would likely target the deeper 160 to 165 Key Zone, which would become a crucial area for any potential buying interest to emerge and prevent further declines.
Key Takeaways:
The 190 Deciding Area and the confluence of the descending trendline and ascending channel are the focal points for SOLUSD. A clear break above these resistances is required for bulls to take control, while a failure to hold current levels could quickly lead to further downside. Traders should closely monitor these key zones for definitive directional signals.
Disclaimer:
The information provided in this chart is for educational and informational purposes only and should not be considered as investment advice. Trading and investing involve substantial risk and are not suitable for every investor. You should carefully consider your financial situation and consult with a financial advisor before making any investment decisions. The creator of this chart does not guarantee any specific outcome or profit and is not responsible for any losses incurred as a result of using this information. Past performance is not indicative of future results. Use this information at your own risk. This chart has been created for my own improvement in Trading and Investment Analysis. Please do your own analysis before any investments.

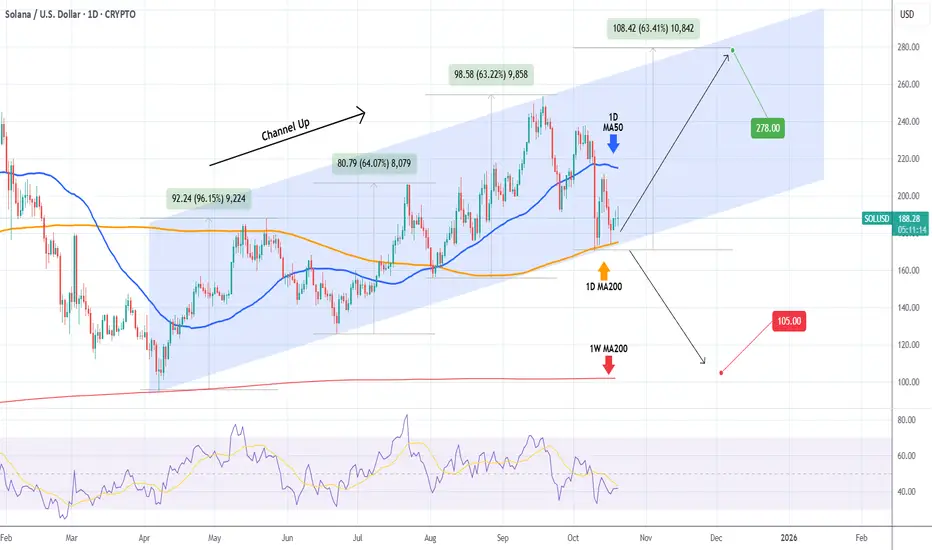
SOLANA 1D MA200 is the only level holding it from falling apart.Solana (SOLUSD) has been trading within a very structured Channel Up pattern since the April 07 bottom, which was priced exactly on its 1W MA200 (red trend-line). The recent pull-back though (Bearish Leg) has got the market testing another key Support level, the 1D MA200 (orange trend-line).
So far this has held on 4 successive tests, technically pricing a new Higher Low on the bottom of the Channel Up. This is what separates the start of the new Bullish Leg towards at least $278.00 (representing a +63.00% rise, the minimum rally so far inside this pattern) from a complete collapse to $105.00 and the 1W MA200. SOL needs to keep closing its 1D candles above the 1D MA200 to maintain the bullish trend.
-------------------------------------------------------------------------------
** Please LIKE 👍, FOLLOW ✅, SHARE 🙌 and COMMENT ✍ if you enjoy this idea! Also share your ideas and charts in the comments section below! This is best way to keep it relevant, support us, keep the content here free and allow the idea to reach as many people as possible. **
-------------------------------------------------------------------------------
💸💸💸💸💸💸
👇 👇 👇 👇 👇 👇
Solana’s Next Move Depends on $160 Support ZoneHello guys!
Solana is currently stuck between the Decision Point (DP) zone and the Weekly Support area, showing hesitation in market direction.
However, the recent breakdown of the ascending trendline signals a potential shift in momentum from bullish to bearish. The price now appears to be heading toward the purple demand zone around $172–$160, which acts as an important short-term support area.
If the $160 level fails to hold and we see a confirmed breakdown below it, Solana could continue its decline toward the weekly support zone near $120–$130. On the other hand, if buyers defend the purple area strongly, we might see a temporary rebound before any further downside move.
