SOL Bearishthis is the last set up for bearish movement ; after retarcing those key level and after the current regulation solana is moving downward
Trade ideas

SOL/USDT: Recovering from Flash Crash with Bullish Setup FormingSOL/USDT rebounded sharply from the $170 support following a flash crash and is now consolidating near the $200 level within a mid-range structure. Price action displays a sequence of impulse and correction legs, indicating buyers are attempting to regain control.
A stable close above $210 could confirm renewed bullish momentum toward the $230 resistance zone. The broader setup points to range accumulation, with potential for an upward breakout if momentum continues to build.

Long I opened a long position for a swing trade this morning.
A daily candle is still below EMA 12/21/55 and has not broken above the descending resistance line, however, I see a lot of bullish signs in the chart. I am cautiously optimistic, however, the bull is not in full control yet.
Daily:
Stochastic formed a clear positive divergence and is no in the bull zone.
RSI lines are trapped inside the descending triangle. The momentum is clearly building up and I am anticipating it to break to the upside given RSI line is starting to move to the upside and slow
MA (orange) line is also starting to tilt to the upside.
MACD lines are still in the bear zone, however, histogram shows the bearish momentum is weakening.
A daily candle is still below EMA 12/21/55, however, the price strongly held above the previous higher low at $190 (blue horizontal line) .
A daily candle is also above EMA200, two major support lines (purple and orange lines).
4H:
All three momentum indicators are in the bull zone now.
The price moved to the purple support line, moved up, retraced to retest Fib 0.382 level.
The price is above both EMA 12 and 21.
Trade plan:
Entry price: $202
S/L: $189
Target : $223

H&S pattern's right shoulder turned into an ascending triangle!SOLUSD is showing real strength here, the bulls are not giving up. Staying above the $200 was really needed to not form a "perfect" H&S pattern.
I think that we will see a breakout from this point. Please do not see my ideas as your personal investment advise. I am only sharing ideas here.
15 min zig zaglooking for one more impulsive move down out of this flag like part in this correction.
simple short term
Descending channel: what is next for SOLUSD?There is a head and shoulder pattern drawn starting from 12 october until now. It will most likely go down at first. I hope to see a bounce again from the lower uptrend line (in white). Which would make a big chance to breakout from the descending channel pattern.
Another dip coming? Buy the strength, insteadThe current price action is very similar to that in May/June 2025 (see yellow rectangular box in the charts).
In May, the price started to finally recover from April's bottom. It started to move above the major support/resistance line (purple line in the chart) that was forming a massive cup and handle pattern, but it ende up to be a fake out and the price started to move to the downside again. The real recovery started after the price dropped to the unmitigated fair value gap (blue rectangular box). I am seeing a very similar set up in the current price action.
On last Friday, the price aggressively dropped to the same major support/resistance line (purple line) . The price held that level and spectacularly bounced up on weekend. It was the great buy the dip opportunity, but I had a feeling that there would be another deeper dip to follow.
The reason for that is that higher time momentum indicators were incredibly bearish and it didn't give me any sense of a V-shape recovery. Also a skeptical side of me makes me think that when there is such a clear bounce at the key area, it becomes so obvious where people place S/L (just under Friday's wick). If I were a market maker, I would definitely try to push the price down to take all the liquidity out.
What I am seeing in the charts:
Daily:
Both RSI and MACD are in the bear zone and pointing to the downside.
Stochastic indicator formed positive divergence, but Stochastic is more reactive and when the direction of the stochastic is contradicting RSI and MACD, it is almost always a corrective move.
EMA200 is cutting across three candles. When EMA200 is dead horizontal and sitting on the candles, EMA200 works like a magnet. The price tends to oscillate until strong momentum builds up to push the price to one direction.
4H:
When you see the price in the 4H chart, it bounced up to Fib 0.618 level and EMA 200 (proper pull back) and now it is starting to move to the downside.
But the most important thing is that there is a cluster of unmitigated fair value gap in the $135-$155 zone (orange rectangular block). It takes a lot for the price to move to that level, however, yesterday's daily candle in both SP500 and Nasdaq is trapped inside Friday's massive bear candle. If traditional market starts to break down, Solana will definitely fall further.
Stochastics formed negative divergence and started to roll to the downside.
MACD is still in the best zone and starting to lose bullish momentum.
RSI slow MA line is still in the bear zone and RSI line is already rolling to the downside.
Conclusions:
It is not a bad zone to nibble, but definitely not the time to open a leveraged position!!
It is better to miss the absolutely bottom and buy the strength.
Good luck !

DUMP IT!Potential dump targets if this crash comes - chart is in log scale because linear targets go below zero lmfao - this probably going to be ugly if it plays out.

Long —Low Leverage (if any)
In a bullish case for Solana trading around $220, is poised for significant growth due to strong network adoption, with a record $13.9 billion stablecoin supply and robust DeFi activity, coupled with whale accumulation and partnerships like Sharps Technology’s integration with Jupiter Exchange. Technical indicators, including bull flag patterns and EMA crossovers, suggest minimal resistance up to $250, with short-term targets of $230-$260 by October’s end, medium-term goals of $290-$350 by early 2026, and long-term projections potentially exceeding $500 by 2030. The potential approval of spot Solana ETFs could drive billions in institutional inflows, further fueling a rally, though risks like market volatility remain.

SOLUSD H4 | Bullish ReversalSOL/USD is reacting off the buy entry which is a pullback support and oculd rise from this level to the upside.
Buy entry is at 204.32, which is a pullback support.
Stop loss is at 187.97, which is an overlap support.
Take profit is at 228.36, which is an overlap resistance that aligns with the 78.6% Fibonacci retracement.
High Risk Investment Warning
Trading Forex/CFDs on margin carries a high level of risk and may not be suitable for all investors. Leverage can work against you.
Stratos Markets Limited (tradu.com ):
CFDs are complex instruments and come with a high risk of losing money rapidly due to leverage. 65% of retail investor accounts lose money when trading CFDs with this provider. You should consider whether you understand how CFDs work and whether you can afford to take the high risk of losing your money.
Stratos Europe Ltd (tradu.com ):
CFDs are complex instruments and come with a high risk of losing money rapidly due to leverage. 66% of retail investor accounts lose money when trading CFDs with this provider. You should consider whether you understand how CFDs work and whether you can afford to take the high risk of losing your money.
Stratos Global LLC (tradu.com ):
Losses can exceed deposits.
Please be advised that the information presented on TradingView is provided to Tradu (‘Company’, ‘we’) by a third-party provider (‘TFA Global Pte Ltd’). Please be reminded that you are solely responsible for the trading decisions on your account. There is a very high degree of risk involved in trading. Any information and/or content is intended entirely for research, educational and informational purposes only and does not constitute investment or consultation advice or investment strategy. The information is not tailored to the investment needs of any specific person and therefore does not involve a consideration of any of the investment objectives, financial situation or needs of any viewer that may receive it. Kindly also note that past performance is not a reliable indicator of future results. Actual results may differ materially from those anticipated in forward-looking or past performance statements. We assume no liability as to the accuracy or completeness of any of the information and/or content provided herein and the Company cannot be held responsible for any omission, mistake nor for any loss or damage including without limitation to any loss of profit which may arise from reliance on any information supplied by TFA Global Pte Ltd.
The speaker(s) is neither an employee, agent nor representative of Tradu and is therefore acting independently. The opinions given are their own, constitute general market commentary, and do not constitute the opinion or advice of Tradu or any form of personal or investment advice. Tradu neither endorses nor guarantees offerings of third-party speakers, nor is Tradu responsible for the content, veracity or opinions of third-party speakers, presenters or participants.

Solana Wave Analysis – 13 October 2025
- Solana reversed from key support level 150.00
- Likely to rise to resistance level 210.00
Solana recently reversed up sharply from the key support level 150.00, which has been reversing the price from July, as can be seen below.
The upward reversal from the support level 150.00 stopped the earlier sharp downward ABC correction 2 from September.
Given the recent breakout of the round resistance level 200.00 and the strongly bullish crypto sentiment seen today, Solana can be expected to rise to the next resistance level 210.00.

Solana's Crucial Test: Approaching Trend Change ResistanceSolana's Crucial Test: Approaching Trend Change Resistance
SOL/USD on the 4-hour timeframe illustrates a significant market movement, characterized by a sharp correction followed by a determined recovery. Solana is currently testing a critical confluence of resistance, which will be instrumental in dictating its near-term direction. This analysis will detail Solana's recent price action and highlight the pivotal levels that define its current standing.
The Retreat and The Resilient Foundation
Solana experienced a robust uptrend that peaked near the 240 level in early October. This was succeeded by a notable decline, as price broke down through several key levels. It pierced the 230 1st Resistance (now support), the 220 to 224 Deciding Area, and the 215 Key Support (now resistance). A particularly sharp drop on October 11th brought Solana down to establish a firm base around the 175 support level. This zone demonstrated strong buying interest, effectively halting the decline.
The Grand Comeback: From Depths to Decision
Following the bounce from the 175 support on October 11th, Solana initiated an impressive recovery. This upward movement is marked by a series of strong green candles, indicative of renewed bullish momentum. The price has successfully climbed from its lows, consolidating above the Next Support near 190 (green band) and showing a clear upward trajectory, as depicted by the dotted white lines forming a potential ascending structure.
This significant comeback has now brought Solana directly into the 200 to 205, Trend Change zone (light green band). This area is further reinforced by a descending red trendline, creating a critical overhead resistance confluence.
The Current Crossroads: 200 to 205 and the Trendline
Solana is currently engaged in a battle within the 200 to 205, Trend Change zone, simultaneously confronting the descending red trendline. This convergence of resistance is crucial; a decisive break above both this zone and the trendline would signify a potential shift in the short-term trend from bearish to more neutral or bullish. Conversely, a rejection here could lead to a consolidation or a retest of immediate support levels.
Key Levels to Watch: Resistance & Support
On the Upside (Resistance):
200 to 205, Trend Change & Descending Trendline: This immediate confluence represents the most critical overhead barrier. A sustained break above these would be a strong bullish signal.
215 Key Support (now potential resistance): Above the 200-205 zone, this red band represents the next significant resistance, which previously acted as crucial support.
220 to 224 Deciding Area: This grey band is a higher resistance zone that previously served as a consolidation and pivot point.
230 1st Resistance: The yellow band marks another significant resistance point, aligning with prior peaks during the earlier uptrend.
240: The dark red band represents the previous local top.
On the Downside (Support):
Next Support near 190: This green band acts as immediate support for the current recovery. Maintaining price above this level is important for continuing the upward momentum.
175: This dark green band remains the ultimate foundational support. A break below this level would invalidate the current recovery structure and could signal further downside.
Potential Scenarios from Here
The chart illustrates potential paths forward with dotted white lines:
Bullish Scenario: A successful and sustained breakout above the 200 to 205, Trend Change zone and the descending red trendline could propel Solana towards the 215 Key Support (now resistance) and subsequently the 220 to 224 Deciding Area.
Correction Scenario: A rejection from the current resistance confluence might lead to a retest of the Next Support near 190. A deeper pullback could see the price testing the 175 support if the 190 level fails to hold.
Conclusion
Solana has demonstrated strong resilience, bouncing robustly from the 175 support. It now faces a critical test at the confluence of the 200 to 205, Trend Change zone and the descending trendline. The ability of Solana to decisively overcome this resistance will be key to determining whether its recovery can evolve into a more significant trend reversal or if a period of consolidation or deeper retracement is more likely. Close observation of price action around these crucial levels is essential for understanding Solana's short-term market direction.
Disclaimer:
The information provided in this chart is for educational and informational purposes only and should not be considered as investment advice. Trading and investing involve substantial risk and are not suitable for every investor. You should carefully consider your financial situation and consult with a financial advisor before making any investment decisions. The creator of this chart does not guarantee any specific outcome or profit and is not responsible for any losses incurred as a result of using this information. Past performance is not indicative of future results. Use this information at your own risk. This chart has been created for my own improvement in Trading and Investment Analysis. Please do your own analysis before any investments.

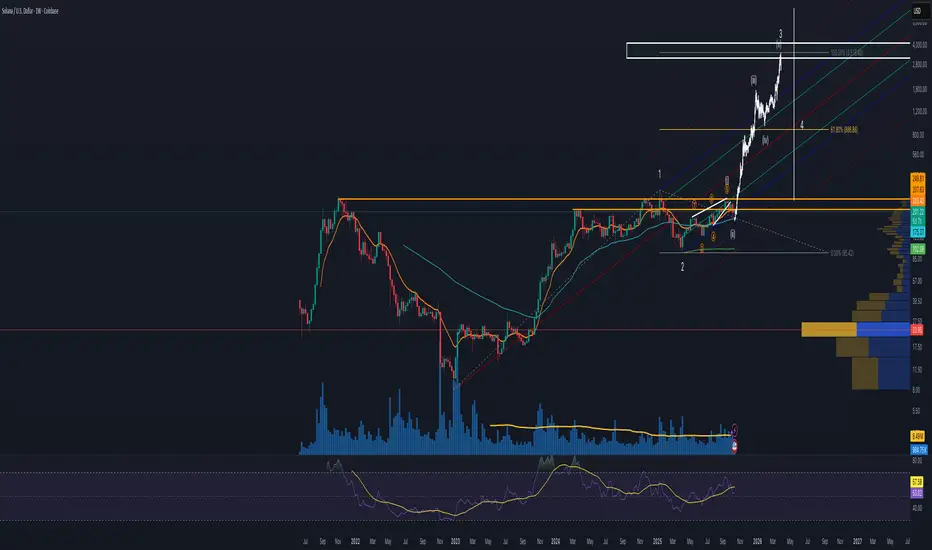
Preparing for 3 of 3 on SolanaI believe we have completed a leading diagonal on solana and are preparing to head into a 3 of 3 phase and break the massive cup and handle pyscological formation. Cup and handle target is quite high on log, $7500 range. This may be a longer term consideration, but my target range is 1k initialy, 3500 on the next leg after a consolidation around 1k.
Solana making the first move?Something unexpected happened: solusd broke through the upper side of the descending channel compared to ethusd. Really bullish!

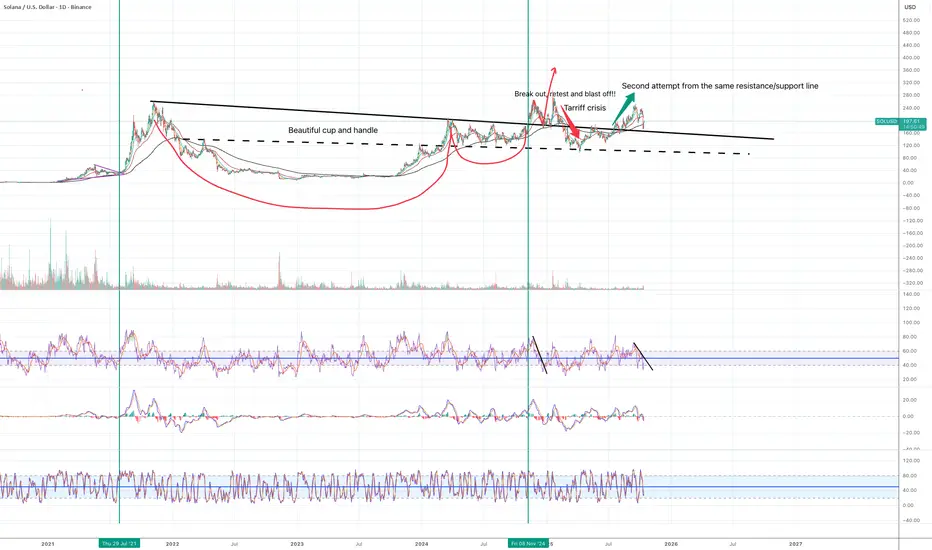
The second attempt to complete a massive cup and handle ?Solana is forming a massive cup and handle in the daily chart. In early November, Solana finally broke above the resistance line and (temporarily) completed the cup and handle pattern.
It is only the speculation, but if we did not have the US tariff drama, Solana (and the rest of the market) would have started a strong bull cycle.
In August 2025, the price finally broke above the resistance line again. It looked like the price was going to finally start to move to the upside. Then, we experienced another crypto bloodbath due to the US-China tariff issue last Friday. I have no idea how the next few weeks will unfold, but at this stage, the price managed to stay above the support line and it is recovering.
I already hold Solana positive for long term investment, but I intend to open a swing trade position when:
1. Daily RSI lines cross to the upside and break above the descending resistance line.
2. Stochastic move to the 50 zone.
3. MACD lines can stay in the bear zone, but the lines needs to cross and tilt to the upside.
SOLUSD Long Idea: Bullish Reclaim of Key Support/Resistance LeveHello TradingView Community,
This post outlines a potential long trade setup for the Solana / U.S. Dollar (SOLUSD) pair, based on the 15-minute timeframe.
Technical Analysis:
The chart shows a key horizontal price level that has acted as a significant pivot point, serving as both support and resistance. After a sharp breakdown below this level, the price has shown considerable strength by rallying and breaking back above it.
This is a bullish signal, suggesting that buyers are stepping in to reclaim control. The trading idea is based on a classic "break and retest" pattern. The price is currently consolidating on top of this former resistance zone. The expectation is that this level will now act as new support, providing a solid base for a potential move higher.
Trade Setup:
The long position tool on the chart visualizes a potential trade plan for this bullish scenario:
Entry: Approximately at the retest of the new support line.
Stop Loss: $184.43 (placed below the key support structure to invalidate the idea if the level fails to hold).
Take Profit: $232.24 (targeting a new potential higher high).
This setup provides a structured plan with a favorable risk-to-reward ratio for a potential continuation of the bullish momentum.
Disclaimer: This analysis is for educational and discussion purposes only and should not be considered financial advice. Trading cryptocurrencies involves significant risk. Please conduct your own due diligence and manage your risk appropriately.
Use Arrow Up and Arrow Down to select a turn, Enter to jump to it, and Escape to return to the chat.

What's up with Solana?As we can see, Solana is currently sitting at a resistance level and has managed to hold up well there. In addition, the uptrend has not been broken, since the candle closed back above the potential trend break.
The long wicks we’ve seen across several cryptocurrencies occurred because many trading algorithms on crypto exchanges were not designed to handle such situations properly. These algorithms often compare prices, demand, and supply across different exchanges to determine fair pricing.
For example, if $1 billion were to flow into Solana in a single day, it would have a much larger price impact than $100 million per day over ten days. That’s why traders should always wait for candle closures before making decisions.
The recent crash was triggered by an announcement from Donald Trump, which wasn’t directly related to cryptocurrencies themselves. The broader uptrend remains intact and continues.
Given the current uncertainty, prices are moving sideways. I would consider buying Solana around the $180 level or below, as that still represents a good entry price for this asset. If we soon see rate cuts and the U.S. dollar weakens further under Trump, more investors are likely to move into alternative assets such as cryptocurrencies and Solana remains one of the leading projects in that space.

Solana Scenarios for the monthMonthly Scenarios
Bullish Scenario
SOL holds support in the $180-$184 range and breaks above $184-$190.
This will provide impetus to targets in the $230-$300+ range, especially if the market turns out favorable and there is positive news regarding SOL/ETF/on-chain activity.
Consolidation/Sideways
The price may remain stuck in the $180-$190 range without a clear direction, especially with light volume.
In this scenario, it is important to monitor reactions at the range boundaries.
Bearish Scenario
If SOL breaks below $180-$184 with volume, a decline to the lower support level of $143-$153 or even lower is possible.
Such a correction could serve as a "normalization" after a significant rise.
✅ Conclusion
The current monthly trend for SOL appears generally bullish, with strong potential for continued growth upon a breakout of resistance.
But the key area to watch is the $184–190 zone: if there's a breakout with volume, we expect an upward acceleration.
The $180 and especially $153–143 support zones are areas to monitor for trend stability.
The CoinCodex forecast (~3-5%) suggests moderate growth, but with the potential for strong momentum under favorable conditions.
DO NOT BUY THE DIP! Watch what Nasdaq is doing. My overall bias for Solana is bullish, but right now the trend is very bearish. I don't think it is the time to buy the dip and I think more aggressive downside move is possible.
I have listed the reasons for my views below:
Nasdaq chart:
1) The correlation between Bitcoin and Nasdaq has been very high. Nasdaq has been going up since April 2025 without any decent correction and this week's candle finally formed a clear bearish engulfing candle.
2) Daily RSI and Stochastic have formed clear negative divergence and they are rolling to the downside.
Bitcoin chart:
1) RSI in both monthly and weekly charts show clear negative divergence.
2) The price failed to break above the major ascending resistance line and started to drop aggressively.
Solana chart:
Solana follows Bitcoin and Solana's move is much more aggressive than that of Bitcoin. Based on the moves of Nasdaq and Bitcoin, I am anticipating Solana will continue to drop further. Temporary recovery might be possible but I need to wait and see how Nasdaq moves this week.
Solana weekly chart:
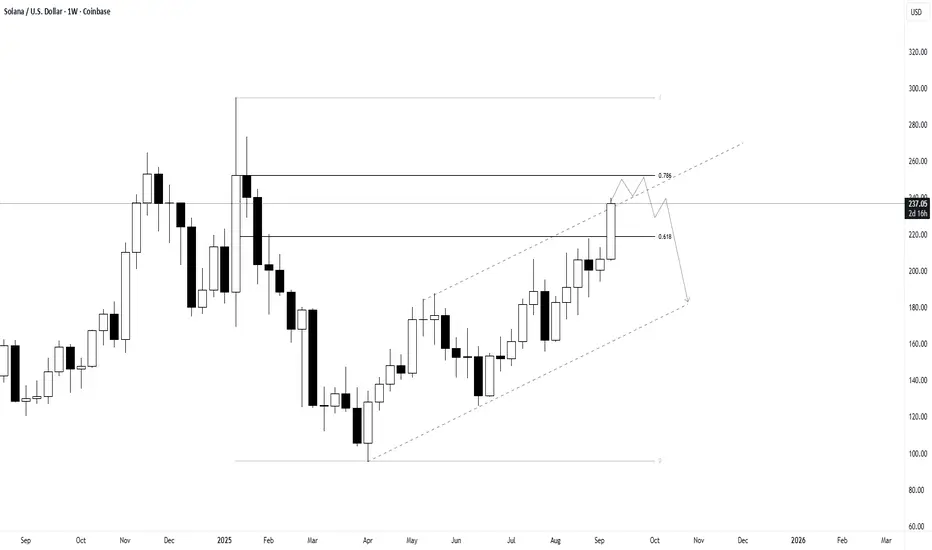
The price is moving inside the parallel channel for the last 5 years.
The price started to move in Oct 2023 and reached $204 at Fib 0.786 level in March 2024. However, since then the price has been basically moving sideways.
I have been using the three ascending trend lines in the weekly chart along with momentum indicators as rough guides to understand the price action.
The price moved up to the top of the green trend line, failed to break above and now is heading down to the purple trend line.
RSI also rolled to the downside. Stochastic formed negative divergence.
Solana daily chart:
Friday's daily candle formed a massive bottom wick. (see the yellow rectangular box in the daily chart).
In regard to a long wick, I found on many occasions if the price doesn't immediately start to move above the closing price in the following day, the length of the wick becomes the range where the price oscillates for a while and often it moves further to the downside. Therefore, I am closely watching the price move in shorter time frames such as 15 min and 1H.
Conclusions:
Given all the positive developments happening in the Solana ecosystem, it is very hard to accept the current price action. However, as a technical trader, I need to respect what the price is telling me and it is clearly bearish. I am not shorting Solana: I am waiting for the signs of recovery.
Three blue rectangular boxes in the weekly chart are unmitigated fair value gaps and I have set the buy orders in these zones. It is difficult to think the price will come down to the bottom blue box, however, if there is a massive capitulation event, it is possible for the price to wick down to that level.
I hope you are all doing well. It is a challenging market.
Can we buy?Most likely this can hit 150s and turn around, this has to happen with in a month or so. If it did then we will see it at 375. Happy trading !!
Not a financial advise.

SOLANA – Last Line of Defense🚨 CRYPTO:SOLUSD has completed a 3-wave corrective pullback, testing the April trendline and reaching the equal legs support zone at $175–$160. This area is acting as a potential launchpad for a bounce through the rest of the month.
💥 Can SOL break into new highs, or will this bounce form a lower high, signaling a possible trend reversal?

Fake breakout SOLSOL is breaking out of its channel. With the upcoming news on potential rate cuts, anything could happen. From a technical perspective, we’re approaching the 0.78 Fib level sitting right at a strong weekly resistance around $251.88. A fakeout could occur, and prices might possibly drop to the $170–$150 area.
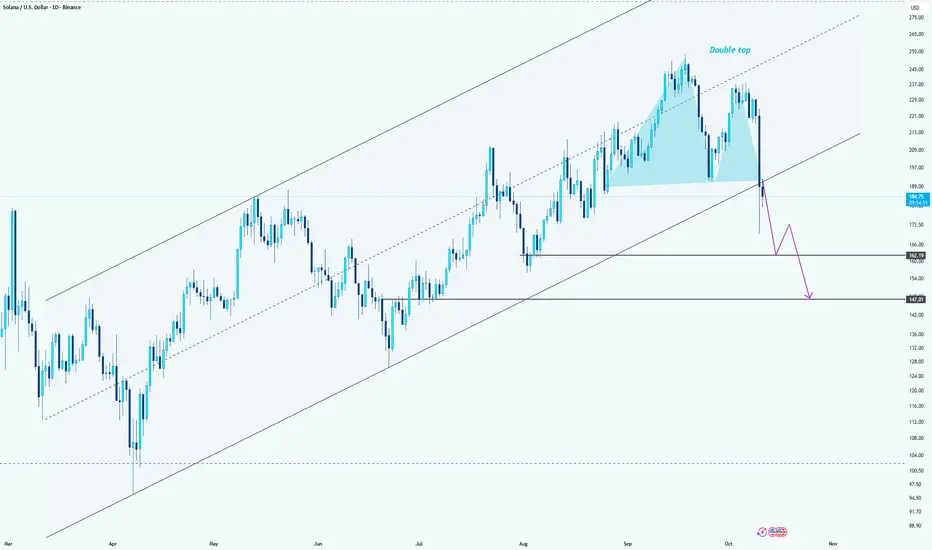
Solana Faces Bearish Pressure Below $190 SupportHi everyone!
Solana appears to be forming a double top pattern near the $250 zone, signaling potential bearish momentum. After failing to sustain above the upper channel resistance, the price broke below the midline support, confirming short-term weakness.
Currently, SOL is retesting the neckline area around $190. If it fails to reclaim this level, further downside is likely. The next key support zones lie around $165 and $147, aligning with the previous structure and the lower channel boundary.
A clean break below $165 would likely accelerate the move toward $147, confirming a deeper correction within the broader ascending channel.
Bias: Bearish below $190
potential targets at $165 → $147.