SOL/BTC - Solana: BBand Breakout◳◱ On the $SOL/ CRYPTOCAP:BTC chart, the Bband Breakout pattern suggests an upcoming trend shift. Traders might observe resistance around 0.0023843 | 0.0025267 | 0.0027507 and support near 0.0021603 | 0.0020787 | 0.0018547. Entering trades at 0.0022642 could be strategic, aiming for the next resistance level.
◰◲ General info :
▣ Name: Solana
▣ Rank: 5
▣ Exchanges: Binance, Huobipro, Mexc, Kraken, Hitbtc
▣ Category/Sector: Infrastructure - Smart Contract Platforms
▣ Overview: Solana is a public base-layer blockchain protocol that optimizes for scalability. Its goal is to provide a platform that enables developers to create decentralized applications (dApps) without needing to design around performance bottlenecks. Solana features a new timestamp system called Proof-of-History (PoH) that enables automatically ordered transactions. It also uses a Proof of Stake (PoS) consensus algorithm to help secure the network. Additional design goals include sub-second settlement times, low transaction costs, and support for all LLVM compatible smart contract languages.
◰◲ Technical Metrics :
▣ Mrkt Price: 0.0022642 ₿
▣ 24HVol: 566.038 ₿
▣ 24H Chng: 2.092%
▣ 7-Days Chng: 3.31%
▣ 1-Month Chng: 1.71%
▣ 3-Months Chng: 78.15%
◲◰ Pivot Points - Levels :
◥ Resistance: 0.0023843 | 0.0025267 | 0.0027507
◢ Support: 0.0021603 | 0.0020787 | 0.0018547
◱◳ Indicators recommendation :
▣ Oscillators: BUY
▣ Moving Averages: STRONG_BUY
◰◲ Technical Indicators Summary : BUY
◲◰ Sharpe Ratios :
▣ Last 30D: 1.58
▣ Last 90D: 3.32
▣ Last 1-Y: 2.00
▣ Last 3-Y: 1.35
◲◰ Volatility :
▣ Last 30D: 0.77
▣ Last 90D: 1.16
▣ Last 1-Y: 0.89
▣ Last 3-Y: 1.25
◳◰ Market Sentiment Index :
▣ News sentiment score is 0.66 - Bullish
▣ Twitter sentiment score is 0.57 - Bullish
▣ Reddit sentiment score is 0.36 - Bearish
▣ In-depth SOLBTC technical analysis on Tradingview TA page
▣ What do you think of this analysis? Share your insights and let's discuss in the comments below. Your like, follow and support would be greatly appreciated!
◲ Disclaimer
Please note that the information and publications provided are for informational purposes only and should not be construed as financial, investment, trading, or any other type of advice or recommendation. We encourage you to conduct your own research and consult with a qualified professional before making any financial decisions. The use of the information provided is solely at your own risk.
▣ Welcome to the home of charting big: TradingView
Benefit from a ton of financial analysis features, instruments and data. Have a look around, and if you do choose to go with an upgraded plan, you'll get up to $30.
Discover it here - affiliate link -
SOLBTC.P trade ideas

SOL knows the assignmentSOL looking to take some share away from btc
A clear impulse here with a potentially finished correction as all it had to do was make a double bottom here at best. Volume is indicating there could be a bullish divergence here soon and BTC is just chilling! Don't you love to hear that?
This is SOLBTC
Check out my SOLUSD chart too showing how the moving averages are behaving
ChatGPT4 Says (Sorry im too lazy to explain)
The chart you've shared appears to be a cryptocurrency trading chart for SOL/Bitcoin (SOL/BTC) on a 4-hour timeframe from the Binance exchange. Here are some observations based on typical technical analysis:
Elliott Wave Pattern: The chart shows what appears to be an Elliott Wave pattern, with waves labeled (1) through (4). Elliott Wave theory is a method of technical analysis that traders use to analyze financial market cycles and forecast market trends by identifying extremes in investor psychology, highs and lows in prices, and other collective factors.
Triangle Formation: After the completion of the Elliott Wave pattern, the price seems to be consolidating in a converging pattern, which could be a symmetrical triangle. This is typically a continuation pattern, meaning that the breakout could potentially be in the direction of the overall trend prior to the triangle's formation. However, a breakout could occur in either direction.
Volume: The volume bars at the bottom do not show a significant increase in volume, which would typically accompany a strong breakout. Traders often look for increasing volume as confirmation of a pattern breakout.
RSI Divergence Indicator with EMA: The Relative Strength Index (RSI) is overlaid with an Exponential Moving Average (EMA). The RSI appears to be in the middle range, neither overbought nor oversold, which offers no strong signal on its own. However, the RSI divergence indicator can sometimes predict potential reversals if there are divergences between the RSI and price action.
Labels A, B, C, and D: These labels might indicate specific points of interest or could be marking the points of the triangle.
Bull Label on RSI: This could suggest that there was a bullish divergence signal given by the RSI divergence indicator at some point, which could be a sign of potential upward price movement.

SOLBTC Chart wait 2 weeksGuys wait it cross the downtrend put your 30% stake if it touch the support line and come back put 30% if it cross resistance line invest 50% stake this is going to Moon
Good luck

SOL/BTC vs ETH/BTCSolana has been steadily outperforming most large cap crypto coins. Here is a comparison between SOL/BTC vs ETH/BTC. You can see that Solana has been consistently outpacing ETH compared to BTC this last year.

Solana showing relative strength on two fronts (USD & BTC)SOLANA - KEEP AN EYE ON THE EXITS
Solana continues to hold the 21 daily moving average and has relative strength against BTC even with the recent mini BTC pump.
Whilst I think we need to keep our eyes on the exit over the coming 2 - 8 weeks these charts continues to look very positive with any BTC upside propelling CRYPTOCAP:SOL higher than BTC in BTC relative terms.
As SOL has had a monumental 774% run from June 2023 increasing from $12.50 to $110 today, its time to start considering profit taking. With this in mind, a large portion, maybe 60-70% of the current position I hold will be exited on/sold on a close below the 21 daily moving average (in USD).
For now I believe we may be reaching into a frothy peak as the Bitcoin ETF announcement approaches, ahead of which I would see taking profits off the table as a wise decision.
We have to remember that the upwards volatility in SOL, the leverage gained relative to BTC, will flip into into downwards volatility in SOL on a BTC decline, resulting in a much harsher sell off than that of Bitcoins correction. I am not predicting that the Bitcoin ETF approval or decline will result in a massive sell off in BTC, but it would remiss of us not to expect a 30% pullback in BTC over the next 2 weeks to 8 weeks as STANDARD BTC behavior at this point in the BTC cycle. If this happens, the price of SOL will likely see much heavier major downside.
Lets see what happens over the next 2 weeks and we will check in again. T
These perspectives I am sharing are more about framing where we are in this current market and how we might think about protecting ourselves against the typical BTC price behaviors we have come to expect as standard such as the 30% drawdown (which we have not had yet). If your a longer term holder, none of this really matters, you are holding on a longer timeframe. Also important to note that we could see FWB:52K - $58k BTC before such a pull back or, maybe this will be the one time BTC goes into a super cycle? Who knows, we are just looking at the exits and protecting ourselves.
Stay Nimble Folks
PUKA


SOLBTCSOLBTC
Since It's in the supply zone, I think we are at the end of the sol dream
To be honest, I don't know if the area would work. We'll see
I won't expect it will hit above the 3th mark.
It's just an idea please don't take it serious.

SOL/BTC long ideaIts shown rang idea and then long idea for sol, I think about 40% increasing in price for sol

Is it time to correction of Solana?Solana to Bitcoin has reached near the top of the channel. Should we wait for SOL reform?
According to the upward momentum, I considered 3 movements for this chart:
1) Correction from the top of the channel to the area of 0.0012-0.00136
2) fake Breaking the channel and correcting it up to 0.0012
3) Break the channel and pull back to it and continue the trend to the upper areas
what is your opinion? Do you think Solana can break this channel?

Planning moves on SOLBTC. Continuation Pattern
. Wick Fill
. BTC Halving - Nobody wants to sell BTC - that´s why I believe its a continuation / accumulation pattern on this level.
. Sol Phones selling on EBAY - Stil don´t know if will be a genius move or the opposite :)

The AltCoin/BTC bloodbath might spare SOLBullcase
The formation formed on decreasing volume
Breakout and consolidation above the ema21
Stoch Crossing over
RSI support
Engulfing candle on several timeframes
I have my SL set at 0.00078

LAST WAVE B4 COMPLETIONSolana can sell off in this moment and head for Wave 7.
Would be a good short if this plays out.
My target is $48 on the SOL/USDT Chart.
Simple & Clean Analysis!
Happy Trading!!⚔️
Feel free to follow me for more posts! :)

SOLBTCSOLBTC
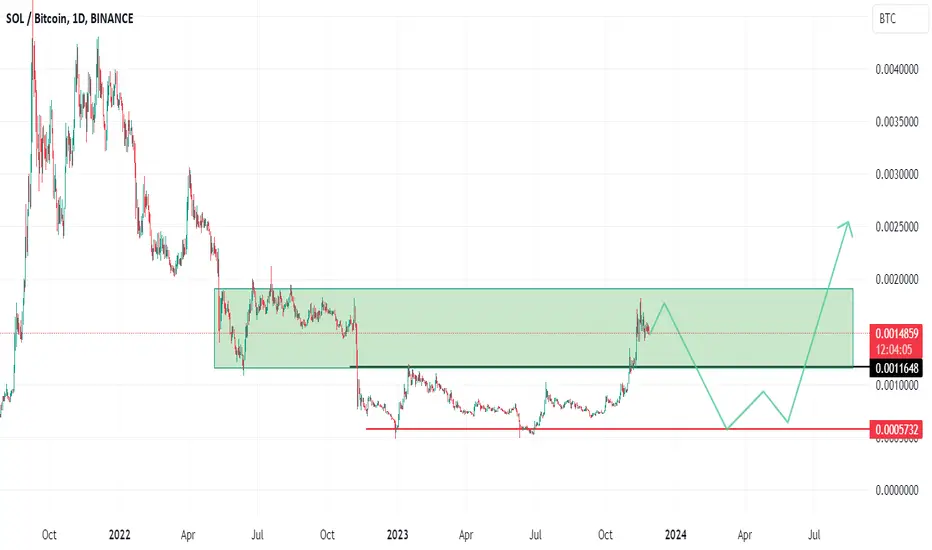
Solana paired with Bitcoin is trading in the green channel. It will be very good if we continue to be in this range and gradually move down to the red line. Then Solana will have a great chance to show good results in the next altseason.
Don't forget to show your support by like(rocket) and comment✅
Also you can ask for only 1 altcoins analysis and i will try to do my best to cover as much as i can✍️
Solana breaks out vs. Bitcoin. Nears prior area of resistance.Solana is where it's at while Ethereum continues to lose ground to Bitcoin. However, we've had this run-up before, and we are nearing an area where we could see a pullback to support. If you are just now entering Solana, be aware of these prior areas of consolidation vs. Bitcoin.

SOLBTCMarked out is the next key level order block for the BTC evaluation of Solana. Would be cautious to see what happens to price when we reach this key level.
In bull market conditions, we would expect a higher high above this level, which could then see further continuation before a retracement.

SOL BTC - Massive Inverse Head and Shoulders (SOL = BOSS)Hello Guys,
this pattern is absolutely crazy. Solana has this massive Double Bottom against BTC and ETH and is just breaking out the Inverse Head and Shoulders against Bitcoin, absolutely insane.
This is just getting started and will outperform BTC by 100% in the immediate mid / short term,
SOLANA best Coin to hold - Leader of the Market.
Lesson: The Death Called Live the Longest, never Forget

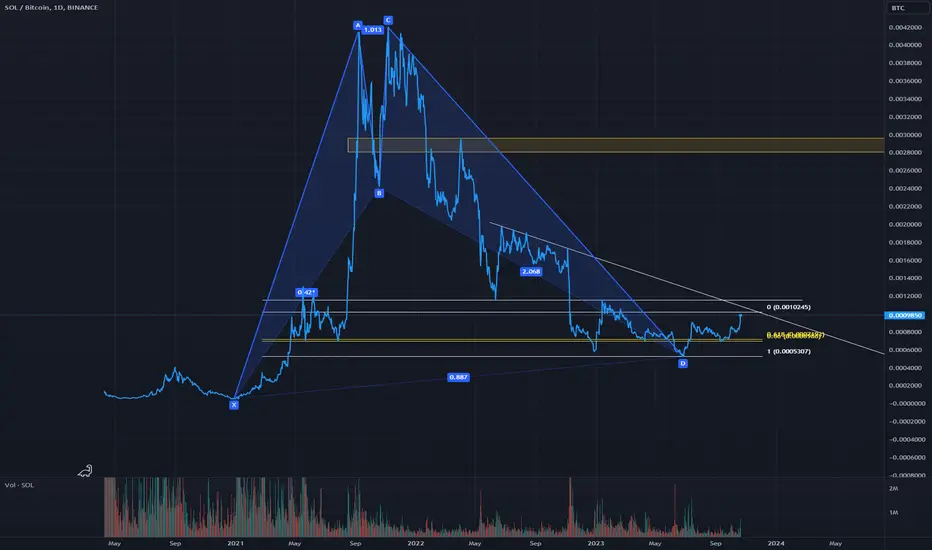
SOL/BTC (SOL/USDT) GLORY TO THE SUN, THE SHINING STAR OF GAIA!The stars and constillations are alligned... Hell, in all my trading years this allignment is probably more like GALACTIC allignment.
Multiple 61.8% levels,
cypher 88,6% key level retracement,
Adam & eve
Bump and run pattern
Triangle breakout
What more do we need... This boy is going to 60$ TP1 with a final level of 144$ for a TP2...
And when we do reach these levels, it's likely we move to all time high in the future when bitcoin breaches those 31-32k levels.
Who knows where the sun might settle by then...
SOL SHORT IDEAhello eveyrone sol is close to resisitance in btc and usdt pair. so we can try short position;
entry 0.0007846
stop: 0.0007491
target 0.0006776
here is also sol usdt pair graph ;


Is Solana a Good Buy Below 0.0007 BTC?SOL/BTC Technical Analysis
Current Trading Level: 0.00055 BTC
Key Levels:
Support: 0.00029 BTC
Resistance: 0.00070 BTC / 0.00110 BTC / 0.00200 BTC / 0.00300 BTC
Analysis:
Solana in the BTC pair is showing a bearish trend. The important support level of 0.00070 BTC has already broken down, and the price is currently trading below this level. This suggests that Solana is in a bearish trend and could continue to decline to 0.00029 BTC in the mid-term.
However, if Solana breaks above the resistance level of 0.00070 BTC, it could see a bullish rally towards 0.003 BTC. The best accumulation zone for Solana is likely to be around 0.00029 BTC.


SOL/BTCExcuse me!
Solana is suspected of regaining the 0.2 fibo level.
I speculate in that.
What do you think?
write it down

Bull Posting to keep my portfolio aliveIve been holding since 10$ and this is the last chance im giving SOL for a breakout. Targeting 33$. It's been sideways for 4 months now, and somethings got to give.
Im an irresponsibly long so here's my confirmation bias. Your welcome
