Solana Scenarios for the monthMonthly Scenarios
Bullish Scenario
SOL holds support in the $180-$184 range and breaks above $184-$190.
This will provide impetus to targets in the $230-$300+ range, especially if the market turns out favorable and there is positive news regarding SOL/ETF/on-chain activity.
Consolidation/Sideways
The price may remain stuck in the $180-$190 range without a clear direction, especially with light volume.
In this scenario, it is important to monitor reactions at the range boundaries.
Bearish Scenario
If SOL breaks below $180-$184 with volume, a decline to the lower support level of $143-$153 or even lower is possible.
Such a correction could serve as a "normalization" after a significant rise.
✅ Conclusion
The current monthly trend for SOL appears generally bullish, with strong potential for continued growth upon a breakout of resistance.
But the key area to watch is the $184–190 zone: if there's a breakout with volume, we expect an upward acceleration.
The $180 and especially $153–143 support zones are areas to monitor for trend stability.
The CoinCodex forecast (~3-5%) suggests moderate growth, but with the potential for strong momentum under favorable conditions.
Trade ideas
DO NOT BUY THE DIP! Watch what Nasdaq is doing. My overall bias for Solana is bullish, but right now the trend is very bearish. I don't think it is the time to buy the dip and I think more aggressive downside move is possible.
I have listed the reasons for my views below:
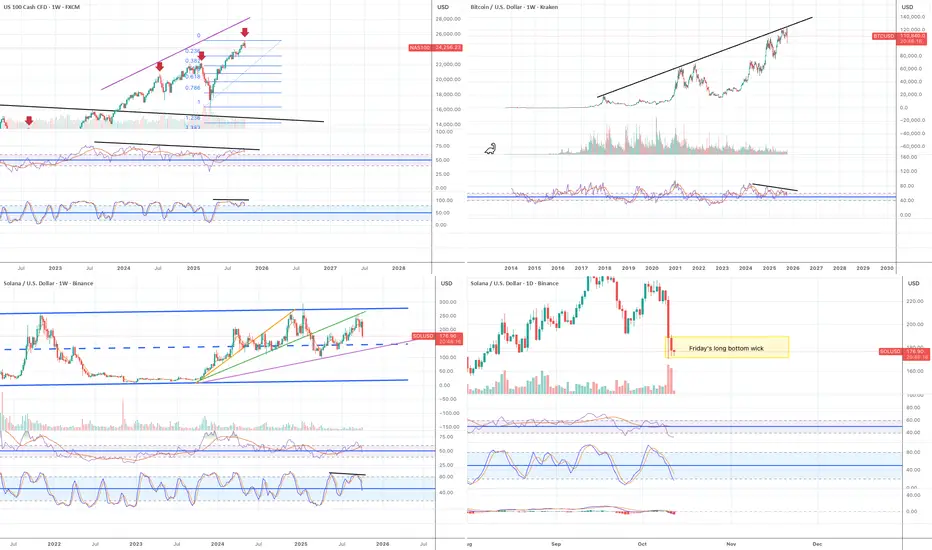
Nasdaq chart:
1) The correlation between Bitcoin and Nasdaq has been very high. Nasdaq has been going up since April 2025 without any decent correction and this week's candle finally formed a clear bearish engulfing candle.
2) Daily RSI and Stochastic have formed clear negative divergence and they are rolling to the downside.
Bitcoin chart:
1) RSI in both monthly and weekly charts show clear negative divergence.
2) The price failed to break above the major ascending resistance line and started to drop aggressively.
Solana chart:
Solana follows Bitcoin and Solana's move is much more aggressive than that of Bitcoin. Based on the moves of Nasdaq and Bitcoin, I am anticipating Solana will continue to drop further. Temporary recovery might be possible but I need to wait and see how Nasdaq moves this week.
Solana weekly chart:
The price is moving inside the parallel channel for the last 5 years.
The price started to move in Oct 2023 and reached $204 at Fib 0.786 level in March 2024. However, since then the price has been basically moving sideways.
I have been using the three ascending trend lines in the weekly chart along with momentum indicators as rough guides to understand the price action.
The price moved up to the top of the green trend line, failed to break above and now is heading down to the purple trend line.
RSI also rolled to the downside. Stochastic formed negative divergence.
Solana daily chart:
Friday's daily candle formed a massive bottom wick. (see the yellow rectangular box in the daily chart).
In regard to a long wick, I found on many occasions if the price doesn't immediately start to move above the closing price in the following day, the length of the wick becomes the range where the price oscillates for a while and often it moves further to the downside. Therefore, I am closely watching the price move in shorter time frames such as 15 min and 1H.
Conclusions:
Given all the positive developments happening in the Solana ecosystem, it is very hard to accept the current price action. However, as a technical trader, I need to respect what the price is telling me and it is clearly bearish. I am not shorting Solana: I am waiting for the signs of recovery.
Three blue rectangular boxes in the weekly chart are unmitigated fair value gaps and I have set the buy orders in these zones. It is difficult to think the price will come down to the bottom blue box, however, if there is a massive capitulation event, it is possible for the price to wick down to that level.
I hope you are all doing well. It is a challenging market.
Can we buy?Most likely this can hit 150s and turn around, this has to happen with in a month or so. If it did then we will see it at 375. Happy trading !!
Not a financial advise.

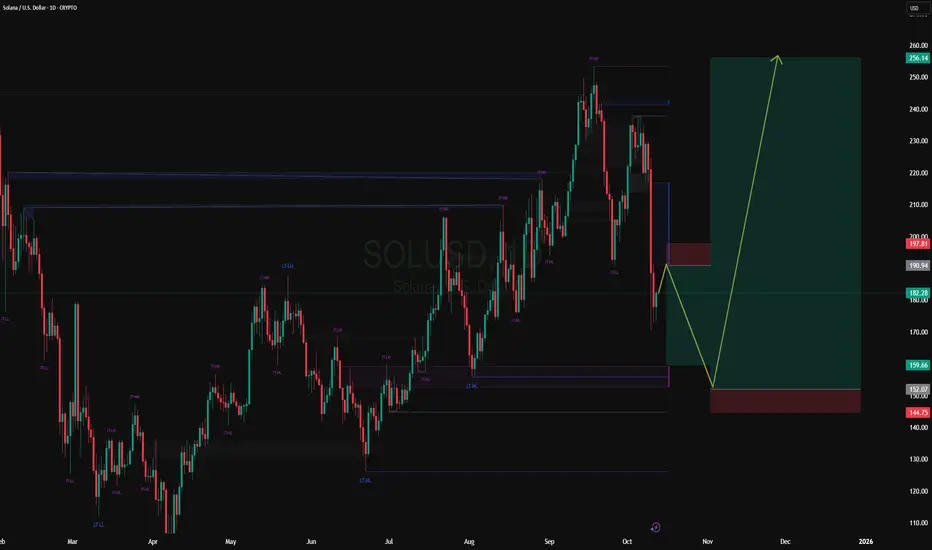
SOLANA – Last Line of Defense🚨 CRYPTO:SOLUSD has completed a 3-wave corrective pullback, testing the April trendline and reaching the equal legs support zone at $175–$160. This area is acting as a potential launchpad for a bounce through the rest of the month.
💥 Can SOL break into new highs, or will this bounce form a lower high, signaling a possible trend reversal?

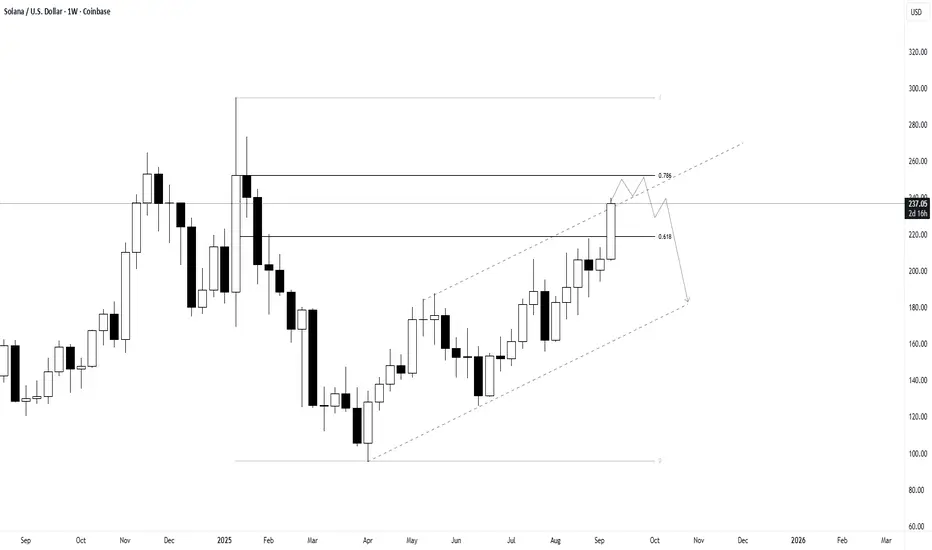
Fake breakout SOLSOL is breaking out of its channel. With the upcoming news on potential rate cuts, anything could happen. From a technical perspective, we’re approaching the 0.78 Fib level sitting right at a strong weekly resistance around $251.88. A fakeout could occur, and prices might possibly drop to the $170–$150 area.
Solana Faces Bearish Pressure Below $190 SupportHi everyone!
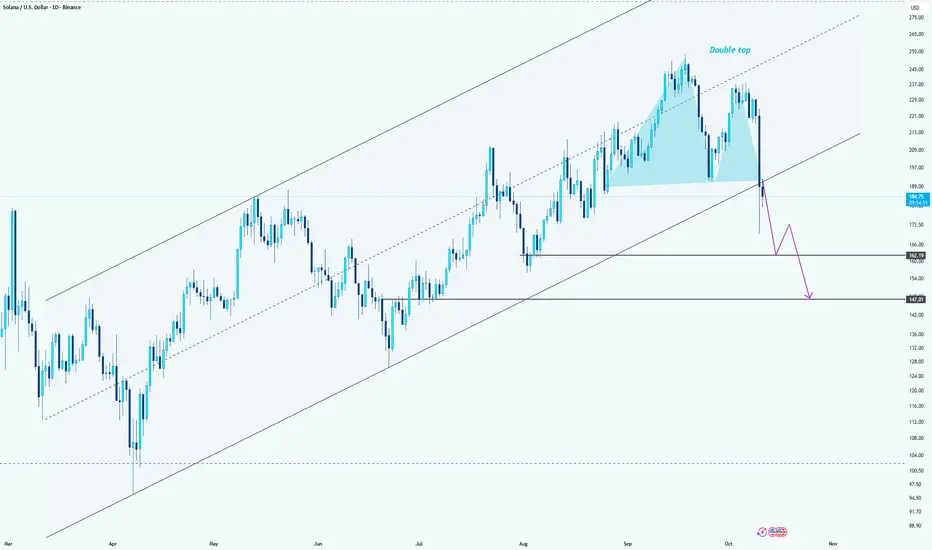
Solana appears to be forming a double top pattern near the $250 zone, signaling potential bearish momentum. After failing to sustain above the upper channel resistance, the price broke below the midline support, confirming short-term weakness.
Currently, SOL is retesting the neckline area around $190. If it fails to reclaim this level, further downside is likely. The next key support zones lie around $165 and $147, aligning with the previous structure and the lower channel boundary.
A clean break below $165 would likely accelerate the move toward $147, confirming a deeper correction within the broader ascending channel.
Bias: Bearish below $190
potential targets at $165 → $147.
SOLUSD: Observation🧩 Macro Context
Crypto liquidity improving — BTC dominance stabilizing near 54%.
Fed’s rate stance softening could support risk assets.
Institutional accumulation on Solana ecosystem (DeFi volume and NFTs rising again).
Q4 historically favors altcoin rotation, and Solana remains a top liquidity magnet post-Ethereum.
🔮 WaverVanir Forecast
If Solana holds $181.45 and reclaims $200+, the path to $295–$300 opens into Q1 2026.
However, a break below $175 invalidates the bullish bias and re-enters deep discount territory.

DO NOT BUY THE DIP!! It can go lower. My overall bias for Solana is bullish, but I must say it has been very frustrating asset to hold and trade for the last 18 months.
There are a lot of positive news coming up in the Solana ecosystem and the value of Solana should be much higher than the current price. However, the current chart set up is very bearish and I think it can potentially go lower. I will happily revise my view when the situation changes but I won't be buying the dip for the reasons below:
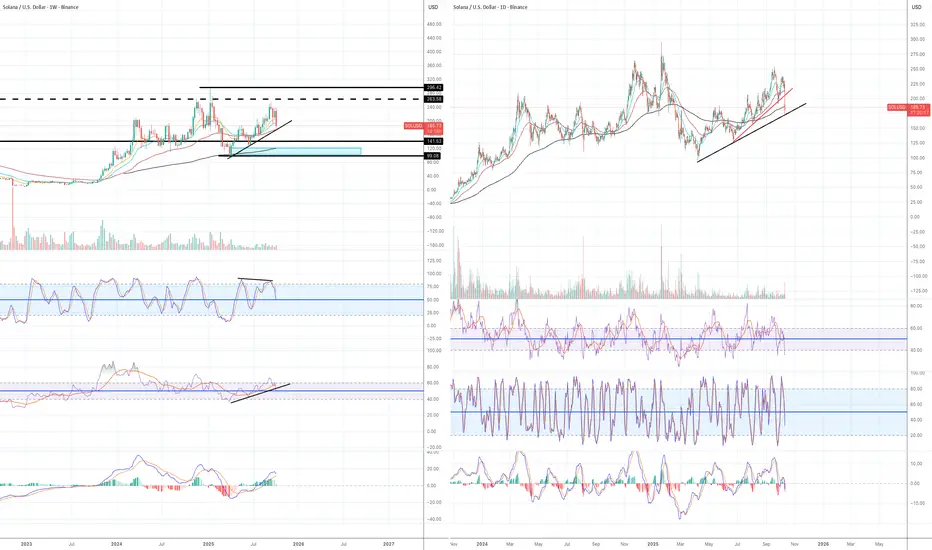
Weekly:
Stochastic indicator has formed a very clear negative divergence.
RSI lines have crossed to the downside and breached below the ascending trendline.
MACD histogram is losing bullish momentum and lines are about to cross (not confirmed)
The price has failed to go above not only the previous higher high, but also the previous cycle's all time high.
The price has breached below the ascending trendline, EMA 12 and EMA 21. (no confirmed until the end of tomorrow)
There is an unmitigated fair value gap (order block?) around $100 and $123 area (see light blue rectangular block). That is the April low when the market started to have a V-shape recovery.
I have been hearing over and over in the mainstream media that at the market bottom in April 2025, retail investors went in and bought the dip, but institutional players missed the rally by staying on the sideline. I am just wondering if big players are trying to push the price to the level where they were initially left behind. It is just my speculation, but the price is getting closer to that level.
Daily:
A daily candle closed below EMA55 and is now hovering over EMA200.
The price broke below the first ascending trendline (red line) and now moving toward the second one (black one)
All three momentum indicators have decisively entered the bear zone.
Conclusions:
I will only focus on daily and weekly charts for now. I have been watching the price move in the lower time frames and the price is refusing to go above yesterday's closing price, which makes me think there are lots of selling pressures still.
Good luck, everyone. I hope you are doing ok in this wild market.
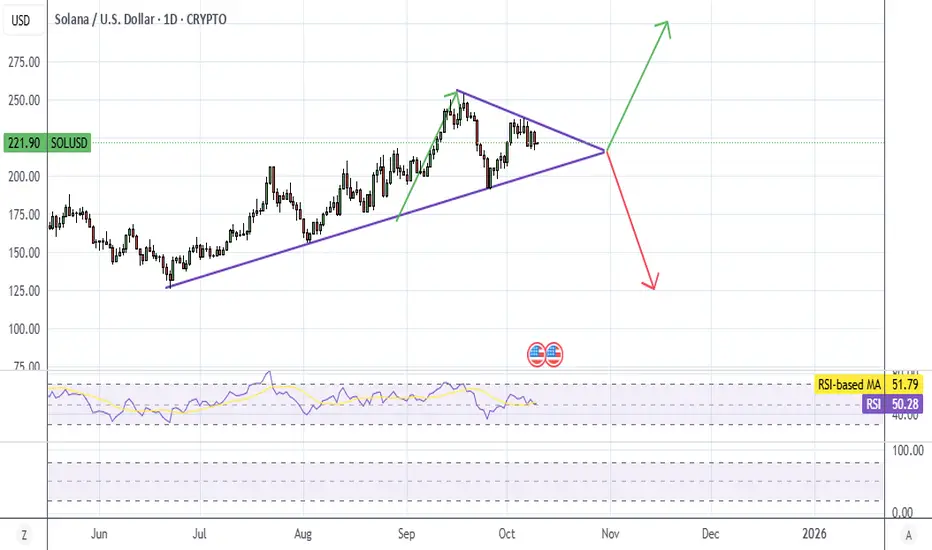
Solana, big move in NovemberSolana appears to be forming a pennant, indicates a big move in November, no idea which way, but I would lean towards the bullish side.
Might do a put protected long trade, I don't trust cryptos enough not to use protection, lol. This will probably coincide with BTC daily MFI going oversold because cryptos tend to move together. (See my BTC plot)
Solana - Market structure Shift - The Levels to be aware of !In this video I look at the higher time frame and point out some key reasons of why I'm expecting a deeper pullback as well as local time frame where we can see the clear levels to be taken if your looking to accumulate or open longs .
Aside from the Solana coin I look at the Eth/Btc pair and BTC which ultimately determines the fate of the alt coin market .
Any questions please feel free to ask in the comments section below

Solana and Bitcoin Update ! Whats Next Quick update covering BTC and Solana .
I had done videos previously anticipating this move to the downside and wanted to cover the current price action and add a little clarity to the situation .
We have had a great reaction off of BTC so far and thus some alts have also followed suit .
Bitcoin holds the fate for the alts so we want to see btc hold the current range 113K .
Take it level by level and dont panic . This is a great opportunity but we want to see a sign of strength in SOL before taking positions .

SOLUSD 4H: $215 Support Lost, Eyeing $200-205 Trend Change Zone
SOLUSD 4H: $215 Support Lost, Eyeing $200-205 Trend Change Zone
Chart Overview:
On the 4-hour timeframe, Solana (SOL/USD) has undergone a significant shift in market dynamics. After a strong bullish rally in late September and early October, the price has broken down from a consolidation pattern, signaling a clear return of bearish momentum.
Recent Price Action:
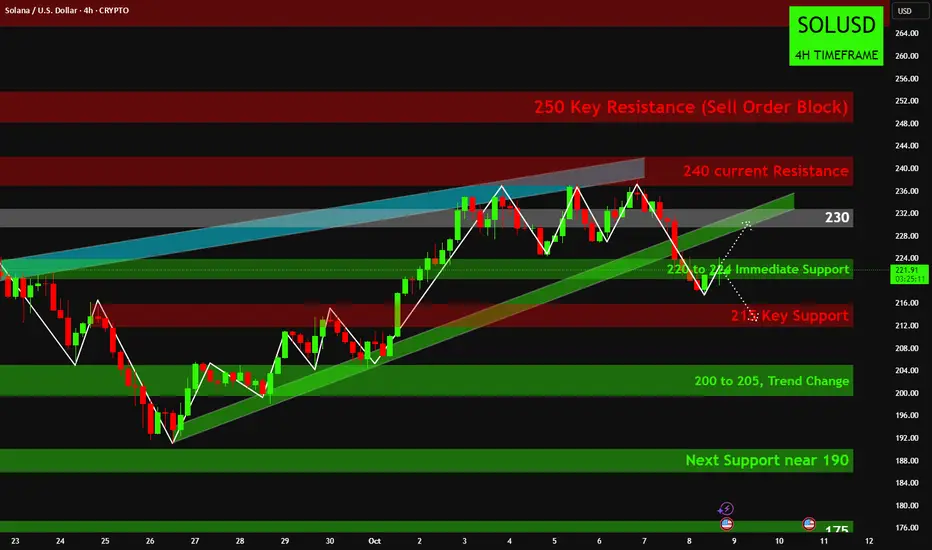
Solana had a robust recovery from its late September lows (around 195-200), driving price upward along an ascending green trendline. This bullish surge pushed SOL back towards the higher resistance zones. However, the rally started to lose steam as it approached the 240 Flip Zone and encountered strong selling pressure below the 250 Key Resistance (Sell Order Block).
Following this, SOL entered a period of consolidation, attempting to maintain structure above the 220 to 224 Deciding Area. This zone acted as a critical battleground for bulls and bears. Unfortunately for bulls, the ascending green trendline that had supported the rally was broken decisively. This breakdown was then confirmed by the price establishing a clear descending red trend channel, indicating a new bearish trend.
The crucial development is the recent breakdown below the 215 Key Support. This level, which offered bounces in the past, has been lost, and the price is now accelerating downwards, firming up the bearish outlook.
Key Resistance Levels to Watch:
215 Key Support (now Resistance): This is the immediate hurdle for any attempted rebound. Price must reclaim and hold this level to alleviate immediate bearish pressure.
220 to 224 Deciding Area: A pivotal zone. A successful move back above here would suggest a potential shift in momentum, but it will face resistance from the descending red trendline.
230 1st Resistance: A significant horizontal resistance level that acted as a ceiling during the recent consolidation.
240 Flip Zone: This area previously served as both support and resistance, and would be a strong barrier for any substantial recovery.
250 Key Resistance (Sell Order Block): The ultimate overhead resistance, representing the peak of the prior rally and a significant supply zone.
Key Support Levels to Monitor:
With Solana currently trading around 209 and actively breaking down:
200 to 205, Trend Change: This is the most critical immediate support zone. This area marked the low before the previous bullish rally began. A bounce here is crucial for bulls to prevent a deeper correction.
Significance: A break below this zone would indicate a potential trend change back to a more significant bearish structure, opening the door for much lower prices not visible on this chart.
Outlook & Scenarios:
Bearish Scenario: If Solana fails to find strong buying interest and support within the 200 to 205, Trend Change zone, a decisive break below this range would confirm a deeper bearish trend. This could lead to an accelerated move towards unexplored lower price levels.
Bullish Scenario: For bulls to regain control, SOL needs to first stabilize and strongly reject further downside at the 200 to 205 zone. A subsequent move to reclaim the 215 Key Support (turning it back into support) and then breaking above the 220 to 224 Deciding Area and the descending red trend channel would be necessary to signal a potential reversal or a return to bullish consolidation.
Conclusion:
Solana is currently under strong bearish pressure on the 4-hour chart, having decisively broken below the 215 Key Support and consolidating within a descending trend channel. The market is now actively testing the critical 200 to 205, Trend Change zone. Traders should remain highly vigilant, as the reaction at this level will be pivotal in determining Solana's short-to-medium-term direction. A failure to hold this support could open the floodgates for further downside, while a strong bounce could offer a glimmer of hope for a recovery.
Disclaimer:
The information provided in this chart is for educational and informational purposes only and should not be considered as investment advice. Trading and investing involve substantial risk and are not suitable for every investor. You should carefully consider your financial situation and consult with a financial advisor before making any investment decisions. The creator of this chart does not guarantee any specific outcome or profit and is not responsible for any losses incurred as a result of using this information. Past performance is not indicative of future results. Use this information at your own risk. This chart has been created for my own improvement in Trading and Investment Analysis. Please do your own analysis before any investments.

Pennant pattern observedCOINBASE:SOLUSD if the massive bull flag for BITSTAMP:ETHUSD will play out perfectly, then this pennant pattern from COINBASE:SOLUSD would play out perfectly too.

Solana Projection + ThesisChart is time synced to projection.
Q4 2025-Q1 2026
Market-wide cool off combined with extended government shutdown cause panic and doubt within all assets. BTC is relatively strong, but still dips near 100k. Narrative trap of "bear market" "cycle is over" etc. Massive emotion-rooted doubt within crypto despite strength.
Q2 2026+
Assets front-run fed chair change into the spring, and upon a new trump appointed chair in May 2026, all assets begin to rally hard into the fall. BTC and crypto lead this liquidity cycle behind a risk-on federal policy and macro playing field. Fed pivot, massive stablecoin growth (dominated by Solana).
4 years cycles are over. This is the explosive step forwards into mass adoption for BTC and crypto as a whole. Solana will dominate alts with DATs, ETFs with staking, the best stablecoin APY on the planet, and transactions at the speed of light.

Solana ; Market consolidatingtraders still can't give a strong sentiment on the next wave , so obviously the markent will try to balance itself withing this zone

Sol/Usdt - Breakout Or BreakdownResistance Zone
A green shaded area labeled "Resistance" indicates a key price level where price has previously failed to break higher.
This is a supply zone where sellers have stepped in multiple times.
Price has tested this resistance area several times but failed to break out convincingly.
2. CHoCH (Change of Character)
"CHoCH" is marked below the resistance, signaling a trend shift from bullish to bearish.
Typically, a CHoCH occurs when price breaks a recent higher low—indicating weakening bullish momentum and potential start of bearish move.
3. Decision Point
Labeled in blue as “Decision Point”.
This is a critical area where price may:
Break above and confirm a bullish continuation.
Reject and fall, confirming bearish pressure.
This zone could be used to plan entries based on confirmation (e.g., breakout or rejection).
4. Target Scenarios
Two possible scenarios drawn with arrows:
Bullish scenario: If price breaks above the decision point/resistance, the next target lies in the upper 230s or beyond.
Bearish scenario: If price rejects from this zone, it could lead to a bearish continuation, targeting lower support levels.
5. Volume
Volume bars at the bottom show varying levels of interest.
Increasing red volume toward the CHoCH indicates strong selling pressure.
Conclusion / Trading Plan
Watch the Decision Point zone closely.
Bullish bias: On a breakout with strong volume and bullish candle close above resistance.
Bearish bias: On rejection from the resistance zone with a lower high and a strong bearish candle.
Use tight risk management due to the proximity of volatility around the decision point.

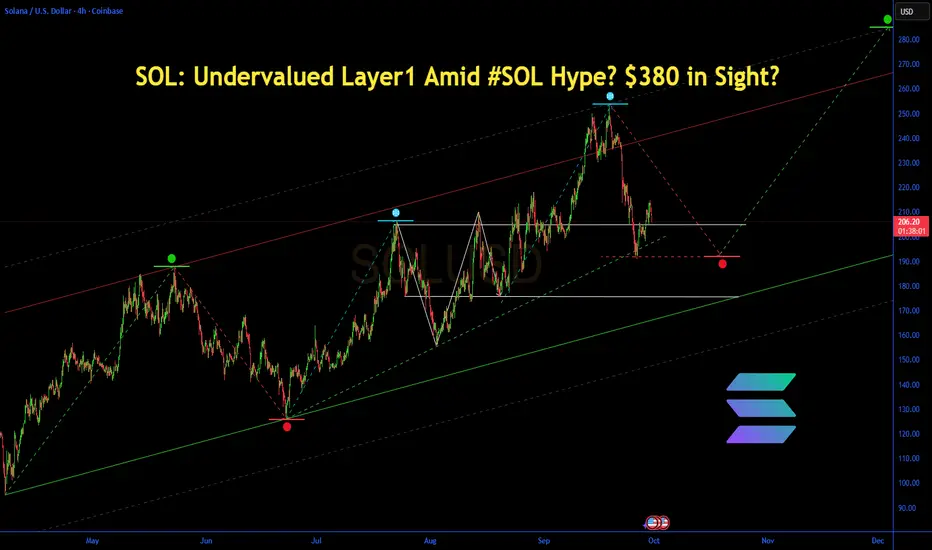
SOL: Undervalued Layer1 Amid #SOL Hype? $380 in Sight?SOL: Undervalued Layer1 Amid #SOL Hype? $380 in Sight?
Price $210.94 (-1.07%), fueled by TVL $12.2B surge and X airdrops, undervalued with 31.83% YTD, questioning if ETF inflows drive breakout.
Fundamental Analysis
Market cap $114.55B, TVL $12.2B up 57% 6M, supply growth stable; Lynch-like growth emphasis on 198% TVL rise, PEG adapted low vs peers; DCF projects $300+ on adoption moat; opportunity cost vs ETH favors efficiency, inversion warns outages.
Positive:
3.88% monthly rise.
67% staked.
Negative:
High volatility.
Rival competition.
SWOT Analysis
Strengths: Fast DeFi hub.
Weaknesses: Past downtimes.
Opportunities: ETF in #Altseason.
Threats: Regulations.
Technical Analysis
Sell signal short-term. Price: $210.94, VWAP N/A. Key indicators: RSI: Below 40/oversold.
MACD: N/A.
Moving Averages: Neutral.Support/Resistance: $177/$214. Patterns/Momentum: Potential rebound. Bullish | Bearish.
Scenarios and Risk Management
Bullish: Break $214, DCA to $380 on hype; second-order thinking amplifies network effects.
Bearish: To $150.
Neutral: Range $177-214.Risk Tips: 10% stops, diversify crypto, DCA weekly.
Conclusion/Outlook
Bullish on ecosystem, lollapalooza from #Crypto trends parabolic. Watch ETFs. Fits layer1 theme with #SOL upside. Take? Comment!
Solana: Trendline Breakdown & Support Test
Solana: Trendline Breakdown & Support Test
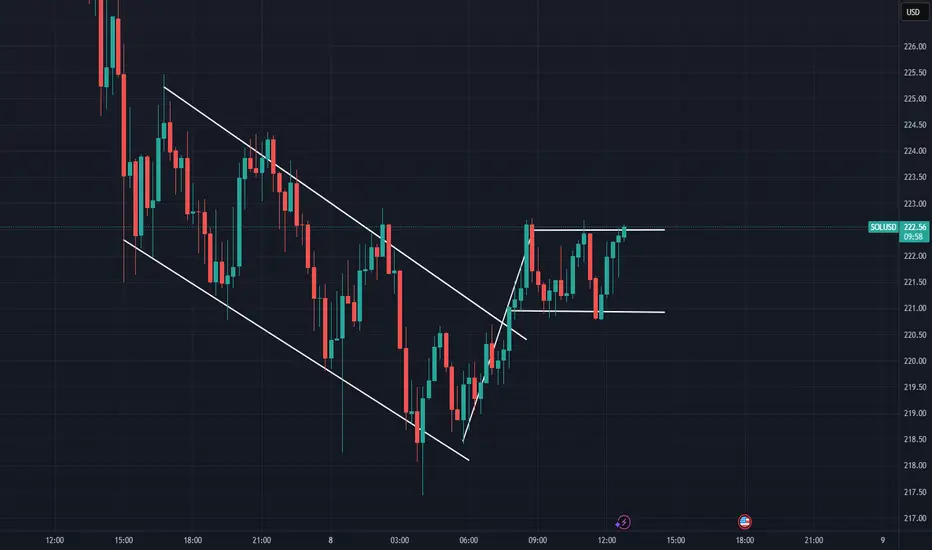
Solana (SOLUSD) on the 4-hour timeframe has recently broken down from its ascending trendline and is currently testing the "220 to 224 Immediate Support" zone, trading around 222.04 after a significant drop.
Bullish Scenario: For a reversal, SOL must reclaim and hold above the "220-224 Immediate Sup-port" and push past the "230" level (which was previously support), targeting "240 current Re-sistance".
Bearish Scenario (Immediate): If Solana fails to maintain the "220 to 224 Immediate Support" or gets rejected when attempting to retest the broken trendline from below, it would signal further bearish pressure, leading to a test of the "215 Key Support."
Bearish Scenario (Deeper): A confirmed breakdown below the "215 Key Support" would invalidate the recent bullish structure and likely lead to a deeper retracement towards the critical "200 to 205, Trend Change" zone, where a significant re-evaluation of the trend would be necessary.
Disclaimer:
The information provided in this chart is for educational and informational purposes only and should not be considered as investment advice. Trading and investing involve substantial risk and are not suitable for every investor. You should carefully consider your financial situation and consult with a financial advisor before making any investment decisions. The creator of this chart does not guarantee any specific outcome or profit and is not responsible for any losses incurred as a result of using this information. Past performance is not indicative of future results. Use this information at your own risk. This chart has been created for my own improvement in Trading and Investment Analysis. Please do your own analysis before any investments.
Descending channel, followed by a bullish flagSolana seemed to have stabilized again. Wondering if the bullish flag pattern will work out perfectly again. This all depends on BTCUSD and ETHUSD atm.

solana x binance coin Solana follow it Binance Coin on its journey to $1k
CRYPTOCAP:SOL vs. CRYPTOCAP:BNB

SOL/USD – Sideways Under Pressure🟠 Neutral bias below $232
Solana trades at $230, slightly below SMA200 ($232) with RSI near 41, signaling weak short-term momentum. Resistance stands at $235, support at $228.
📖 Keywords: #SOLUSD #Solana #AltcoinWatch #CryptoSetup

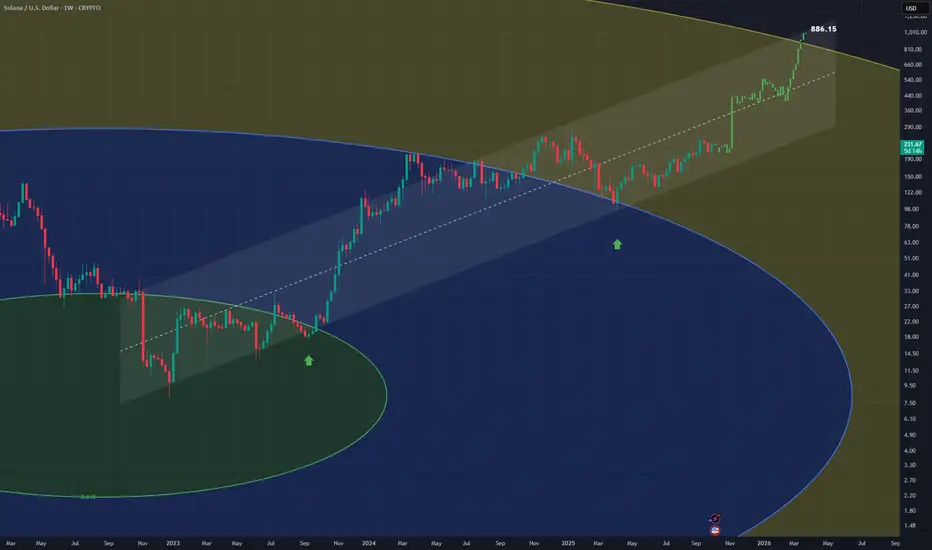
SOLUSD - Up Channel A sharp up channel has formed on solana's daily chart
im allowing further movement up as price bounces off the fib circle ring
bullish towards the top of channel