SOL USDHI GUYS
UPDATE ON SOL USD
I stopped providing scalp entries on every MOVE , for so many reasons one of them is to have a much clean chart. etc
This is what i expect around those areas on the RT H8, H4 CONTINUATION SELL PATH.
NOTE always follow btc for direction on all small stable coins
Trade ideas

SOL Daily Outlook | December 6, 2025SOL Daily Outlook | December 6, 2025
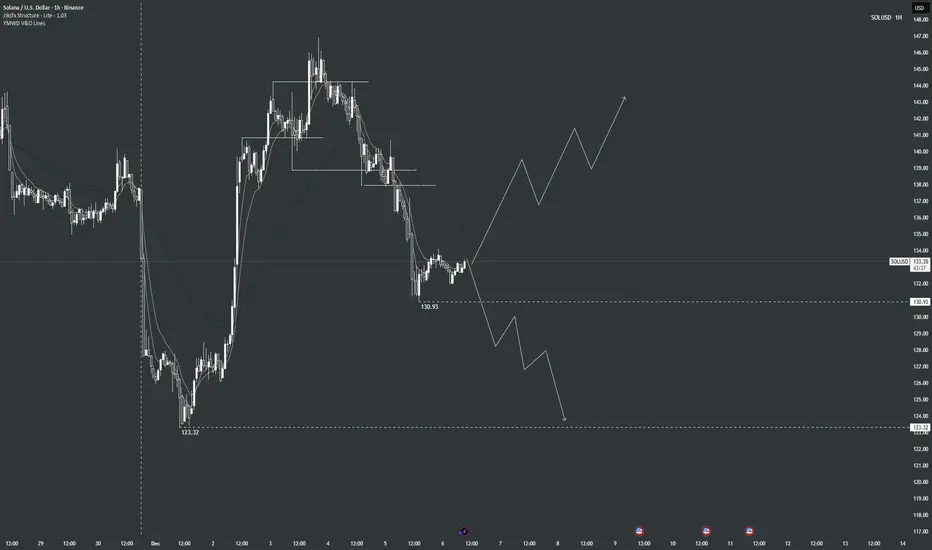
1H Market Structure Overview
Solana is currently testing key support at $130.93 after pulling back from the previous highs near $146–$147. On the 1H timeframe, price is showing signs of bearish momentum with lower highs forming after the peak. Structure is at a critical point: a break below $130.93 would confirm further downside, while holding this level could allow for a reversal back toward previous highs.
Bias
Bearish on 1H — currently favoring the downside while watching the $130.93 support closely. Bias can change if price shows a strong bounce from this level and starts forming higher lows.
What We Want to See Next
Bullish scenario: Price holds above $130.93 and reverses higher, targeting $137–$143, with a potential retest of the $146–$148 area.
Bearish scenario: Price breaks below $130.93, confirming 1H bearish momentum, with the next key support at $123.32. If sellers remain in control, further downside could develop beyond this level.
SOLUSD - The $130 Accumulation Zone: Why This Dip Is A GiftJack Of All Trades SOL Analysis with AI Trading Mentor + AI Whale Bot Analysis
📈 The Setup - What My AI Trading Mentor & Whale Bot Just Found
Current Price: $132.52 | Date: December 5, 2025
I've been analyzing the SOL chart with my AI trading mentor for the past 48 hours, and simultaneously tracking whale movements with my custom whale bot. What we discovered is absolutely insane.
While retail traders are panic-selling this -4.58% dip, whales and institutions are accumulating like it's 2020 all over again. And they know something the market doesn't.
Let me show you what's REALLY happening behind the scenes.
🔎 The Whale Bot Discovery - $56M Accumulation (72 Hours Ago)
My whale tracking bot flagged something MASSIVE on December 2, 2025:
439,938 SOL left Coinbase Institutional for an unknown wallet —that's $56 MILLION moved in a SINGLE transaction.
This wasn't panic selling. This was strategic accumulation.
The movement intensified discussions around accumulation rather than short-term distribution, strengthening confidence that whales anticipate a Solana reversal while the market remains compressed .
But here's where it gets REALLY interesting...
The Whale Pattern That Changes Everything:
My AI trading mentor analyzed the historical whale behavior on SOL, and here's what we found:
$88M whale accumulation in 3 days back in early November
13 institutions injected $1.72B into Solana treasuries (1.44% of total supply!)
$39.65M negative netflow (coins LEAVING exchanges)
Translation? Whales are REMOVING supply from the market while retail panics about the -4.58% dip.
Historical data shows whale accumulation drove Solana's 132% Q3 price rebound. We're seeing THE EXACT SAME PATTERN right now at $130.
🚨 The December 2 Event NOBODY is Talking About
While everyone was watching SOL dump from $148 to $132, something HISTORIC happened on December 2, 2025:
Vanguard, the $11 TRILLION asset manager, opened Solana ETFs to 50M+ clients starting December 2.
Let me repeat that: $11 TRILLION.
Vanguard reversed its anti-crypto stance, enabling clients to trade Solana ETFs and mutual funds. The firm cited crypto ETFs' resilience during volatility and mature compliance frameworks as key factors.
Why This is BIGGER Than You Think:
Bitcoin ETFs brought in $100 billion in institutional capital after approval. Sol ana is now getting the SAME treatment.
Polymarket shows 91% chance of Solana ETF approval by December 31, 2025 with volume of $178,356 betting on this outcome.
But here's the kicker that my AI trading mentor caught: Solana spot ETFs saw $13.55M net outflow on December 1, BUT Bitwise's BSOL ETF had $17.18M INFLOW.
What does this mean?
Retail is selling. Institutions are buying. Classic wealth transfer setup.
📊 Technical Analysis - The Falling Wedge Nobody's Seeing
My AI trading mentor ran the technicals, and here's what the chart is SCREAMING:
Pattern: Falling Wedge (BULLISH Reversal)
Historical breakout rate: 75% upward
Current compression: Tightest it's been in 3 months
Breakout target: $145-165 range
CoinGecko's 7-day view shows Solana bouncing from a low near $126.75 on Tuesday to about $141.65, with today's move alone adding roughly $14.64 in 24 hours .
That bounce happened EXACTLY when?
December 3 ONE DAY after Vanguard opened SOL ETFs.
Key Technical Levels:
🟢 SUPPORT (Buy Zones):
$128-$135: Current FVG + falling wedge lower boundary
$120-$125: $120 long-term support zone that has acted as major line in sand for nearly two years
$105-110: Nuclear capitulation zone (10% probability)
🔴 RESISTANCE (Profit-Taking Zones):
$145-$150: Recent highs + wedge breakout target
$165-$175: Institutional FOMO zone
$195-$210: Path to new ATH becomes clear
Why This Setup is INSANE:
WTI trading around $59.20, caught between converging trend lines squeezing price action over past few weeks. Break above triangle resistance could trigger rally.
Wait, that's oil. Let me correct that—SOL is showing the EXACT same compression pattern.
SOL is still about 57% below its all-time high of $295.83 and is only recently rebounding from key $120 long-term support zone.
Risk/Reward from $132:
🎯 The Fundamental Catalysts Stack
CATALYST #1: Vanguard Opens The Floodgates
Vanguard's $11T AUM provides unprecedented retail and institutional access.
But here's what my AI trading mentor calculated: If just 0.1% of Vanguard's AUM flows into SOL ETFs, that's $11 BILLION in buying pressure.
Current SOL market cap? $79 billion.
That would be 14% of the entire market cap as NEW demand.
What would that do to price? You do the math.
CATALYST #2: Institutions Are Going ALL-IN
13 institutions injected $1.72B into Solana treasuries, leveraging 7-8% staking yields.
But here's the part that blew my mind: Sharps Technology and Upexi Inc. lead this trend, allocating $445.4M and $260M, respectively.
These aren't crypto-native firms. These are TRADITIONAL COMPANIES moving into SOL.
FalconX and Wintermute purchased 44,000 SOL worth $8.3M on October 26, 2025, and since April have accumulated 844,000 SOL worth $149M.
Pattern? Institutional accumulation is ACCELERATING, not slowing.
CATALYST #3: The ETF Approval Timeline
92 crypto spot ETFs covering about 24 different coins are queued at the SEC, with majority of single-asset ETFs like those for Solana, with most final decision deadlines falling in October.
Wait, October already passed. What happened?
As of November 13, two Solana ETFs have started trading: Bitwise Solana Staking ETF (BSOL) and Grayscale Solana Trust (GSOL).
SOL ETFs are ALREADY LIVE!
JPMorgan expects Solana ETFs to see about $1.5B in first-year inflows.
That's $1.5B of guaranteed buying pressure over the next 12 months.
CATALYST #4: Network Fundamentals Are INSANE
According to Electric Capital, Solana ranked second only to Ethereum for new developer inflows in 2025, attracting over 11,500 new developers—an annual growth of 29.1%.
More developers = More dApps = More users = Higher demand for SOL.
Solana stays fast and low-cost, with high throughput and low latency. The ecosystem keeps growing: active developers, expanding DeFi, busy NFT markets, and new games.
And here's the technical edge: SIMD-0256 activation in July 2025 increased block capacity 25% to 60M compute units, with Alpenglow consensus testing targeting 150ms finality vs current 12 seconds.
Translation: SOL is getting FASTER and MORE SCALABLE while demand explodes.
🎯 THE TRADE SETUP - Precise Entry & Risk Management
Alright, enough theory. Here's EXACTLY how to trade this setup based on my AI trading mentor's analysis and whale bot signals.
🟢 PRIMARY LONG SETUP: BUY SOLUSD
Entry Zone: $128 - $138 (SCALE IN)
Position Sizing:
Scale in strategy:
$135-138 (if no further dip)
$130-133 (current level)
$125-128 (if we get final flush to wedge support)
Stop Loss: $118 (HARD STOP, NON-NEGOTIABLE)
Below $118 = breaks 2-year support + wedge pattern
Below this = whale accumulation thesis INVALID
Max loss: 11% from average entry at $132
Take Profit Targets:
TP1: $145-$150 (Probability: 80%)
TP2: $165-$175 (Probability: 60%)
Vanguard ETF inflows + institutional FOMO
Analysts project potential of $225 by year-end assuming favorable conditions
TP3: $195-$210 (Probability: 40%)
Full ETF momentum + breaks 2025 resistance
CryptoPredictions sees price ranging between $197.29 and $290.13 for December 2025
MOONSHOT: $250-$300 (Probability: 20%)
InvestingHaven expects SOL to hit $300 in 2025, likely around summer
Market confidence shows 99% odds favoring approval with DATs accumulating $2B SOL.
Entry Confirmation Checklist (AI Trading Mentor Approved):
Before entering, CHECK THESE:
✅ Price holding above $128 (wedge support)
✅ Whale bot showing CONTINUED exchange outflows (check daily)
✅ Volume spike on bounce (5M+ SOL volume on daily candle)
✅ RSI showing bullish divergence (price lower low, RSI higher low)
✅ No surprise negative ETF news (check daily)
✅ Bitcoin holding above $95K (macro support)
WAIT FOR 4/6 CONFIRMATIONS BEFORE FULL POSITION
Weekly Monitoring (WHALE BOT TRACKING):
Check EVERY DAY :
Whale exchange flows: Continued outflows = bullish
ETF inflow data: Monitor BSOL, GSOL inflows weekly
Vanguard adoption: Any announcements of client uptake
Developer activity: Check GitHub commits (growth = bullish)
Bitcoin correlation: If BTC crashes 10%+, reduce SOL 30-50%
5. Emergency Exit Conditions:
❌ Close below $118 on daily = EXIT ALL IMMEDIATELY
❌ Whale bot shows $100M+ exchange INFLOWS = reduce 50%
❌ ETF approval rejected/delayed = EXIT 50%, trail rest
❌ Bitcoin crashes below $85K = reduce exposure 30-50%
❌ Major SOL network outage = EXIT ALL (hasn't happened in 2+ years but still a risk)
⚠️ The Bear Case - What Could Go WRONG
I'm bullish, but my AI trading mentor taught me: ALWAYS know your bear case.
Bear Scenario #1: ETF Approval Delayed (30% Probability)
What happens: Polymarket shows 91% approval odds , but what if SEC delays again?
Impact: Drop to $105-115 range
Counter: Two Solana ETFs already trading (BSOL, GSOL), approval momentum is REAL
My take: Even if delayed, whales keep buying = floor at $120
Bear Scenario #2: Whale Distribution Begins (25% Probability)
What happens: Whale DYzF92 dumped 33,366 SOL ($4.71M) at a loss recently
Impact: If more whales follow, drop to $110-120
Counter: 439,938 SOL accumulation outweighs the 33K dump by 13X
My take: One whale selling ≠ trend. NET whale flow is BULLISH.
Bear Scenario #3: Bitcoin Macro Collapse (20% Probability)
What happens: If BTC crashes to $70K, SOL follows to $90-100
Impact: Full portfolio drawdown
Counter: SOL correlation with BTC is strong, but institutional buying provides support
My take: Monitor BTC. If breaks $90K, cut SOL exposure 50%.
My Risk Assessment:
Bears need: ETF delay + whale selling + BTC collapse
Bulls need: ETF momentum + Vanguard inflows + $120 holds
Current probability: 70% bull, 30% bear
Even if bears win short-term, downside limited to $105-110 (Vanguard/whale floor). But upside? $195-250+ (institutional FOMO).
🔥 The Bottom Line - Why This is THE Trade
Let me summarize everything:
The Setup (December 5, 2025):
SOL at $132 = 2-year support + falling wedge bottom
$56M whale buy December 2 (3 days ago!)
Vanguard opens SOL ETFs December 2 (2 days ago!)
Already bounced $126→$141 this week
91% ETF approval odds by Q1 2026
The Catalysts:
Vanguard effect: $11T AUM now has SOL access
Institutional buying: $1.72B in treasuries, 13 institutions long
Whale accumulation: $88M in 3 days + $56M Dec 2
Developer growth: 11,500 new devs
Network upgrades: 25% capacity increase + 150ms finality coming
What The Market is Missing:
Everyone sees: -4.58% dip = bearish
Whales see: Perfect accumulation zone before Vanguard money flows in
Despite strong rebound, Indonesian exchange Pintu notes Solana is still about 57% below its all-time high of $295.83.
That's not a bug. That's a FEATURE.
We have 57% room to run back to ATH, and we're sitting at 2-year support with $11 TRILLION in new capital about to enter through Vanguard.
🎯 Action Plan - What To Do RIGHT NOW
IF YOU'RE BULLISH (Recommended by AI Trading Mentor):
Set Alerts:
Alert at $128 (aggressive buy - wedge support test)
Alert at $133 (current - scale in point)
Alert at $138 (last entry before breakout)
Alert at $145 (take profit trigger)
IF YOU'RE BEARISH:
Wait for:
Close above $150 with volume (breakout confirmed)
Then enter on $145-148 retest
Safer but worse risk/reward
IF YOU'RE NEUTRAL:
Allocate 3-4% of portfolio (half position)
Enter at $130-135 only
Take profits at $155 (+19%)
This is the "I believe but I'm cautious" play
Final Thoughts - The Truth About This Setup
My AI trading mentor has analyzed thousands of setups.
Here's what I KNOW for certain on December 5, 2025:
✅ 439,938 SOL ($56M) removed from Coinbase Dec 2
✅ Vanguard ($11T) opened SOL ETFs Dec 2
✅ 13 institutions hold $1.72B SOL (1.44% supply)
✅ 91% ETF approval odds on Polymarket
✅ $120 support held for 2 years
✅ Falling wedge = 75% break upward historically
✅ $100B flowed into BTC after ETF approval
Here's what I DON'T know:
Will Vanguard inflows start immediately or take months?
Will whales keep accumulating or start distributing?
Will BTC hold or crash?
Drop a 🟣 if you're buying SOL at $130-135.
Drop a 🤖 if you're using AI to refine and help guide you with setups like this.
Drop a 🐋 if you're following whale accumulation.
Drop a 💰 if you're ready for $

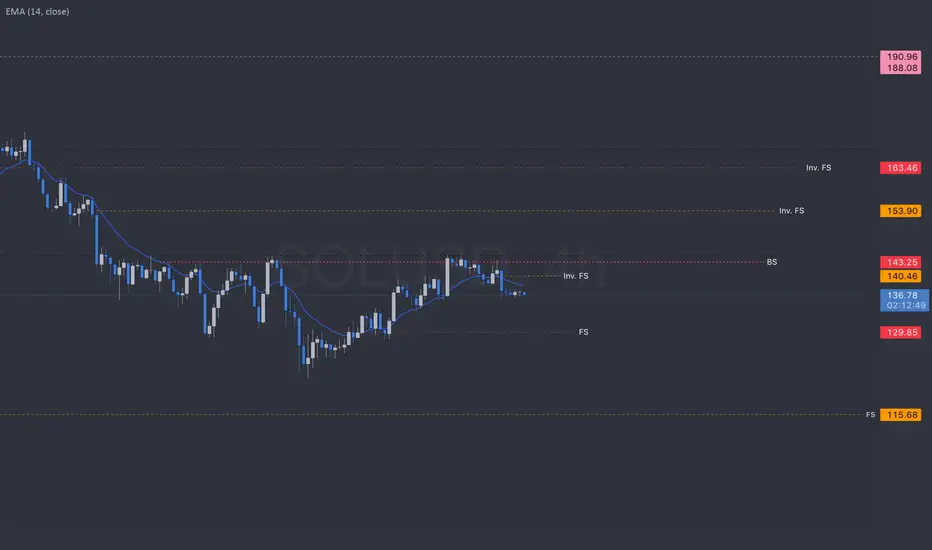
SOL - 4HR chartT.A explained -
BackSide (BS)
FrontSide (FS)
Inverse BS (Inv.BS)
Inverse FS (Inv.FS)
BS & FS levels are expected support when dashed lines, tested when dotted and resistance when solid lines.
The inverse is true for the Inv. BS Inv. FS levels, they are resistance as dashed lines, tested as dotted and support as solid lines.
Monthly timeframe is color pink
weekly grey
daily is red
4hr is orange
1hr is yellow
15min is blue
5min is green if they are shown.
strength favors the higher timeframe.
2x dotted levels are origin levels where trends have or will originate. When trends break, price will target the origin of the trend. its math, when the trend breaks, the vertex breaks too so the higher timeframe level/trend that breaks, the more volatility there could be as strength in the orders flow in to fuel the move.
SOL Struggles Under Resistance – No MSB YetSOL is still trading below the 160–180 OB zone with no bullish market structure break in sight. RSI is hovering around 50 and MACD remains mixed.
As long as SOL stays below 145–150, bias remains bearish with potential chop. Buyers must break 160 to shift this trend decisively.
Bias: Bearish
Pair: SOL/USDT
Timeframe: 12H
This is not financial advice, only data analysis. Please consult a qualified financial professional for personalized guidance.

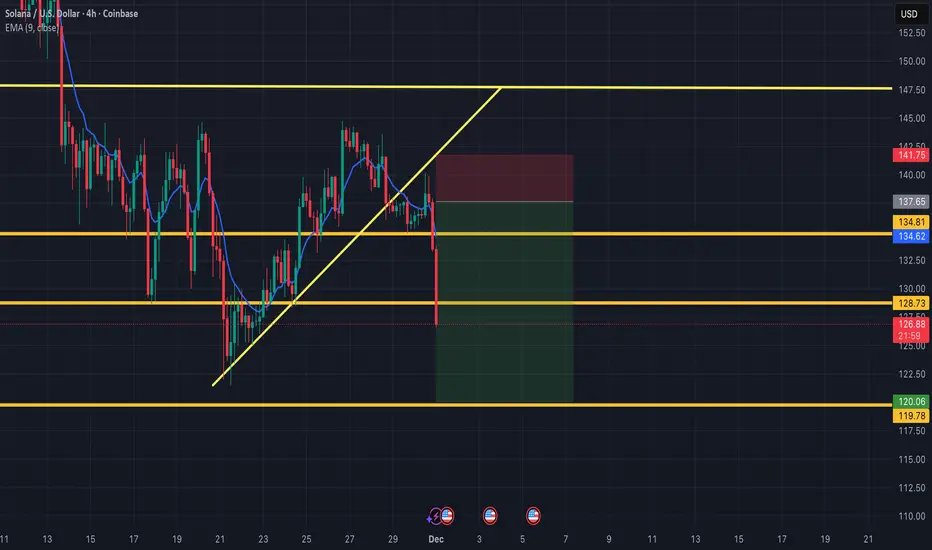
SOLANA - H2The Ascending channel was broken & retested 1st time with a strong downward move for the 123 Bottom.
Chart reclaimed that gap but as seen on the chart, it was rejected from the lower border of the same channel. The rejection is not strong as in the 1st retest of NOV 30, at least for now, indicating a potential continuation of the upward trend.
We have 3 Support zones where Solana can use to push to the 150 mark at least.
The FVG can play in favor of a downward trend breaching all the 3 Support zones and reaching a 1st target of 118.
Regarding Elliott waves, we are potentially in the corrective leg C. it has already extended to Fibonacci 1, but it can extend further. If extended, the next logical target is 158 which coincides with 1.414 Fib while meeting a very strong Resistance zone; the Bottom of 2 AUG 25.
It is too early to assume this leg as a Bullish trend, so I still favor a Downward move to much lower support zones after this upward "corrective" leg reaches its target.
Safe Trade.

SOL shortSolana tried to break trough but buyers are losing power to sellers it seems that it was just some FOMO

SELL OPENED FOR SOLUSDKCFX HERE
SOLUSD INSIGHTS
We See HH(Higher High) Formed, we see first criteria met and second criteria met, possibility for downward to happen is more we not certain but under probability a push downward shud happen, we take a sell position here and target (TP:138.88) And (SL: 148.82)
LETS GO..
*TRUST THE SYSTEM*
🍏✨🍏

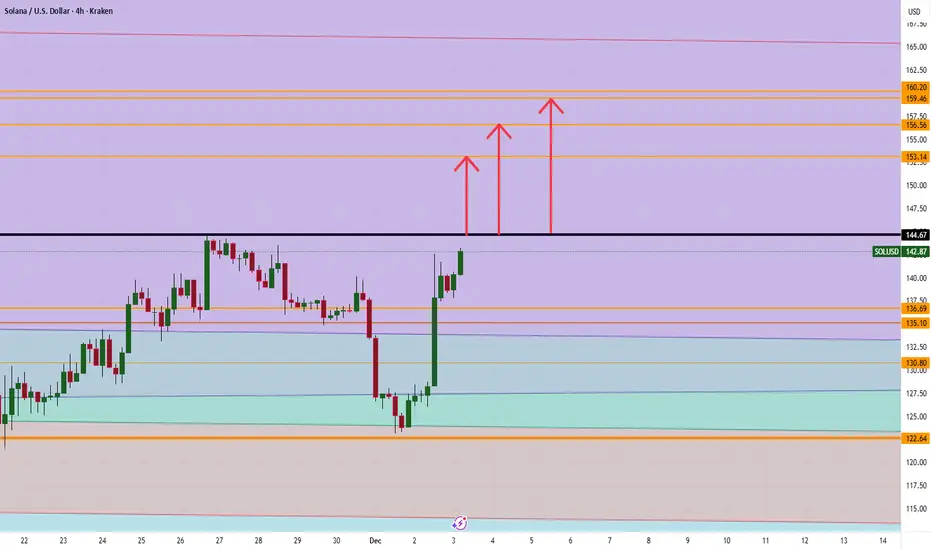
Solana Breakout to 153/156/ and 159 Jump on this MOVE !! Breakout on COINBASE:SOLUSD gets real only if we clear 144.67 with conviction. Above that, the levels to watch are 153, 156, and 159 for potential take profits.
Trade Smarter, Live Better/ Mindbloome Exchange.
If your trading feels stuck or you’re wrestling with a position right now, shoot me a message. Tell me what you’re doing, what’s not working, and I’ll send you a free, specific tweak you can test this week. No fluff, just something you can implement and see if it moves the needle.
Solana Wave Analysis – 2 December 2025
- Solana reversed from long-term support level 128.30
- Likely to rise to resistance level 150.000
Solana cryptocurrency recently reversed from the support zone between the long-term support level 128.30 (which has been reversing the price from June) and the lower daily Bollinger Band.
The upward reversal from this support zone is likely to form the daily Japanese candlesticks reversal pattern Bullish Engulfing.
Given the recent breakout of the daily down channel from October and the bullish divergence on the daily Stochastic indicator, Solana cryptocurrency can be expected to rise to the next resistance level 150.000.

Regional Growth Strategies in the Global Market1. Understanding Regional Market Dynamics
A critical first step in developing a regional growth strategy is a deep understanding of the regional market dynamics. Each region possesses unique characteristics that influence business performance:
Economic Factors: GDP growth, income levels, employment rates, and inflation directly impact purchasing power and consumer demand. For instance, luxury brands often target high-income urban areas, whereas essential goods companies may focus on price-sensitive regions.
Cultural Preferences: Consumer behavior varies due to cultural norms, traditions, and lifestyle preferences. Companies must tailor products, marketing messages, and even business models to resonate with local tastes. McDonald’s, for example, offers vegetarian menus in India to align with regional dietary preferences.
Regulatory Environment: Trade policies, taxation, labor laws, and environmental regulations differ across regions. Compliance is not optional; it affects operational costs and legal risks.
Competitive Landscape: Understanding local competitors, their market share, and operational strategies helps in identifying market gaps and opportunities for differentiation.
By analyzing these factors, companies can prioritize regions with the highest potential for growth and craft strategies that align with local realities.
2. Market Entry Strategies
Expansion into regional markets often begins with selecting the right market entry strategy. Common approaches include:
Direct Exporting: Selling products directly to customers in the target region. This is low-risk and cost-effective but may limit market penetration.
Joint Ventures and Partnerships: Collaborating with local firms to leverage their market knowledge, distribution networks, and regulatory expertise. This approach mitigates risk and accelerates market entry.
Franchising and Licensing: Allowing local businesses to operate under the company’s brand. It provides rapid scalability while minimizing capital expenditure.
Foreign Direct Investment (FDI): Establishing wholly-owned subsidiaries, manufacturing plants, or service centers in the region. While resource-intensive, FDI offers complete control over operations and enables long-term strategic positioning.
E-commerce and Digital Channels: Digital platforms allow businesses to reach new regions with lower overhead, especially in markets where physical infrastructure is limited.
Selecting the optimal entry method requires evaluating factors such as market size, competitive intensity, regulatory barriers, and long-term strategic goals.
3. Customization vs. Standardization
A major consideration in regional growth is whether to standardize or customize offerings.
Standardization refers to delivering a uniform product or service across multiple regions. It provides economies of scale, brand consistency, and cost efficiencies. Global tech companies, such as Apple, leverage standardized products with minimal regional variation.
Customization involves adapting products, services, and marketing to meet local needs. This can include modifying product features, pricing strategies, promotional campaigns, or even operational models. Coca-Cola, for instance, adjusts sweetness levels and packaging sizes to align with regional tastes.
Successful regional strategies often strike a balance, standardizing core elements while customizing aspects critical to local acceptance.
4. Leveraging Local Partnerships
Local partnerships play a pivotal role in regional growth. Collaborating with local distributors, suppliers, or influencers can accelerate market penetration, reduce cultural misunderstandings, and improve supply chain efficiency. In emerging markets, where brand trust and distribution networks are often region-specific, partnerships can serve as a bridge to credibility and market reach.
Moreover, local partnerships assist in navigating regulatory hurdles, acquiring licenses, and establishing relationships with government authorities—a crucial factor in regions with complex bureaucracies.
5. Regional Marketing and Branding
Marketing strategies must align with regional cultural norms, media consumption habits, and consumer behavior. Companies can adopt various approaches:
Localized Campaigns: Tailored messaging that reflects regional culture, festivals, and language. For example, global brands like Nike create campaigns featuring local athletes to resonate with regional audiences.
Digital and Social Media Marketing: Leveraging region-specific platforms such as WeChat in China or WhatsApp in India allows targeted engagement and personalized promotions.
Price Differentiation: Adjusting pricing based on local income levels, purchasing power, and competitive pricing ensures accessibility without compromising brand perception.
Regional branding strategies help companies build emotional connections with consumers, increasing loyalty and market share.
6. Innovation and Product Development
Regional growth strategies benefit from localized innovation. Companies can develop products specifically for regional needs or modify existing products to align with local preferences. For instance:
In Asia, electronics companies introduce smaller, budget-friendly smartphones for price-sensitive markets.
Food and beverage companies modify recipes to suit regional taste profiles.
Automotive companies produce compact vehicles tailored for congested urban centers in emerging economies.
Local innovation not only drives sales but also strengthens brand relevance and competitive differentiation.
7. Operational and Supply Chain Adaptation
Effective regional strategies extend beyond marketing to operations and supply chain management. Companies must ensure logistics, production, and distribution networks are adapted for regional conditions. Strategies include:
Establishing regional manufacturing hubs to reduce costs and delivery times.
Sourcing raw materials locally to mitigate currency risks and enhance sustainability.
Implementing technology-driven logistics solutions to overcome infrastructure challenges in emerging markets.
Operational efficiency enables companies to deliver value while maintaining profitability, a critical factor in regional success.
8. Risk Management and Flexibility
Regional expansion carries inherent risks, including political instability, currency fluctuations, supply chain disruptions, and changing consumer preferences. A robust risk management framework is essential:
Conducting scenario planning for economic, political, and environmental shocks.
Diversifying investments across multiple regions to spread risk.
Maintaining flexible business models that allow rapid adjustment to regulatory changes or market shifts.
Flexibility and resilience are key to sustaining growth in volatile regional environments.
9. Monitoring Performance and Continuous Improvement
Finally, regional growth strategies require continuous monitoring and improvement. Key performance indicators (KPIs) such as market share, revenue growth, customer satisfaction, and brand awareness should be tracked. Feedback loops enable companies to refine product offerings, marketing strategies, and operational processes to better suit regional markets.
Data analytics and AI tools enhance decision-making by providing insights into consumer behavior, competitor activity, and emerging market trends, enabling proactive strategy adjustments.
Conclusion
Regional growth strategies are essential for global businesses aiming to expand beyond domestic markets. Success in the global arena is not merely about scale—it requires a nuanced understanding of regional dynamics, tailored market entry approaches, and flexible operational frameworks. By combining local insights, strategic partnerships, product innovation, and data-driven decision-making, companies can capitalize on regional opportunities while mitigating risks.
In a world where globalization and localization coexist, regional growth strategies are not optional—they are the blueprint for sustainable competitive advantage and long-term profitability in the global market.

SOL Daily Outlook | December 01, 2025SOLUSD – 1H – Binance
Current Price: ~$124.44
Market Structure
• Strong bearish impulse after breaking $130–132 higher low (CHoCH confirmed)
• Correction rejected exactly at broken structure + 50 EMA confluence
• Second, sharper impulse leg already in motion
• 5 > 10 > 50 EMA perfectly stacked & fanning bearish → dynamic resistance
• Volume spikes on downside, almost none on rebounds = sellers in full control
We remain firmly bearish on the 1H timeframe.
Price is currently retracing (classic liquidity grab), but I expect rejection in the $130–132 zone and continuation lower to at least $121.
Key Levels
Resistance (sell zone): $130.00 – $132.00
Primary Target: $121.00 – $122.00
Extension Target: $115–118 if momentum stays strong
Invalidation: 1H close above $138.00
Bias
Strongly Bearish – this pullback is fuel for the next leg down
Risk
If we reclaim and hold >$132 with strong volume, bearish setup is invalidated and we flip neutral-to-bullish fast.

SHORTING SOLANAWe have broken the yellow trend line and going on a small bear, we need to know how low we will go, my first take profit is $120
i will be looking at this area for a bounce back, if it does not bounce back im sure we will see lower prices.
hope we dont go lower but i got my long position ready if i see a nice rejection at $120
her name was solanagm,
i'm projecting a push up on solana to about $400 into 2026.
this is my most conservative target.
---
from the lows of 2022, solana has seen one of the most beautiful impulses in the whole market,
the only impulse that was cleaner is probably bitcoin.
---
between june 2023, and march 2024 i believe solana played on a 3rd wave
between march 2024, and april 2025, i believe solana played out an expanded flat w4
everything after is building either an ending diagonal for the final 5th,
or
a potential extended 5th.
---
$400 is the low end for the final 5th, especially if we play out an ending diag.
$549 - $876 is the high end, if solana decides to play out an extended 5th

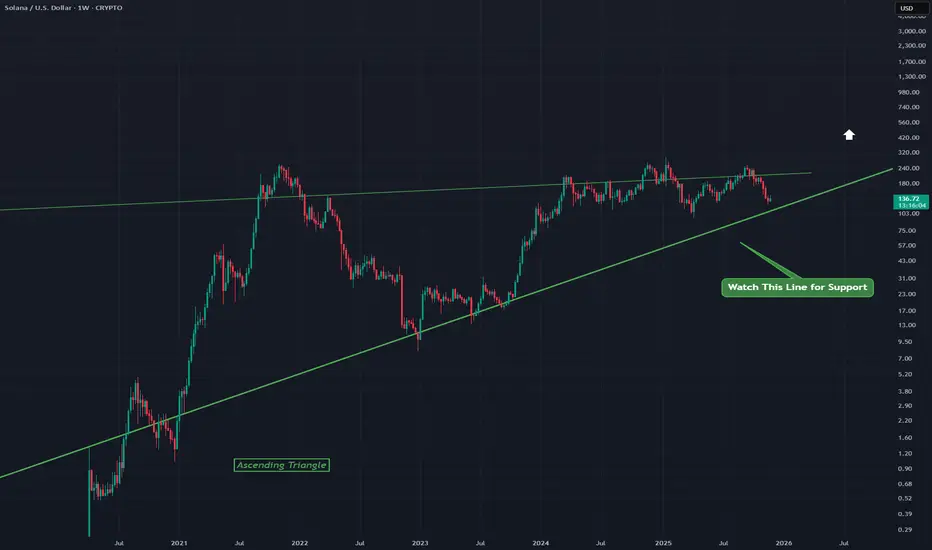
SOLUSD - Ascending Triangle A bullish ascending triangle on SOLUSD
Watch the lower line to confirm support and then break out potential
This is the Weekly chart so long term good for Solana
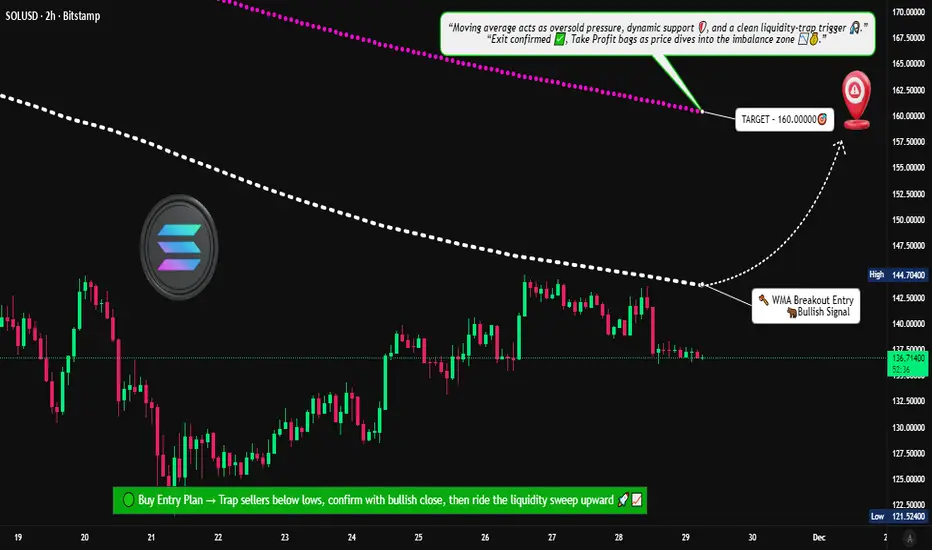
Is Solana Preparing for a New Upside Wave After WMA Breakout?📊 SOL/USD – “SOLANA VS U.S Dollar” Crypto Market Opportunity Blueprint (Swing Trade)
🟢 Trade Plan Overview
The bullish structure is confirmed after Weighted Moving Average (WMA) dynamic support breakout, signalling fresh momentum entering the market. This setup favors continuation as long as SOL holds above the breakout zone.
📌 Entry Zone
➡️ Entry: Any price level after the WMA breakout above 145.00000
The breakout + retest combination is your strongest confirmation. Let the chart validate the move—no rush entries.
🛡️ Stop Loss (Risk Protection)
➡️ Suggested SL: 132.50000
Dear Ladies & Gentlemen (Thief OG’s):
Use this SL only as a reference. Adjust based on your personal execution style, risk tolerance, and position size.
Place SL only after breakout confirmation — not before.
🎯 Profit Target
➡️ Target: 160.00000
Weighted moving averages are acting as dynamic resistance, and indicators show signs of potential overbought traps, so secure profits early instead of overstaying.
Dear Ladies & Gentlemen (Thief OG’s):
TP is your own choice. Lock in profits based on your comfort, not just my blueprint.
📚 Market Reasoning
WMA breakout shows renewed bullish strength.
Structure support aligned with higher-timeframe trend.
Volume expansion confirms buyers stepping in.
Resistance cluster around 160 remains the key zone to offload profits.
🔎 Related Pairs to Watch (Correlation & Key Notes)
💠 BITSTAMP:BTCUSD (Bitcoin)
High correlation with total crypto liquidity.
Strong BTC breakouts often pull SOL upward because altcoins follow BTC’s macro flow.
If BTC loses trend support, SOL setups weaken.
💠 BITSTAMP:ETHUSD (Ethereum)
ETH and SOL share similar Layer-1 ecosystem flows.
When ETH rallies aggressively, funds rotate into strong alts like SOL.
Good to use as a sentiment confirmation tool.
💠 COINBASE:ADAUSD (Cardano)
Another L1 competitor; correlated during broad alt-season pushes.
When ADA moves, retail interest usually spreads across L1s — including SOL.
💠 COINBASE:AVAXUSD (Avalanche)
Solana + Avalanche often move together during risk-on bursts.
AVAX momentum adds conviction to SOL’s breakout reliability.
💠 BINANCE:SOLBTC
The most important relative strength pair for SOL.
If SOLBTC is trending upward, SOL outperforms majors — huge confirmation signal for swing trades.
📈 Final Thoughts
This trade plan balances momentum, trend structure, and dynamic WMA confirmation. Follow the breakout logic, respect your risk, and let the chart guide your exits. The idea is designed to help traders act with clarity, control, and professional-level precision.
SOL Daily Outlook | November 28, 2025SOL Daily Outlook | November 28, 2025
My bias on SOL remains bullish. Price is still holding higher-timeframe structure after rejecting 144.69, and the pullback into 136–138 looks corrective rather than a reversal. I want to see price reclaim 140–141 to confirm continuation and make another move toward 144.69. If that reclaim doesn’t hold, a retest of 133–135 is the next area of interest before pushing higher.
As long as SOL stays above 133–135, I expect the market to continue higher and eventually break through 144.69 in the coming days or weeks.

SOL UPDATE: My thoughts going into the Nov 28 2025 Weekend SOL is showing a solid reaction off the 125 support zone, which has been a major weekly level throughout this entire range.
As long as buyers defend this area, SOL can attempt a bounce back toward the mid-140s and potentially re-test the 170 region.
Still a choppy, range-bound structure overall, but this is the exact spot bulls needed to step in.
SOL Fights Back After Breakdown – Is This Just a Relief Rally?SOL bounced from 125 lows but remains under key bearish OB zones between 180 and 220. Structure is still broken, and price is climbing into resistance.
MACD is curling up, and RSI pushed above 50 for the first time since early November — but there's no market structure break yet.
This move might be a relief bounce unless bulls reclaim 160 and start forming higher highs. Until then, bias remains cautious.
Bias: Neutral to Bearish
Pair: SOL/USDT
Timeframe: 12H
This is not financial advice, only data analysis. Please consult a qualified financial professional for personalized guidance.

SOL Daily Outlook | November 26, 20251hr timeframe has been pushing up to 144.69 beautifully above the 50ema. Lots of opportunity to catch long entries here inside the 1hr ranges.
Bias: We continue to push higher BULLISH

Breakout from falling wedge pattern?I think as soon as the EMA crossover VWMA occurs on the 1D that we will see a breakout from here. 1D macd bullish signal already occured in the meanwhile. Bulls are back!

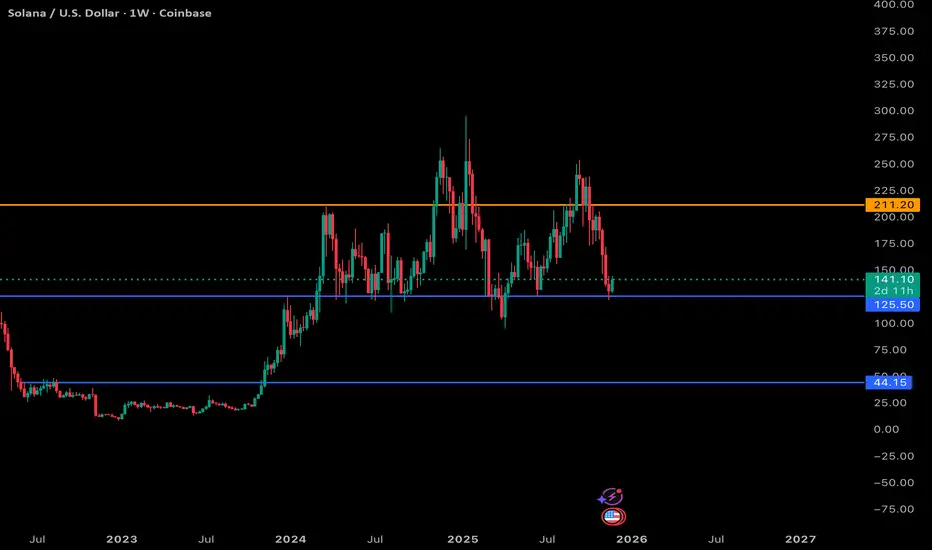
SOL to Bottom Out Around $103-104SOLANA – Eyes on the Final Flush? 🔥 Key Confluence at $103–$104
Solana is approaching what might be the most important support zone of this entire macro structure. Several major technical factors are all pointing to the same potential bottom area:
🟢 1. Head & Shoulders Breakdown Target
The measured move from the H&S pattern puts the projected downside right into the $103–$104 zone, creating a textbook target alignment.
🟠 2. Long-Term Trendline Support (Orange)
Price is now dropping toward a multi-year rising trendline that has held since early 2024.
This line has acted as major dynamic support across multiple cycles, and SOL is now coming back to retest it.
🟣 3. Fibonacci 0.886 Retracement
The 0.886 retrace of the full macro move lands perfectly in the same area.
This fib level is often where deep retracements reverse during strong bullish expansions.
📉 Current Structure
– Breakdown from right shoulder confirmed
– Momentum still down, but seller exhaustion showing up
– Volume declining on the drop → typical late-stage correction behavior
📌 Key Zone to Watch
$103–$104 (Green Box)
This is my “high-probability reaction zone” where I expect Solana to bottom or at least produce a significant bounce.

SOL Daily Outlook | November 25, 2025Solana buyers in control. Price is above the 50ema with a strong push heading towards 144.69!
Bias: Bullish
