SOLA short trade (learning to read the charts). Advices welcomeMy graphs are for learning only, I have a long way to go but I will follow my gut with what I learned.
If there is a big mistake or something i missed please let me know :).
Trade ideas

SOL USDHI GUYS,
Whenever i post Btc usd , i also trade a few alt coins like DOGE USD,
ADA USD,
SOL USD
I expect sells on candle close a few minutes from now.
NOTE. These pairs respect and follow BTC.

Global Interest Rate Trends (Fed, ECB, BOJ, BOE)1. Why interest-rates matter
A central bank’s policy (or “policy rate”, the rate at which it lends to or charges on banks) is one of the most important levers in its monetary-policy toolkit. By raising interest rates, a central bank can make borrowing more expensive, slow spending, dampen demand and thus help reduce inflation. By lowering rates, it can stimulate borrowing, spending and investment — supporting growth when the economy is weak.
Because economies are open and interlinked, the interest-rate decisions of one major central bank can ripple through global financial markets via currency, capital‐flows, trade, investment and inflation expectations.
Given the inflation surge in many economies during 2021-23 (linked to supply-chain disruptions, pandemic responses, energy-price shocks, etc.) many central banks shifted gears sharply. Let’s examine what happened region by region.
2. The U.S. – Fed
What happened
The Fed’s main policy mechanism is the federal funds rate (overnight rate banks charge one another).
In response to rising inflation, the Fed embarked on a large rate-hiking cycle during 2022 and early 2023. For example: the target rose to around 4.25-4.50% in December 2022.
More recently (2024-25) the Fed has begun to move into a more cautious stance: holding rates steady, signalling possible cuts, and factoring in weaker labour markets and inflation which is easing.
Why
High inflation meant the Fed needed to tighten policy: raising rates reduces demand and helps bring inflation back toward target.
But raising rates has costs: increased borrowing costs, pressure on consumers and firms, risk of economic slowdown. The Fed must balance inflation control with growth and employment (its dual mandate).
Because inflation has declined from its peaks, and growth has shown signs of moderation, the Fed is increasingly considering when (and how fast) to ease rates rather than only focusing on further hikes.
Implications
The U.S. rate path matters globally: when the Fed raises rates, it raises global funding costs and strengthens the dollar, which can hurt emerging markets or trade partners.
Markets now watch closely for Fed signals on cuts, because a transition from hiking to easing is meaningful for all asset classes (bonds, equities, currencies).
As of late-2025 the Fed’s policy rate is around 4.00%.
3. The Euro-area – ECB
What happened
The ECB’s policy rate (e.g., deposit facility rate) peaked after the inflation surge (in 2023) and then began to be trimmed. For example, one report says the ECB initiated rate cuts in June 2024 after holding rates steady for some time.
As of 2025 the ECB’s rate is about 2.15% (per one data table) though that may slightly lag current decisions.
Why
The Euro-zone economy has been weaker relative to the U.S., with inflation pressures starting to ease and growth concerns creeping in (including from the war in Ukraine, energy shocks, supply disruptions) – so the ECB had both inflation to worry about and growth softness.
Once inflation began to come down, the ECB felt able to begin easing earlier than some peers. However, it emphasised that rates would remain “sufficiently restrictive” for as long as needed.
Implications
Because the ECB began cuts ahead of some other major central banks (e.g., the Fed) it has driven a divergence in interest-rate policy between Europe and the U.S.
That divergence has implications for the euro-dollar exchange rate, export competitiveness in Europe, and how capital flows respond to the relative attractiveness of the euro-zone vs. the U.S.
Lower rates in the euro-zone can help support growth and relieve borrowing costs, but if the divergence becomes too large it could put pressure on the euro and import inflation.
4. The United Kingdom – BoE
What happened
The BoE’s Bank Rate famously rose during the inflation wave; for example, the Bank Rate reached 5.25% around August 2023.
More recently the rate has been brought down somewhat — for instance, it was cut to around 4.00% by November 2025.
Why
The UK experienced high inflation in the post-pandemic period, driven by energy/commodity shocks, supply constraints, labour constraints etc. So the BoE tightened aggressively.
As inflation began to moderate and growth concerns grew (especially with the UK’s unique mix of domestic and external shocks), the BoE shifted toward modest rate cuts or rate holds — trying to tread a fine line between inflation control and growth support.
Implications
The UK being a smaller, open economy relative to the U.S. means that rate decisions can influence the pound, capital flows (especially into London financial markets), and how UK growth holds up in a global slowdown.
For borrowers in the UK (mortgages, consumer debt) the cost of borrowing tends to follow Bank Rate closely, so higher rates have had visible impacts on households and firms.
The BoE’s choices also take into account not only inflation but also the strength of domestic sectors (financial services, housing, exports), the currency, and global spill-overs.
5. Japan – BoJ
What happened
For many years Japan had ultra-low to negative interest rates, as the BoJ battled deflation and weak growth.
In March 2024, the BoJ ended its negative interest-rate policy (NIRP) and raised its overnight rate from around -0.1% to 0-0.1% (its first rate hike in 17 years).
This marks a shift toward “normalising” policy (though rates remain very low compared to other advanced economies).
Why
Japan’s economy had long struggled with deflation or very low inflation, so the BoJ kept policy ultra-accommodative for a long time.
With inflation rising globally and domestically, and the yen weakening significantly, the BoJ signalled a move to exit the ultra-low/negative rate regime.
But Japan still faces structural challenges: high public debt, demographic headwinds, modest growth, which means the BoJ remains cautious.
Implications
Japan’s policy shift matters globally because Japanese investors and financial institutions are major players in global capital markets; changes in Japanese rates/currency affect cross-border flows.
A “last major central bank” to normalise means the phase of ultralow or negative rates worldwide is ending — which has implications for bond yields, global risk premiums, and asset valuations.
For Japan’s economy, the move suggests the BoJ is increasingly confident about inflation reaching target, but any further hikes will depend on sustained domestic wage/inflation momentum.
6. The overall trend & divergence
Broad trend
Following the inflation shock of 2021-22, most major central banks moved into tightening mode: raising policy rates aggressively.
With inflation now easing (though unevenly) and growth risks increasing (especially in Europe and Japan), many central banks are either pausing on hikes or beginning to ease (cut rates).
However, the timing, pace, and magnitude of both tightening and easing differ significantly among the major central banks, creating policy divergence.
Divergence: Why it matters
When one major central bank cuts while another holds or hikes, it affects relative interest-rates, which influence currency values, international capital flows, and trade competitiveness.
For example: the ECB started cutting while the Fed held rates higher for longer — meaning euro-zone borrowing costs fell relative to the U.S., impacting bond yields, equity valuations, and currency markets.
Divergence also complicates global financial conditions: for borrowers, savers, and investors across borders, the landscape becomes more complex.
Risks
Inflation rebound risk: If a central bank cuts too early, inflation might rebound, forcing another hiking cycle — which hurts credibility and causes turbulence.
Growth slowdown risk: If rates remain high too long, growth could falter or a recession could arrive. Central banks are balancing this carefully.
Spill-overs and coordination: Because global markets are integrated, policy decisions in one region spill into others (via currencies, capital flows, commodity prices). For example, U.S. policy is often referenced by other central banks.
7. What this means for you (and for India/global economy)
For borrowers (businesses, households) higher policy rates mean higher interest costs for loans/mortgages; if rates begin to fall, borrowing becomes cheaper.
For savers/investors: higher rates typically make saving more attractive (though other factors like inflation matter), and bond yields rise; lower rates reduce yields and push investors toward riskier assets.
For emerging markets (including India): the global interest-rate environment matters a lot. If the Fed is high or hiking, capital tends to flow to the U.S., currencies of emerging markets can weaken, cost of external borrowing rises. If global rates ease, that can ease conditions for emerging markets.
In trade and currency: if your country’s interest rates diverge from those of major economies, it can affect exports/imports, exchange rates, inflation (via import costs) and competitiveness.
For inflation and growth in your country: since global commodity/energy prices, supply chains, and global demand all influence domestic inflation and growth, central-bank policy abroad matters to you indirectly.
8. Summary & takeaway
In short:
After the pandemic, global inflation surged; central banks responded by raising policy rates.
The U.S. Fed raised quickly and to relatively high levels; the ECB and BoE also raised but faced additional growth/headwind concerns. Japan stayed ultra-low for much longer.
Now (2024/25) many central banks are shifting toward pausing or cutting rates as inflation eases and growth slows — but the timing and extent differ across countries.
These differences (divergences) matter globally: they affect currencies, capital flows, trade and financial markets.
For individuals, businesses and policymakers, keeping an eye on these major central-bank paths helps anticipate borrowing costs, investment yields, exchange‐rate risks and macroeconomic conditions.

SOL/USD Spot Long! 11-17-2025 RSI way Oversold with Bullish Divergences on Multiple Timeframes!
Fibonacci Golden Pockets!
Potential for High Profits!
Enter at Own Risk!
Killer Whale Warning!
Extreme Volatility!

$SOLANA ABC to 47 to 37 SOLANA Analysis Weekly elliott wave ABC
Abc pattern A wave done b bounce now started C wave target to 47 37

SOLUSD Bullish Bat Pattern Thesis – 4H & DailyI'm monitoring SOL for a potential bullish Bat harmonic reversal pattern developing on both the 4H and Daily timeframes. The Bat pattern is a high-probability harmonic formation that can signal trend exhaustion and a reversal, especially when confirmed at the D leg, which typically completes between the 0.886–0.9 retracement of the X-A move.
4H Chart
Structure: The price is currently correcting after a local top, with recent lower lows forming potential A, B, and C legs in sequence.
Key Bat Levels:
X-A: Local swing high to low, establishing the pattern's root.
A-B: Retrace to ~0.382–0.5 of X-A.
B-C: Moves higher, ideally hitting around 0.382–0.886 of A-B.
C-D: Final leg down, targeting the 0.886 retracement of the X-A origin.
Criteria:
Watch for a bullish reaction in price and supporting indicators (volume spike, bullish candle formation, positive divergence) at/near the 0.886 retracement.
Confirmation from order flow or divergence indicators adds confluence.
Daily Chart (D)
Pattern Fractal: The Daily shows a broader corrective move that could echo the 4H pattern, with a larger-scale Bat formation possibly in play.
Entry/Trigger Level: The ideal buy zone is at or just below 0.886 of the key X-A swing.
Risk Controls: Set stop losses slightly below X to minimize risk if the harmonic invalidates.
Targets:
Initial: Return to point C (~0.5–0.618 retracement of A–D)
Ultimate: Approach point A swing high for full pattern completion.
Thesis & Market Context
SOL remains structurally bullish on higher timeframes despite the local correction.
Bat completions often coincide with liquidity sweeps and value zones, strengthening the reversal thesis.
If D completes as drawn, expect a rapid reaction as short liquidation and fresh bids enter the market.

SOL/USDNasty H&S.
My guess, another bull trap on Solana up to $180ish, then vertically down to ~$10.
Thinking market is too much fear presently. We need to go back to complacency, which we should achieve by another record high on SPX this week...

$SOL is still in a heavy downtrend toward the lower targetsCRYPTOCAP:SOL is still in a heavy downtrend toward the lower targets that I mentioned in my previous analysis.
126 and 95 are the next targets.

Falling wedges: Are you convinced now about what's to come?Yes, we are still in a downtrend, but this is not the first time this happens. Maybe this chart will convince you why.
The upcoming two weeks will become very important on what's next for COINBASE:SOLUSD : will a breakout occur on this last falling wedge just like previous times?
I think it will.

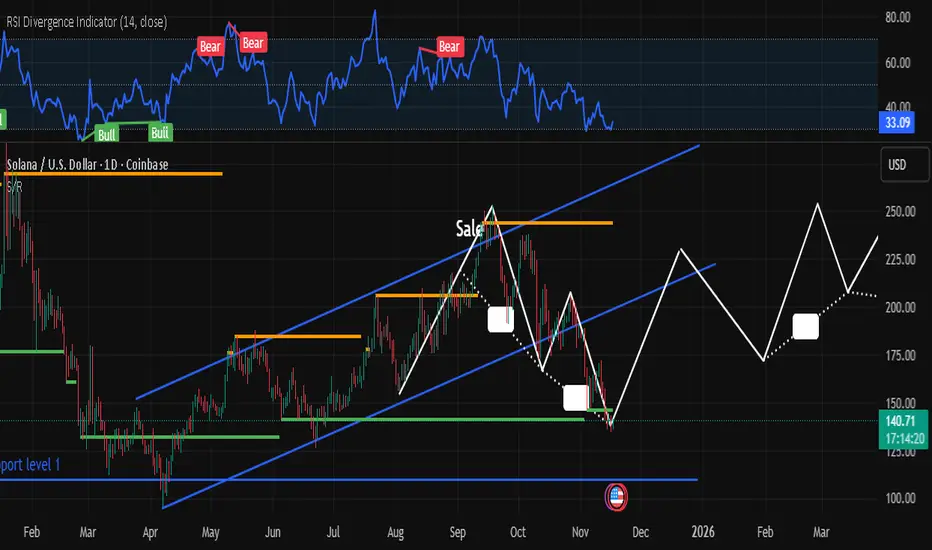
Solana – Daily Chart AnalysisSolana is currently holding around $140 after a sharp correction from the upper channel resistance. Price is testing a key ascending trendline and horizontal support zone near $135.
📉 RSI at 32.76 signals oversold conditions, watch for potential bullish reversal setups.
🔮 Possible Path Ahead (White Projection):
• Bounce to $180 → Consolidation
• Breakout toward $240
• Target zone: $280–$300 by mid-2026
(based on channel re-entry and momentum recovery)
❗If support fails, next major demand zone sits around $100–$110.
📊 Watching closely for confirmation of trend reversal.
Systematic Risk Explained in the Global Market1. What Is Systematic Risk?
Systematic risk refers to the risk that is inherent to the entire market or financial system. It reflects the vulnerability of the global economy to macro-level events that investors cannot avoid. It affects:
Stock markets
Bond markets
Currency markets
Commodity markets
Real estate markets
No matter how diversified a portfolio is, systematic risk will still influence the overall value because it impacts all components of the financial system.
Systematic risk is often represented mathematically through beta (β), a metric that shows an asset’s sensitivity to market movements. A beta above 1 means the asset is more volatile than the market, while a beta below 1 means it is less volatile.
2. Sources of Systematic Risk in the Global Market
a. Economic Cycles
The global economy moves in cycles: expansion, peak, contraction, and recession. When major economies such as the U.S., China, or the European Union experience slowdown, the effects spread worldwide. Exports decline, capital flows shrink, manufacturing slows, and investor confidence drops. These broad economic cycles cause movements in all markets and are a primary form of systematic risk.
b. Interest Rate Fluctuations
Central banks across the world—especially the U.S. Federal Reserve—play a powerful role in global financial stability. When interest rates rise:
Borrowing becomes expensive
Business expansion slows
Consumer spending reduces
Stock markets often fall
Similarly, lowering interest rates can stimulate markets but may also fuel inflation or asset bubbles. Because interest rates influence global capital flows, they are a major generator of systematic risk.
c. Inflation and Deflation
High global inflation reduces purchasing power, increases input costs for companies, weakens consumer spending, and raises interest rates. It affects:
Corporate profits
Bond yields
Commodity prices
Exchange rates
Deflation, though less common, can be equally dangerous, as it leads to falling prices, reduced business revenues, and prolonged recessions.
d. Geopolitical Tensions
In a highly interconnected world, geopolitical risks have immediate and widespread effects. Examples include:
Wars and military conflicts
Trade wars
Diplomatic breakdowns
Cyberattacks on national infrastructure
These events can disrupt energy supplies, manufacturing hubs, commodity routes, and global investor sentiment.
e. Currency Risk
Currency fluctuations affect international trade, corporate earnings, and global investments. When a major currency like the U.S. dollar strengthens:
Emerging markets face capital outflows
Dollar-denominated debt becomes more expensive
Commodity prices fall (as most are priced in USD)
Currency instability is a core component of systematic risk.
f. Global Pandemics and Natural Disasters
Events like the COVID-19 pandemic demonstrated how quickly the global financial system can be disrupted. Lockdowns halted manufacturing, slowed trade, reduced demand for oil, and triggered a worldwide recession. Natural disasters such as earthquakes, floods, and climate disasters also create global economic ripple effects.
g. Technological Change
Rapid innovation brings both opportunity and risk. Automation, AI, cybersecurity threats, and digital currency transitions can destabilize industries and markets. While this risk is often overlooked, technological disruption can create large-scale economic shifts.
3. Why Systematic Risk Cannot Be Eliminated Through Diversification
Investors commonly use diversification to reduce exposure to individual company or sector risk. However, systematic risk affects all sectors at the same time. During a global recession or major geopolitical conflict, even well-diversified portfolios tend to decline.
For example:
In 2008, during the global financial crisis, almost all equity markets crashed.
In 2020, during the pandemic, global markets fell simultaneously.
Oil shocks, interest rate hikes, and currency crises affect entire asset classes.
The only way to manage systematic risk is through hedging, asset allocation, and risk management techniques, not through simple diversification.
4. Measuring Systematic Risk
a. Beta (β)
Beta measures how responsive an asset is to market swings. A beta of 1 means the asset moves with the market. Higher than 1 indicates greater sensitivity.
b. Value at Risk (VaR)
VaR estimates how much an investment might lose during normal market conditions.
c. Stress Testing
Financial institutions simulate worst-case scenarios—interest rate spikes, geopolitical events, currency crashes—to assess vulnerabilities.
d. Global Risk Indexes
Indexes such as the VIX (volatility index) provide insight into market-wide fear or uncertainty.
5. Examples of Systematic Risk Events in Global Markets
a. The 2008 Global Financial Crisis
Triggered by U.S. mortgage defaults, it spread globally, collapsing banks, stock markets, and entire economies.
b. COVID-19 Pandemic (2020)
Markets worldwide plunged as economic activity halted.
c. Russia–Ukraine War (2022–present)
Caused spikes in oil, gas, wheat, and metal prices, impacting inflation worldwide.
d. U.S.–China Trade War
Tariffs on hundreds of billions of dollars in goods disrupted global supply chains.
These events show how interconnected the world is—and how quickly systemic risk spreads.
6. Managing Systematic Risk
While it cannot be eliminated, investors and institutions use strategies to reduce exposure:
a. Hedging
Using options, futures, or inverse ETFs to protect portfolios.
b. Asset Allocation
Balancing between equities, bonds, gold, cash, and real estate to reduce volatility.
c. Geographic Diversification
Investing across multiple countries to limit exposure to any single region.
d. Investing in Low-Beta Assets
Such as defensive sectors—utilities, healthcare, consumer staples.
e. Risk-Aware Investing
Regular portfolio rebalancing, stress testing, and risk monitoring.
7. Conclusion
Systematic risk is a permanent and unavoidable part of global financial markets. It arises from broad, powerful forces—economic cycles, geopolitical tensions, interest rate movements, inflation, currency fluctuations, natural disasters, and technological disruptions. Because it affects all sectors, industries, and economies simultaneously, diversification alone cannot remove it.
Understanding systematic risk helps investors prepare for market volatility, manage portfolios more effectively, and make informed decisions in a world of growing uncertainty. As global markets become more interconnected, the importance of understanding and managing systematic risk continues to increase, ensuring long-term stability and resilience.
SOLUSD SHORTTERM BUY BIASTook a BUY position and targeting this level 145.46 as my Target Level, SOLUSD is overall bearish, but we should see a consolidation just towards the 146 area, before a possible push downwards...
*TRUST THE SYSTEM*

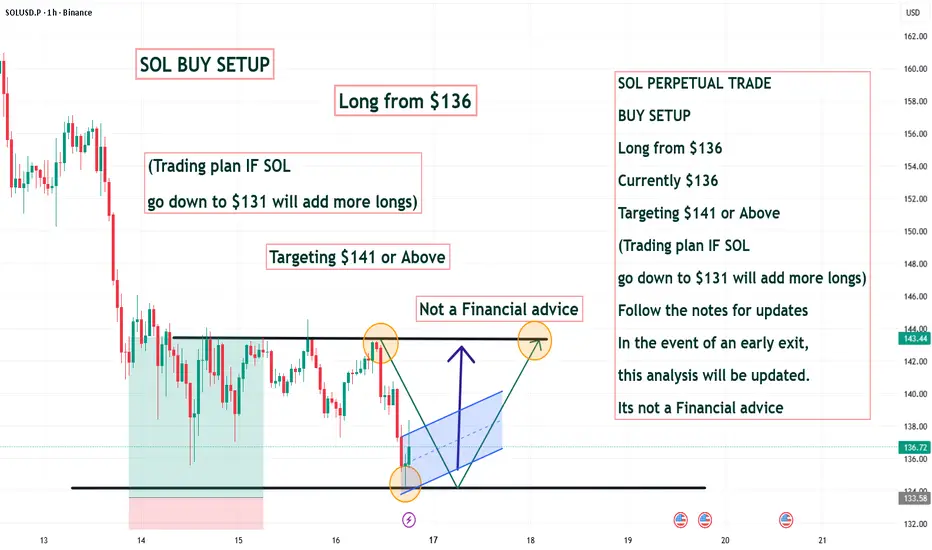
SOL PERPETUAL TRADE BUY SETUP Long from $136SOL PERPETUAL TRADE
BUY SETUP
Long from $136
Currently $136
Targeting $141 or Above
(Trading plan IF SOL
go down to $131 will add more longs)
Follow the notes for updates
In the event of an early exit,
this analysis will be updated.
Its not a Financial advice
Solana bearish viewIn my view solana fall will continue , first target could be 41$ area , if this level will not hold we could see a massive fall to 12$ area before bullish reverse will start

SOL/USD – Oversold but Still in Downtrend🔴 Bias: Bearish → Bounce-prone
Price: $139.7
Below SMA200 ($180). RSI ~31 → heavily oversold.
Key Levels
Resistance: $145 → $155
Support: $136 → $130
Read:
SOL is in the same phase as ADA but not as weak. The $136–$130 zone is real support from past liquidity sweeps. Bounce potential is there due to RSI exhaustion, but trend is unquestionably down.

Recovery? I believe solana is slowly recovering ❤️🩹. I believe we will see solana up at $150 by the end of the week. I've se up a stop loss at $135. If trend fully recovers we'll see it back to $200.
Inside the falling wedge: H&S followed by ascending triangleWe are here looking at the end of a falling wedge, here a H&S (+double top) was formed causing the price to go down and a retest from the long term uptrend line. We bounced from this and can see a ascending triangke there. We have seen that before inside this same wedge. Will we see a breakout occur (market with orange circle) the closer we get to Dec? What else is expected for Dec? The possible end of QT (which is bullish for us)! See my linked idea also.

Solana vs USD – Bearish Playbook High-Probability Swing Setup🔹 Asset: SOL/USD – “SOLANA VS U.S. DOLLAR”
🔹 Trade Style: Crypto Market Opportunity Blueprint (Swing Trade)
🔻 Plan: Bearish Plan
📍 Entry Zone
You can enter at any price level according to your strategy and confirmation signals.
🛑 Stop Loss (SL)
This is Thief SL → @ 152.50
Dear Ladies & Gentleman (Thief OG’s), adjust your SL based on your own strategy & risk levels.
🔔 Important:
Place SL only after breakout confirmation.
I am not recommending to use only my SL. It’s your choice — you make money, you take money at your own risk.
🎯 Target (TP)
Market has strong support + oversold conditions + potential trap zones, so kindly exit with profits.
Our Target → @ 125.00
🔔 Important:
Dear Ladies & Gentleman (Thief OG’s), I am not recommending to use only my TP.
It’s your choice — you make money, you take money at your own risk.
📊 Related Pairs to Watch (Correlation Guide)
1️⃣ BITSTAMP:BTCUSD – Bitcoin
King of crypto; SOL often follows BTC’s direction.
If BTC breaks down, SOL bearish continuation becomes stronger.
2️⃣ BITSTAMP:ETHUSD – Ethereum
High correlation with major altcoins.
ETH weakness usually signals pressure on L1 chains like SOL.
3️⃣ COINBASE:AVAXUSD – Avalanche
Competitor L1 chain; often moves in similar sentiment flow.
If AVAX also shows bearish structure → confirms broad L1 weakness.
4️⃣ COINBASE:LTCUSD – Litecoin
Old major coin; used for risk-on/risk-off sentiment checks.
If LTC dumps → market-wide bearish confirmation.
5️⃣ CRYPTOCAP:TOTAL2 – Altcoin Market Cap
Measures overall altcoin health.
If TOTAL2 breaks its support → SOL likely accelerates toward bearish target.
🔍 Why These Pairs Matter? (Key Correlation Points)
BTC sets the tone – SOL follows the major trend 75–85% of the time.
ETH determines altcoin liquidity – if ETH dominance rises, SOL loses capital flow.
AVAX acts as sector correlation – L1 competitors weaken together during bearish cycles.
TOTAL2 confirms broad alt weakness, making SOL’s downside more reliable.

SOL - Long - 175The Crypto is expected to take support at 120 and 106.
These support may push the coin to 175 levels.

Carbon Credit Secrets: Market Opportunity, Gobal Economic Shift1. What Carbon Credits Actually Represent (The Real Meaning)
A carbon credit is 1 metric ton of CO₂ (or equivalent greenhouse gas) reduced, captured, or avoided.
But the secret is: it’s not just a certificate—it’s a transferable promise of environmental impact.
Industries that produce high emissions (oil, steel, cement, power) must offset their pollution by purchasing these credits from companies that reduce emissions (solar farms, reforestation projects, biogas plants, green tech).
This creates a supply–demand tension, which becomes the heart of the carbon market.
2. The Two Carbon Markets (Most People Don’t Know the Difference)
Carbon credits exist in two major forms, and understanding them is crucial:
(A) Compliance Market (Regulated Market)
Managed by governments.
Mandatory for polluting industries.
Prices are higher because companies have no choice but to buy.
Examples:
EU ETS (European Union Emissions Trading System)
California Cap-and-Trade
China National ETS
This market is worth hundreds of billions of dollars globally.
(B) Voluntary Carbon Market (VCM)
Companies buy credits voluntarily to appear green.
Tech companies, airlines, luxury brands often participate.
Price varies widely (₹200 to ₹2,000 per credit).
The secret here is: the voluntary market is expected to grow 15x–20x in the next decade because nearly every large corporation has signed a "Net Zero by 2050" pledge.
This massive corporate pressure will create explosive demand.
3. How Carbon Credits Are Created (The Hidden Engine Behind Supply)
A carbon credit is not just printed—it must be generated, verified, and issued based on real climate impact.
There are four main sources:
1. Nature-Based Solutions
Reforestation
Mangrove restoration
Soil carbon storage
Avoided deforestation
These projects create long-term, high-quality credits.
2. Renewable Energy
Solar farms
Wind farms
Hydro projects
Earlier common, but now some countries limit renewable credits because it’s becoming the norm.
3. Waste & Methane Reduction
Landfill methane capture
Biogas projects
Improved cookstoves
These are cheap to generate and highly scalable.
4. Technology-Based Solutions
Carbon capture & storage (CCS)
Direct air capture (DAC)
Low-carbon manufacturing
This is the future of premium credits.
4. The Secret Behind Carbon Credit Prices (Why They Vary So Much)
Carbon credit prices depend on:
Project type
Country
Verification body
Demand pressures
Market perception
Co-benefits (biodiversity, community development)
But the biggest secret:
High-quality credits can sell for 5x–20x the price of low-quality credits.
Example:
A basic renewable credit may sell at ₹200–₹500
A genuine rainforest preservation credit can sell at ₹2,000–₹10,000
The market rewards authenticity and long-term climate impact.
5. The Verification Game (Where the Real Power Lies)
Carbon credits are only valuable if verified by third-party bodies:
Verra
Gold Standard
ACR
CAR
GCC
These agencies act like credit rating agencies in financial markets.
Their approval means a project is legitimate.
Secret:
In carbon markets, verification = value.
Without verification, the credit is worthless.
This creates a competitive advantage for projects that follow strict rules.
6. Why Carbon Credits Are Becoming a Trading Market
Carbon credits are now:
Tokenized
Traded on exchanges
Stored on blockchain
Sold in futures & forwards
Bundled into ETFs
This financialisation of carbon credits is transforming them from environmental tools to investable commodities, similar to oil, gold, or energy futures.
Even large financial institutions like JPMorgan, BlackRock, and Standard Chartered are entering the carbon markets.
Hidden secret:
Companies hoard carbon credits today expecting prices to rise sharply in the future.
This creates scarcity.
7. The Global Push That Will Explode Carbon Credit Demand
There are six megatrends driving the carbon boom:
1. Over 5,000 companies have net-zero commitments.
They must buy credits.
2. International aviation (CORSIA) mandates offsetting.
Airlines are huge buyers.
3. Countries are adding carbon taxes.
Businesses pay if they don’t reduce emissions.
4. ESG investing pressures all listed companies.
Investors prefer greener companies.
5. More countries joining Emissions Trading Schemes (ETS).
China, India, Brazil, Middle East expanding systems.
6. Public pressure forces companies to go green.
Brand image depends on carbon neutrality.
Demand will outpace supply, causing prices to rise.
8. India’s Role – The Quiet Giant
India is becoming one of the world’s biggest carbon credit suppliers because of:
Massive renewable energy growth
Agriculture-based carbon projects
Biogas & waste management projects
Reforestation potential
Low project development cost
In 2023, India restarted its voluntary carbon market, and soon a regulated national ETS will launch.
Secret:
India may become the Saudi Arabia of carbon credits
due to its high-volume, low-cost production capability.
9. Carbon Credits as a Trading Opportunity (The Insider View)
Carbon trading is becoming a hot space for:
Hedge funds
Commodity traders
Energy companies
Environmental firms
Retail investors (via funds or platforms)
The real trading profits come from:
1. Forward contracts (pre-purchase deals)
Buying credits early at low price and selling once verified.
2. Vintage trading
Older credits often sell cheaper; traders buy and resell.
3. Quality arbitrage
Spotting underpriced premium credits.
4. Tokenized credits
Blockchain carbon projects allow fractional ownership.
5. Exchange-traded carbon allowances
Like EU ETS futures.
10. The Biggest Secret – Carbon Credits Will Become Scarcer
Global climate goals require:
45% emission reduction by 2030
Net zero by 2050
But current carbon credit supply covers less than 5% of the needed reduction.
This gap is the biggest secret opportunity:
**Carbon credits will get more valuable every year.
Scarcity will drive long-term price appreciation.**
Some experts predict a 500%–1000% rise in premium credit prices within a decade.
11. The Dark Side – Fraud & Low-Quality Credits
Yes, carbon markets have flaws:
Overestimated emission reduction
Fake tree plantations
Double counting
Poor verification standards
Greenwashing by big brands
This is why transparency, digital MRV (monitoring-reporting-verification), and blockchain solutions are becoming essential.
Smart investors focus only on:
Verified
Transparent
High-quality
Long-term
Durable carbon removal credits
Final Takeaway
Carbon credits are not just an environmental tool—they are becoming:
A global commodity
A future trading instrument
A corporate necessity
An economic climate currency
Understanding carbon credits today gives you a powerful advantage in:
Trading
Investing
Business strategy
Sustainability consulting
The biggest secret is simple:
As carbon limits tighten, the value of every real carbon credit will rise sharply.

SOLUSD⬆️ Buy Entry: 140.000
⏹️ Stop Loss: 124.00
*️⃣ Take Profit-1: 157.000
*️⃣ Take Profit-2: 170.000

SOLANA GO SHORTBearish Momentum in the Short Term
Price fell below key support levels: SOL slipped under $150, with the next support zones around $142 and $140. A breakdown below $140 could extend losses toward $132 or even $120.
Chart structure shows downtrend: SOL has formed a series of lower highs and lows since early November, confirming bearish momentum, supported by declining On-Balance Volume (OBV) and a Money Flow Index (MFI) below 50.
Technical indicators remain weak: Trading below multiple EMAs (20, 50, 100, 200) indicates sellers are firmly in control
In the immediate term, Solana is more likely to go down ("go short") rather than rebound. The technicals and on-chain flows favor a continuation of the current pullback.

SOL PERPETUAL TRADE BUY SETUP Long from $136SOL PERPETUAL TRADE
BUY SETUP
Long from $136
Currently $136
Targeting $141 or Above
(Trading plan IF SOL
go down to $132 will add more longs)
Follow the notes for updates
In the event of an early exit,
this analysis will be updated.
Its not a Financial advice
