SOLO - long term visionT.A explained -
BackSide (BS)
FrontSide (FS)
Inverse BS (Inv.BS)
Inverse FS (Inv.FS)
BS & FS levels are expected support when dashed lines, tested when dotted and resistance when solid lines.
The inverse is true for the Inv. BS Inv. FS levels, they are resistance as dashed lines, tested as dotted and support as solid lines.
Monthly timeframe is color pink
weekly grey
daily is red
4hr is orange
1hr is yellow
15min is blue
5min is green if they are shown.
strength favors the higher timeframe.
2x dotted levels are origin levels where trends have or will originate. When trends break, price will target the origin of the trend. its math, when the trend breaks, the vertex breaks too so the higher timeframe level/trend that breaks, the more volatility there could be as strength in the orders flow in to fuel the move.
yesterday
Trade closed manually
price followed the candle science and timeframes from the 5min green levels to the weekly grey level. Price has left behind some inverse frontside and inverse backside candles which look to be forming the bridge to flip the script if price manages to gain those levels and start accumulation. That liquidity will "unlock" and fuel price action.
Trade ideas

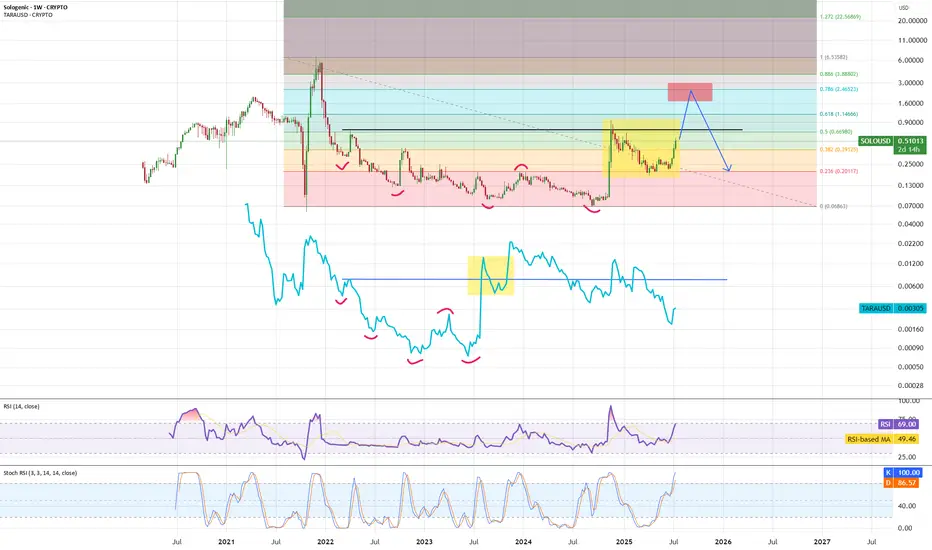
SOLO - final push up before bigger correctionSOLO is using same algo as Tara and is now in last impulse up to reach fibb 0.786 range. Aftert that we will get a bigger correction - likely testing fibb 0.236 range so secure profits on time.
SOLO Crypto - Potential Entry Areas for BuyAs with all of the other crypto in the bull run, SOLO is among those that move quickly over the course if just one week up to the $0.95 price point. We have the signal for a retracement with price closure below the last bullish candle and key areas of interest (shown as purple boxes).
Price action looks to be approaching our entries before returning movement to the upside (market dependent).

Sologenic $SOLO #yourownleader $SOLO $XRP $COREUMGrab some I advise, that’s all..
Some around 50c
@ .25c if you’re lucky
Good luck,
Thank you,
🧑🚒HM

Look this SOLO guy clearlyYep, its just a lower TF to u my dearz, that u can admire my predictionz and make some

Dear Hun, SOLOng! Do u like Star Wars? I do
But I vote for Empire! :) Damn rebelz!
look what I found)
x37 to ATH from currnet price. I will buy some for SPOT on Bybit, will update it soon.
nice Ripple project, increazed volumez, pick up some, friendz.
AND REMEMBA! GREED IZ NOT A SIN :)

SOLOUSDTRisk warning, disclaimer: the above is a personal market judgment based on published information and historical chart data on Tradingview, all analysis is only subjective. Hope investors consider, that I am not responsible for your investment decision.
Thank you.
Good luck

Solo USD Trading Ideawe had a large uptrend, i guess we will retest the support Zone and after that, retest the 50% Retracement Fibonacci Zone, what falls Hard, goes up fast.
This is just my opinion no buy or sell Advice.
