XRP Chart Analysis 21/8/68XRP is currently moving within a sideways channel, awaiting a clear breakout direction. The key support lies at 89 THB, which coincides with the previous swing low and the 100-day EMA. A breakdown below this level would shift the trend into bearish territory.
Trading Strategy:
Consider accumul
Related pairs
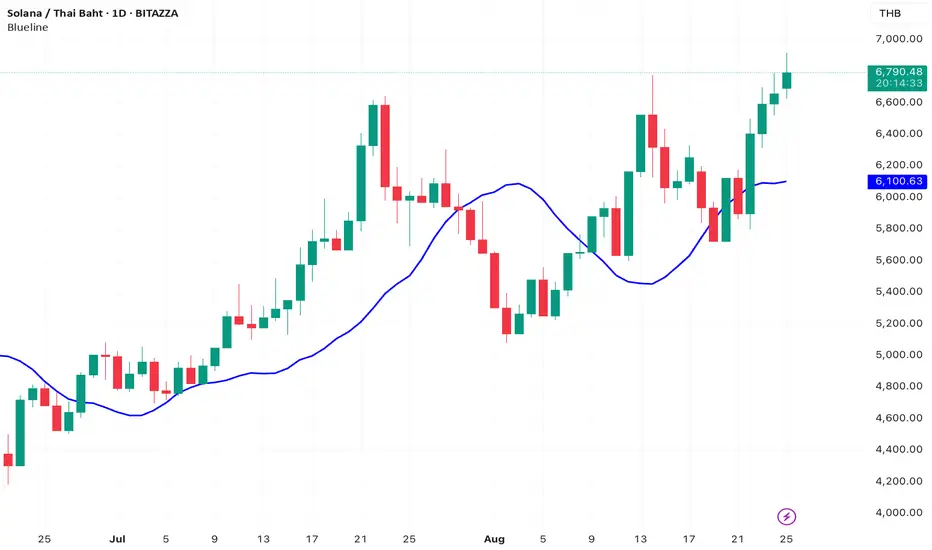
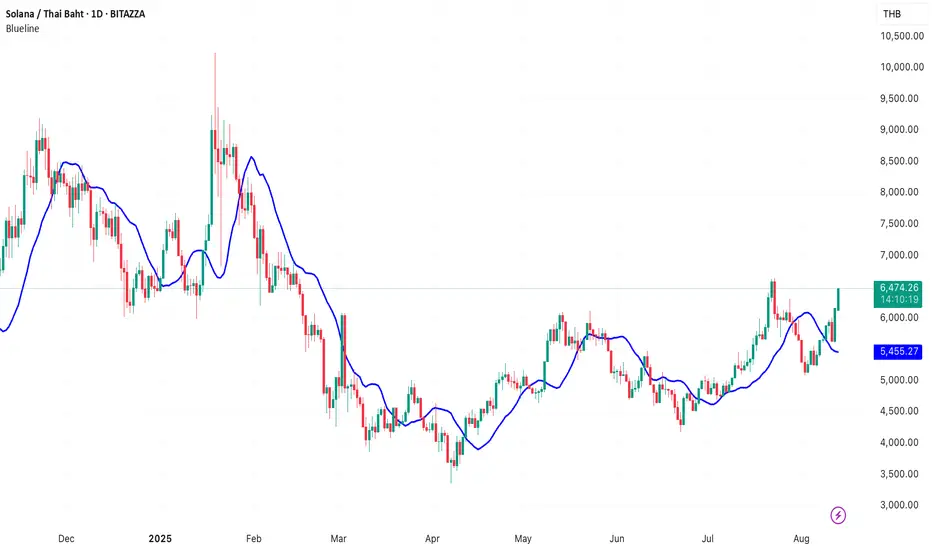
SOL Chart Analysis 13/8/68SOL has broken above its descending trendline, signaling a potential shift in momentum. If the price can clear the key resistance at 6,600 THB, the broader trend will turn bullish, supported by a Golden Cross as the 50-day EMA crosses above the 200-day EMA. The medium-term target is a retest of the
SOLTHB | Contracting triangle possible breakout Price action and chart pattern trading setup
> Elliott Wave position: Standard Zigzag ABC correction ending with contracting triangle about to breakout
> Entry at stop loss eater dump and pump at SMA50
> 1st Target at SMA20 zone 0.5 and 2nd target at previous 3rd Wave position zone 0.786 - 1.0
> Sto

See all ideas
Summarizing what the indicators are suggesting.
Oscillators
Neutral
SellBuy
Strong sellStrong buy
Strong sellSellNeutralBuyStrong buy
Oscillators
Neutral
SellBuy
Strong sellStrong buy
Strong sellSellNeutralBuyStrong buy
Summary
Neutral
SellBuy
Strong sellStrong buy
Strong sellSellNeutralBuyStrong buy
Summary
Neutral
SellBuy
Strong sellStrong buy
Strong sellSellNeutralBuyStrong buy
Summary
Neutral
SellBuy
Strong sellStrong buy
Strong sellSellNeutralBuyStrong buy
Moving Averages
Neutral
SellBuy
Strong sellStrong buy
Strong sellSellNeutralBuyStrong buy
Moving Averages
Neutral
SellBuy
Strong sellStrong buy
Strong sellSellNeutralBuyStrong buy
Displays a symbol's price movements over previous years to identify recurring trends.